Does Document Relevance Affect the Searcher’s
Perception of Time?
Cheng Luo
†, Yiqun Liu
†, Tetsuya Sakai
3, Ke Zhou
2, Fan Zhang
†, Xue Li
†, Shaoping Ma
†*Tsinghua National Laboratory for Information Science and Technology, Department of Computer Science and Technology, Tsinghua University, Beijing 100084, China
3Waseda University
2School of Computer Science, University of Nottingham
[email protected]
ABSTRACT
Time plays an essential role in multiple areas of Information Re-trieval (IR) studies such as search evaluation, user behavior anal-ysis, temporal search result ranking and query understanding. Es-pecially, in search evaluation studies, time is usually adopted as a measure to quantify users’ efforts in search processes. Psychologi-cal studies have reported that the time perception of human beings can be affected by many stimuli, such as attention and motivation, which are closely related to many cognitive factors in search. Con-sidering the fact that users’ search experiences are affected by their subjective feelings of time, rather than the objective time measured by timing devices, it is necessary to look into the different factors that have impacts on search users’ perception of time. In this work, we make a first step towards revealing the time perception mecha-nism of search users with the following contributions: (1) We es-tablish an experimental research framework to measure the subjec-tive perception of time while reading documents in search scenario, which originates from but is also different from traditional time perception measurements in psychological studies. (2) With the framework, we show that while users are reading result documents, document relevance has small yet visible effect on search users’ perception of time. By further examining the impact of other fac-tors, we demonstrate that the effect on relevant documents can be also influenced by individuals and tasks. (3) We conduct a prelim-inary experiment in which the difference between perceived time and dwell time is taken into consideration in a search evaluation task. We found that the revised framework achieved a better cor-relation with users’ satisfaction feedbacks. This work may help us better understand the time perception mechanism of search users and provide insights in how to better incorporate time factor in search evaluation studies.
Keywords
User Behavior; Interactive Information Retrieval; Time Percep-tion
1. INTRODUCTION
Time plays an essential role in multiple areas of Information
Re-Permission to make digital or hard copies of all or part of this work for personal or classroom use is granted without fee provided that copies are not made or distributed for profit or commercial advantage and that copies bear this notice and the full cita-tion on the first page. Copyrights for components of this work owned by others than ACM must be honored. Abstracting with credit is permitted. To copy otherwise, or re-publish, to post on servers or to redistribute to lists, requires prior specific permission and/or a fee. Request permissions from [email protected].
WSDM 2017, February 06-10, 2017, Cambridge, United Kingdom
© 2017 ACM. ISBN 978-1-4503-4675-7/17/02. . . $15.00 DOI:http://dx.doi.org/10.1145/3018661.3018694
trieval (IR) research, such as user behavior analysis [42, 11], fresh-ness based result ranking [19] and query understanding [46]. Espe-cially, time is one of the most important concerns in search evalua-tion. Traditional system-oriented search effectiveness metrics such as MAP, NDCG and ERR implicitly assumed that users would ex-amine documents in a ranking from top to bottom and spend equal time on assessing each result. In practical search scenario, many as-pects such as document length, users’ reading speed and Web page layout would affect the time required. To take these factors into consideration and provide more reliable evaluation results, Time-Biased Gain (TBG) [54] tries to quantify benefits obtained from search results and the time taken to achieve those benefits.
Another line of IR evaluation research, referred to as user-oriented approaches, focuses on quality judgment based on actual user be-havior during interactive retrieval sessions (e.g. satisfaction, A/B test, etc.). Recently, much effort has been paid to model the key aspects of users’ interactions: benefit and cost [2, 3, 36, 37]. The dwell time on landing pages/search sessions is usually used as an important indicator of both search outcome and effort [61].
We can see that in these studies (both system-oriented and user-oriented), time can be two sides of the same coin in search process. It both serves as a metric of effort and as a signal of search users’ benefit. Therefore, the time factor has been one of the key concerns in IR evaluation.
Despite the great efforts researchers have invested in time-based evaluation studies, we found that the time factor in most existing works is theobjectivetime measured by timing devices instead of thesubjectivetime perceived by search users. We believe it is more intuitive to adopt perceived time because effort itself represents the exertion of mental power and is highly likely to be subjective.
In the field of psychology, time perception, or the subjective ex-perience of time, is a construction of the brain that is manipulable and distortable under certain circumstances. There is a wide range of studies on time and temporal processing [27]. Many cognitive and behavioral functioning of human beings is based on process-ing temporal information to some extent [50]. Psychologists have found that the perception of the passing of time is influenced by many psychological factors, such as attention [56], task complex-ity [33] and emotion [22]. Although many of these factors are also regarded as important research issues in IR community, whether and how these factors will affect the time perception of search users has not been investigated.
while playing video games or reading an interesting novel) would lead to the underestimation of the perceived duration [26]. It makes us wonder whether there are differences in the time perception of search users while reading relevant and irrelevant documents, since previous studies also indicated that different levels of document rel-evance lead to various patterns of user behaviors [32]. Is users’ time perception affected by document relevance because they are more interested in relevant documents? Is users’ perceived time overes-timated or underesoveres-timated compared to the actual duration? How do the above answers vary across different search tasks and indi-viduals? To shed light on these research questions, we carefully design an experimental system to measure users’ perceived time in a search related task setting. In this setting, we simulate a search user’s result document reading process and focus on how users try to comprehend the documents to fulfill their information needs. We also attempt to measure users’ perceived time by adopting a number of different measurement methods so that the differences between dwell time and perceived time can be investigated.
The main contributions of this paper are stated as follows: (1) We establish an experimental research framework to measure the sub-jective perception of time in search scenario with three different measurements. These methods originate from but are different from existing time perception measurements in psychological studies. (2) With the framework, we investigate users’ time perception be-haviors while reading result documents to fulfill their information needs. We show that in this scenario, relevance, as one of the most concerned factors in IR, has small yet visible effect on users’ per-ception of time: users tend to relatively underestimate their dwell time durations on relevant documents. (3) We conduct a prelimi-nary experiment by considering the difference between dwell time and perceived time in a search evaluation task and demonstrate that the metric with the users’ perceived time outperforms the metric with actual dwell time in correlating with users’ satisfaction feed-backs.
2. RELATED WORK
2.1 Time in IR related studies
Time and temporal information are widely used in multiple per-spectives of IR studies.
InSearch Intent Understanding, the queries which have a tem-porally dependent intent are usually recognized astime-sensitive
queries [21], whose best search results change with time, for ex-ample “Presidential elections”. The temporal aspects are identi-fied [6, 48, 30] and integrated into the overall ranking mechanism to improve the freshness and relevance of search results [45, 23, 20, 38, 13]. From the aspect of time urgency, some queries are
time-critical, where users have urgent information needs in the con-text of an acute problem, for example, “stroke in woman” [46]. Crescenzi et al. shows that time pressure would lead to changes in user behavior [18, 17]. Mishra et al. proposed a model to predict ur-gent information needs with features including user behavior [46]. On the opposite side of time-critical queries, Teevan et al. explored “slow search”, a class of search where traditional speed require-ments are relaxed in favor of a high quality search experience [58]. In User Behavior Analysis, different temporal measurements have been proposed as users’ implicit feedbacks [10]. For example,
time-between-clicksis an estimation of users’ dwell time on landing page. It is widely used in multiple applications: satisfaction predic-tion [39], search success evaluapredic-tion [31], result usefulness [41] and task difficulty prediction [43].
InSearch Evaluation, time is taken into consideration in both offline and online evaluation methods. In offline evaluation, time is
either explicitly used as the parameter in decay function (for ex-ample, Time Biaed Gain [54] and Expected Latency-discounted Gain [1]) or implicitly encoded in other measures, such as exami-nation depth in Precision and Recall, and the length of trailtext in U-measure [51]. Recently, researchers focus on directly modelling essential aspects of users’ interactions, for example, benefits and costs. Time is widely used as an estimation of users’ search cost in practical computation of corresponding theories [4], for example, Information Foraging Theory [49], Interactive Probability Ranking Principle [25] and Search Economic Theory [2]. It is intuitive that more time spent on a specific action (examining a snippet, reading a document etc.) indicates more cognitive resources invested in it. Similar to system-centric evaluation, time is also encoded in other measures like the number of queries per session [36]. For benefits, Time Well Spent (TWS) [15], defined as the total time spent on relevant material, measures the utility users have gained in search.
2.2 Time Perception in Psychology
Time perception, also known asspecious presentorperceived present[9, 24], has been carefully studied for decades in the fields of psychology and neuroscience. It refers to the subjective experi-ence of the objective time which applies to two different concepts: the concept of succession and the concept of duration. That is to say, while time itself is objective, the perception of the elapsed time is a subjective process [14]. Time perception is a function of both the temporal and non-temporal information available [59].
Based on phenomenological and experimental data, psycholo-gists have paid much attention to what the human being is able to know about time through perception and estimation of duration. The experiments are usually adopted in two paradigms: prospec-tivetiming andretrospectivetiming [8], i.e whether the participants are informed of the time estimation before experiments. Dan Za-kay [62] summarizes several models of time perception theory and concluded that time perception could be manipulated by the fol-lowing factors: non-temporal information processing load (simple or complex stimuli), type of judgment (absolute or relative), and experiment paradigm (prospective or retrospective).
Time perception is influenced by many aspects, such as the cog-nitive load, attention, interestingness and etc. [56]. Although some of them have been explored by IR researchers [47], their impacts on search users’ time perception have not been paid enough atten-tion. When a task becomes more complex, people tend to under-estimate the actual passage of time [33]. According to attentional model of time perception, when attention is focused on something beyond time, time seems to pass more quickly [12]. The accelera-tion also happens if the task is interesting [57]. Hornik found that people tend to overestimate the passive duration and underestimate the positive duration [34]. These findings have potential impacts in time-related IR studies because they affect the perceived time du-ration to some extent. However, none of these factors’ influences in search users’ time perception processes have been studied.
2.3 Experimental Measurements of Perceived
Time
Time perception is measured by someone’s own perception about the duration of the indefinite and continuous unfolding of events. Thus, there is no straightforward way to measure the subjective perceived time [27]. In psychology, many methods have been ex-plored for estimating the perceived time depending on the experi-mental paradigms and the range of durations.
a verbal estimation of its duration, using temporal units. (2) Repro-duction: an experimenter presents a target interval with a continu-ous sound or flash and asks a participant to reproduce the length of the interval by some operation. (3)Production: the experimenter specifies a target interval in temporal units. Then a participant pro-duces this interval. (4)Comparison: a participant is presented with two different durations and is then asked to make a judgment about which duration is longer.
One problem that can occur is that the awareness of duration es-timation is a concern in the experiment has probably slowed down the cognitive process [28, 27]. One way to get around this problem is to have a series of tasks performed by participants and to only inform them that the duration of each portion is to be estimated after all the tasks have been completed. Using multiple tasks be-fore asking for time judgments opens the door to the possibility of using different methods, like asking for relative judgments about the duration of these tasks. Several relative estimation methods are proposed: Segmentation(SG) [7],Relative Comparison(RC) [7] andBound(BD) [29]. These methods allow the participants to es-timate the durations after the cognitive process. In our experiment, we adopt the above mentioned methods (SG, RC and BD) to col-lect estimations of multiple documents, which allow participants to read documents in a natural way. More details will follow in Section 3.
3. EXPERIMENT SETUP
To investigate the perceived time of users in the context of search, we designed and conducted a user study with several tasks.
3.1 Experimental Scenario
As shown in Figure 1, the participants were situated in a Web-based system. For a specific task, the participant is shown a topic description and then presented with four documents. He/she needs to read each document and make relevance judgments sequentially. We manipulate the sequence and relevance of the documents to re-duce the impact of document orders on experimental results. After reading all the documents of a task, the participant needs to esti-mate how long he/she has spent on each document. For quality con-trol concerns, the participants were instructed to summarize what they have learnt from the documents after reading all documents for the task.
Details of the experimental procedure are stated in Section 3.5. We note that the simulated result document reading experiment is similar to but also different from the standard TREC relevance judgment settings. For example, the summarization after reading documents requires the participants to comprehend the documents while in traditional relevance judgment settings, only the relevance score is required from the assessors. We tried our best to simulate a process in which users’ information needs are satisfied via doc-ument reading. We are aware that it is not exactly the same as a practical Web search environment since we do not include the in-teraction with search engine result pages (SERPs). However, there are many complex features that may affect users’ time perception on SERPs (e.g. result presentation, result position, examination sequence, etc.) and it is a non-trivial task to capture all these fac-tors even for a lab-study. As a first step towards understanding the user’s time perception in Web search, we focus on the document (i.e., landing page) reading process. We would like to leave the question of understanding time perception in a realistic search sce-nario for future work.
3.2 Tasks
In our experiment, the participants are required to complete five tasks with a Web-based system. The tasks vary across four
dif-ferent domains (Science, Politics, Education and History) to make sure that the scenarios are geared toward our participants, e.g. uni-versity students. Each task has a description of information needs to make sure that all users achieve the same understanding of task requirement. For example, in Task #0, the description is “Have you ever experienced one person’s yawning triggered almost all people around begin to yawn? Scientists in different fields have tried to explain this phenomenon. Please learn about the possible causes of the spread of yawning.”.1
Task #0 is used in the instruction and training, while the remain-ing ones are for further analysis. To avoid an orderremain-ing effect, we fix the first task and generate the full permutation, 24 ordered arrange-ments, of the other four tasks. Each participant will be assigned to one of the 24 arrangements randomly. Note that the instruction, tasks and documents are all in English.
3.3 Relevance Manipulation
To investigate how the relevance of documents would affect users’ perceived time, we manipulated the sequence and relevance of the documents. For each task, we prepared 2 relevant (R) documents and 2 irrelevant (I) documents. The relevances of the documents were carefully checked by three professional assessors from a com-mercial search engine company. Each document contains about 300 words (Mean: 304.05, SD: 7.15) to make sure that document length has little impact in the time perception of different docu-ments.
As readability is widely acknowledged to affect the reading pro-cess, we adopt standardized readability tests to measure the degree of complexity of the documents. The readability of each document is checked with an average grade level based on multiple readability formulas (for example, Flesch-Kincaid readability tests, Gunning-Fog Score, etc.) with an open source tool2. The result indicates
that the documents had similar levels of difficulty (Mean:11.44, SD:0.84).
Another factor which may influence user perceived time is the presentation order of documents. We extend the pre-defined tem-plates of document orderings in Scholer et al. [52] by defining a new template,concave. Thus, we have four templates in total: in-creasing(IIRR), decreasing(RRII),zig zag(RIRI) andconcave
(RIIR). The documents in Task #0 are organized as decreasing
(RRII). The four templates were randomly assigned to the remain-ing four tasks. In the data analysis described in Section 5, we intro-duce a measure based on the “relevant-irrelevant” document pairs (hR,Ii). Note that these four templates of document ordering do not cover all the possible sequences, which may introduce a presenta-tion order bias, e.g. considering all thehR,Iidocument pairs, it is more likely that the first document (R) is shown to the users before the second one (I). In Section 5.4, we will demonstrate that the bias has negligible impact in our results.
3.4 Participants
We recruited 24 students (14 females and 10 males, aged from 18 to 23, the median is 19) from a university located in China via email, online forums and social networks. All of the participants are proficient in English and are familiar with basic usage of com-puters. They were informed in advance that their payment for par-ticipation in the experiment would be $15. The experiment actually lasted about 90 minutes and the participants all signed a post facto participation form revealing the real purpose of the experiment.
1Due to space limit, the complete dataset including tasks and
doc-uments is shared anonymously at http://bit.ly/2aNvTWZ
3.5 Procedure
The experiments were performed in a dimly lit room to help the participants focus on the experiment as suggested by Grondin [29]. The participants could perform operation in a Web-based system via a computer with a 23-inch screen. The system clock on the computer was removed.
Before the experiments began, we asked the participants to take off their watches and turn off other timing devices such as cell-phones, tablets and music players. The participants were also re-quired to remove all jewelries or anything that could be a distrac-tion during the experiment. During the experiment, they were not allowed to acquire time from external environment. The study pro-ceeded in the following steps, as shown in Figure 1.
Instruction and TrainingFirst, the participants received instruc-tions via an introductory video. In the video, we introduced the procedure of the experiment, and use Task #0 as an example. More specifically, the participants were instructed that“First, read the task description to understand the information needs; Then you will read four documents retrieved from Web to find useful information. After each document, you need to evaluate how relevant it is. When all the documents are completed, you need to estimate how long you have spent on each document with 3 methods. Note that the time spent on giving relevance scores should not be taken into es-timation. At last, we need you to summarize what you have learnt from these documents.”We carefully explained how to estimate the perceived time with the three methods (SG, RC and BD) mentioned in Section 2.3. We also introduced the typical four-level relevance criteria (very relevant, relevant, marginally relevant and irrelevant) to the participants according to the definition in [55]. The partic-ipants were asked to read two documents before the training task. The first one contains 163 words while the second article contains 307 words. These two documents are not relevant to any of the five the tasks. After reading either document, the participants were in-formed how long they have spent on it in seconds. This step named
Time Trialas suggested in existing psychological studies [27] is de-signed to help the participants experience the elapse of time. Then the participants complete the first task to get familiar with the pro-cedure and the system.
The participant were not informed about the purpose of our ex-periment. According to previous studies [28, 27], the awareness of duration estimation would probably slow down the cognitive process. Based on this consideration, the participants were in-structed that their estimations should be able to reflect their experi-ence about time, rather than be close to the objective time. They were instructed to read documents as reading the search results from a commercial search engine in a natural way, rather than read-ing word by word carefully.
Reading ArticlesFollowing general instructions and the time trail, the participants, for each task, were shown a topic descrip-tion and a hyperlink to start reading the four articles for that topic. Once they reported that they had understood the requirements, they would enter the reading page by clicking the hyperlink. The par-ticipants need to read the four documents in predefined order se-quentially. For each document, the participants were instructed to read the entire article to search for relevant information. After each document, the participants had to make a relevance judgment.
While the relevance judgment between documents might affect the estimation of time, we argue that its impact is very limited. First, the participants were informed explicitly in the instruction stage that time used to give relevance scores should not be taken into consideration when they estimate perceived durations on each document. Second, statistics on all the participants shows that, on average, the participants spent about 100.1 seconds on reading each
document and 3.5 seconds on giving each score. The time for score judgment is much shorter than that for reading documents.
FeedbackAs soon as the documents were completed, the par-ticipants estimated their perceived time in three different methods. Each estimation was performed on an individual Web page to re-duce the explicit reference to other estimations. More specifically, inSegmentation(SG) estimation, as shown in Figure 1(a), a hor-izontal line, which was reported to be the total duration of the four documents, was presented to the participants. They were then asked to move, with mouse, three points in the line to divide the horizontal line into four segments, each representing, from left to right, the relative duration of the four portions in the reading pro-cess, i.e., the durations on four documents. The total length of the four segments is 1000 pixels, if the line is divided into four equal parts, e.g. each segment is as long as 250 pixels, the relative ratio of perceived time on each article is 1 : 1 : 1 : 1. InBound(BD), for each document, the participants were shown a horizontal line on screen as shown in Figure 1(b). They were asked to move two points in the line to anchor the minimal/maximal durations to the nearest 10 seconds. TheRelative Comparison(RC) estimation was based on the use of severalstandard lineson the screen. Each par-ticipant was asked to draw 4 lines by moving the points in standard lines as in Figure 1(c). Each line represents the duration spent on the corresponding document. The maximum length of the line is 100. Our system does not allow the participants to revise an anno-tation that has already been completed.
Before finishing the task, the participants were required to sum-marize their outcome with the help of a predefined question. The answers were typed into a textbox on the Web page. The timestamp and content of every interaction event were recorded on the server.
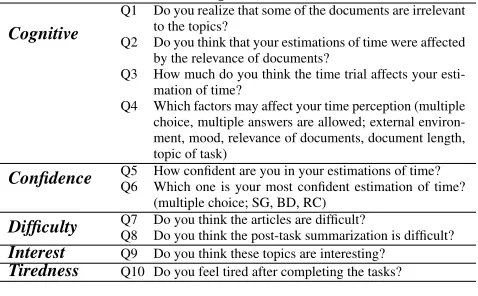
[image:4.612.318.557.451.599.2]QuestionnaireAfter completing all tasks, the participants com-pleted an exit questionnaire on paper. As shown in Table 1, our questionnaires measured topic interests, difficulty, cognitive actions and confidence. Q4 and Q6 are multiple choice questions. For the remaining ones, the participants were asked to respond on a 7-point Likert scale, from strong disagreement (1) to strong agreement (7).
Table 1: Exit questionnaire items
Cognitive
Q1 Do you realize that some of the documents are irrelevant to the topics?
Q2 Do you think that your estimations of time were affected by the relevance of documents?
Q3 How much do you think the time trial affects your esti-mation of time?
Q4 Which factors may affect your time perception (multiple choice, multiple answers are allowed; external environ-ment, mood, relevance of documents, document length, topic of task)
Confidence Q5 How confident are you in your estimations of time?Q6 Which one is your most confident estimation of time? (multiple choice; SG, BD, RC)
Difficulty Q7 Do you think the articles are difficult?Q8 Do you think the post-task summarization is difficult? Interest Q9 Do you think these topics are interesting?
Tiredness Q10 Do you feel tired after completing the tasks?
4. EXPERIMENTAL DATA ANALYSIS
During our user study, we collected the following data as partici-pants completed the reading tasks: (1) The relevance of documents perceived by users on a four-level scale (irrelevant, marginally rel-evant, relrel-evant, highly relevant) [55]. (2) The dwell time and the estimations of perceived time based on three different methods. (3) The post-task summaries and answers to exit questionnaires.
The dwell time on every document is calculated based on the timestamps of interaction events, e.g. clicking the “begin reading” and “finish reading” buttons. Letdtdrepresent the objective dwell
I. Instruction & Training
III. Exit Questionnaire II. Completing Tasks
II.1 Task Understanding
II.2 Reading Articles
II.3 Time Perception
II.4 Summary
(c) Relative Comparison (RC) The four vertical lines,
from left to right, each line indicates the length of the duration you have spent in corresponding article, move the point, get the estimation. Please estimate the
minimal and maximal bound of the duration you have spent in each document.
(b) Bound (BD)
Time 70s!100s
The line below represents the total duration of the four documents. Please move the 3 points to divide the line into four segments, each representing, from left to right, the relative duration of the four portions in the reading process.
(a) Segmentation (SG) Please summarise your search outcome and answer the question in English:
Please try to explain why yawning is contagious?
[image:5.612.57.565.52.201.2]The three estimations are presented separately and sequentially
Figure 1: Procedure of the experiment; (a),(b) and (c) illustate the user interface for three different estimation methods: Segmenta-tion (SG), Bound (BD) and Relative Comparison (RC)
The estimations of perceived time come from 3 different meth-ods. For the durations estimated by SG and RC,tSG
d ,tdRCdenote the
perceived time on documentd respectively, which are measured by the length of segment in SG, or the length of the line in RC. For BD, we have the minimum and maximum of the estimation for each document. The estimated duration,tBD
d , was measured by the
mean of minimum and maximum estimations.
4.1 Effectiveness of Relevance Manipulation
We start the analysis by investigating whether the relevance ma-nipulation is effective, e.g. the agreement between perceived rel-evance by participants and the predefined relrel-evance annotated by our assessors. Since there might be some difference in the habits of reading and cognition between users, slight disagreement about relevance is inevitable.
The perceived relevance was judged on a four-level scale, while the predefined relevance is on a binary scale. We fold the four-level relevance labels into binary labels. Following Scholar and Turpin [53],marginally relevantandirrelevantare grouped as ir-relevant, whilerelevantandhighly relevantare grouped as relevant. Then we can measure the consistency of perceived and predefined relevance by calculating the accuracy for each document.
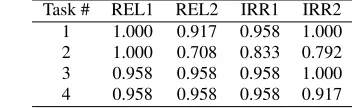
The results in Table 2 indicate that the two kinds of relevance are highly consistent for Task #1, #3 and #4. For Task #2, which is about IVY League’s constitution, origin and development, the accuracy is slightly lower on document REL2 and IRR2. The doc-ument REL2 explains the origin of the name “IVY League” in de-tail and it makes 5 of the 24 participants annotate the document as “marginally relevant”. For IRR2, the article discussed about the disadvantages of elite education. Although the author did not put emphasis on “IVY league”, he held a degree from “IVY league” and was named “IVY retardation” by his friends, which lead 5 out of 24 participants to label it IRR2 as “relevant”.
We also calculated the Cohen’s kappa between the perceived rel-evance and the predefined relrel-evance, as shown in Figure 2. It can be seen that most of the participants reached a high agreement with our assessors. The relatively high agreement supports the effective-ness of our relevance manipulation. In the remainder of this paper, we will use the perceived relevance from participants as theground truth.
4.2 Consistency of Time Perception
Measure-ments
In psychology, it is well known that the perceived time lacks a validated assessment tool and a consensual “gold-standard”
mea-0 0.2 0.4 0.6 0.8 1
1 2 3 4 5 6 7 8 9 10 11 12 13 14 15 16 17 18 19 20 21 22 23 24
C
ohe
n's
K
appa
[image:5.612.320.550.239.306.2]Participants
Figure 2: Cohen’s kappa between perceived relevance by par-ticipants (binary) and predefined relevance
Table 2: Consistency of perceived relevance & predefined rele-vance on documents (REL1, REL2, IRR1, IRR2)
Task # REL1 REL2 IRR1 IRR2 1 1.000 0.917 0.958 1.000 2 1.000 0.708 0.833 0.792 3 0.958 0.958 0.958 1.000 4 0.958 0.958 0.958 0.917
sure. We adopt three different measurements (SG, BD and RC) to assess the estimations. To examine the consistency across these different measurements, we calculated thepairwise agreement pro-portions(pap) following Turpin et al [60].
More specifically, consider an example based on a couple of measurementshM1,M2i and a document pair⌦di,dj↵, di and dj
belong to the same tasks. A participant perceived a longer dura-tion ondi withM1, e.g.tdMi1>t
M1
dj . However, withM2, the
per-ceived time ondjis longer than that ondi,tMdi2<tM2
dj . We can see
that the estimations on⌦di,dj↵with measurementshM1,M2iwould
be adisagreement. Otherwise, it indicatesM1 agrees withM2on
⌦d
i,dj↵. For each participant, we can measure the consistency by
calculating thepapas follows:
pap(hM1,M2i) =
Âhdi,djiI M1agreeswithM2on
⌦d
i,dj↵
#⌦di,dj↵ (1)
[image:5.612.339.515.372.426.2]Overall, the average agreements shown in Table 3 indicates the consistency between different estimations of the perceived dura-tion. This further supports the validity of the following analysis about time perception.
Table 3: Pairwise agreement of different measurements for each participant
# SG|BD SG|RC BD|RC # SG|BD SG|RC BD|RC 1 1.000 0.917 1.000 13 0.875 0.875 0.917 2 1.000 0.917 0.958 14 1.000 0.875 1.000 3 0.958 0.875 0.875 15 0.958 0.958 1.000 4 0.958 0.958 1.000 16 0.708 0.792 0.875 5 0.625 0.833 0.708 17 0.875 0.792 1.000 6 0.875 0.625 0.833 18 0.875 0.833 1.000 7 0.917 1.000 0.958 19 1.000 1.000 1.000 8 1.000 1.000 1.000 20 1.000 0.917 0.958 9 0.875 0.917 0.958 21 0.917 0.917 1.000 10 0.833 0.792 0.958 22 0.917 0.875 0.917 11 0.958 0.958 1.000 23 0.833 0.667 0.750 12 0.958 0.958 1.000 24 0.958 1.000 1.000 Avg. SG|BD: 0.911 SG|RC: 0.885 BD|RC: 0.944
4.3 User Behavior & Feedback
Figure 3 presents the dwell time on relevant and irrelevant doc-uments, averaged on 24 participants. The error bars represent the variances of dwell time. We can see that for all of the tasks, the par-ticipants spent less time on average on the irrelevant documents. This result is in line with the conclusion in previous works [35, 61], indicating that the dwell time is a powerful indicator of rele-vance [42]. Considering that in our experiment, the documents are almost equal in length, the variation of user consumption time on relevant/irrelevant documents is different from the assumption in previous studies (TBG, U-measure), e.g. the users would read the entire document with a constant reading speed.
0 40 80 120 160 200
Task 1 Task 2 Task 3 Task 4
dw
el
ltime
(s
ec
ond)
[image:6.612.59.289.133.251.2]Relevant Irrelevant
Figure 3: Dwell time on relevant/irrelevant documents
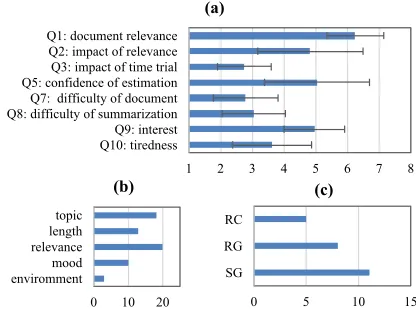
The statistics of the answers to the exit questionnaire is shown in Figure 4. The error bars represent corresponding variances of users’ feedbacks. From the aspect of cognition, we can see that most of the participants are aware of the relevance of documents (Q1, Mean: 6.25, SD: 0.90) and have perceived an intermediate level of influence on time estimation (Q2, Mean: 4.83, SD: 1.65). The participants report a small impact (Q3, Mean: 2.75, SD: 0.85) of the time trial phase. According to the Figure 4(b), 20 of the 24 participants think that their estimations about time have been influ-enced by the relevance. That may be due to the fact that the ob-jective consumption time on irrelevant documents is much shorter than that on relevant documents.
The participants reported a moderate level of confidence in their estimations (Q5, Mean:5.04, SD:1.65), however, they did not reach an agreement about their own most confident estimations, as shown in Figure 4(c). Their perceived difficulty in documents (Q7, Mean:2.79, SD:1.02) and the summarization (Q8, Mean:3.04, SD:1.00) is at low level. An intermediate level of interest (Q9, Mean:4.95, SD:0.85) and a relative low level of tiredness (Q10, Mean:3.62, SD:1.24) was also reported by the participants.
Q10: tiredness Q9: interest
Q8: difficulty of summarization Q7: difficulty of document Q5: confidence of estimation Q3: impact of time trial Q2: impact of relevance Q1: document relevance
1 2 3 4 5 6 7 8
Q10: tiredness Q9: interest Q8: difficulty of summarization Q7: difficulty of document Q5: confidence of estimationQ3: impact of time trial Q2: impact of relevance Q1: document relevance
(a)
0 10 20
enviromment mood relevancelength topic
(b)
0 5 10 15
SG RG RC
(c)
Figure 4: The statistics of the answers to exit questionnaire. (a) answers of rating questions; (b) answer of Q4 (multiple choice); (c) answer of Q6 (multiple choice)
5. RESULTS & DISCUSSION
This section discusses the following four research questions:
RQ1:How can we measure the difference in perceived durations on relevant and irrelevant documents?
RQ2: Does the relevance of documents influence participants’ time perception?
RQ3:If document relevance has an impact on time perception, is the impact consistent across tasks and participants? What are the factors that influence the strength of this impact?
RQ4: Can we use time perception to improve existing search evaluation methodologies?
5.1 Measuring Differences in Time Perception
The measurements of time perception either provide verbal esti-mations of durations in temporal units (in BD), or provide scores which could reflect ratios of perceived time on documents (in SG and RC). To evaluate the difference of time perception between rel-evant and irrelrel-evant documents (RQ1), we first define a new mea-sure namedperceived ratio. LetMbe the estimation of perceived time, theperceived ratioof user on document pair⌦di,dj↵, denoted
byP-ratio M,⌦di,dj↵ is defined as:
P-ratio M,⌦di,dj↵ =log
✓tM
di/dtdi
tM dj/dtdj
◆
=log
✓ tM
di/tdMj
dtdi/dtdj ◆
(2) This metric reflects the difference in perceived time ondianddj
with a ratio normalized by the objective time duration. To inves-tigate the perceived time under different relevance conditions, we can calculateP-ratioon all thehR,Iidocument pairs. TheP-ratio
is defined as a logarithm function to ensure that the absolute value represents the difference between perceived time and actual time duration and the signal (+/-) reflects whether the perceived time is shorter or longer. A more intuitive method is to measure the per-ceived time v.s. dwell time for the same document. However, we found that the ability of estimating durations varies across individ-uals (see Section 5.3), for example, some participants’ estimations are always shorter or longer than the actual durations. TheP-ratio
defined on document pairs would reduce the impact of intrinsic es-timation preference and help us focus on the relative difference of perceived durations between relevant/irrelevant documents.
Note that theP-ratiocan be rewritten as the ratio of perceived time divided by the ratio of actual time. Therefore, it is easy to be calculated for ratio-based time perception estimations such as SG and RC. For a specific measurementM,P-ratio M,⌦di,dj↵ >0
[image:6.612.73.274.401.489.2]withdiand vice versa. Detailed analysis into the pair ofdianddj
can then reveal possible connections between document properties (e.g. relevance) and time perception.
For example, if we have a pair of documentshd1,d2iand a
par-ticular useru. Suppose that the dwell times on d1 and d2 are
10 seconds and 27 seconds, respectively, and that the perceived time ratio on these two documents is 1:3 according to RC. Then
P-ratio(RC,hd1,d2i) =log((1/3)/(10/27)) =log(0.9)<0, which
means that the time perception ond1is relatively short.
5.2 Impact of Relevance
With the definition ofP-ratio, we want to investigate the time perception difference between relevance conditions (RQ2) across different users and tasks. We calculate theP-ratiofor all thehR,Ii
pairs of the four tasks, e.g. all possible combinations of⌦di,dj↵
[image:7.612.335.534.54.211.2]wherediis relevant anddjis irrelevant.
Figure 5 illustrates that the mean ofP-ratiois below but quite close to 0. The mean ofP-ratioon SG and BD is around 0.10. It indicates that the tdM
dtd on relevant documents is 9.5% (e 0.10=
0.905) smaller than that on irrelevant documents, e.g. the perceived times on relevant documents are underestimated.
This result may be explained by the observations in psycholog-ical researches [56] that attention affects time perception. In our experiment, when a participant is reading a document, he/she is probably involved in three different tasks: (a) searching for evi-dences of relevance, (b) consuming relevant content and (c) track-ing of time. This setttrack-ing is referred to asmulti-tasksituation in cognitive psychology [27]. The task (a) and (b) are non-temporal tasks while (c) is a temporal one. The participant is working on (a), (b) and (c) when reading a relevant document. When reading an irrelevant document, he/she mainly focuses on (a) and (c). What is usually found in previous psychological studies is the decrease of the perceived length of an interval as more attention is dedicated to the cognition task (e.g. reading a relevant and interesting docu-ment) instead of tracking of time. It is possible that less attention would be paid to the tracking of time when reading a relevant doc-ument, which further lead to the underestimation of perceived time durations.
The effect of underestimation of time on relevant documents may also be supported by users’ motivation. When a user is read-ing a document, we assume that a relevant document could pro-vide useful information and get him/her more motivated and in a more positive emotional state than an irrelevant document. Pre-vious study shows that high motivation [26], positive emotional state [22] would cause time to be perceived as passing more quickly. We adopt a two-sidedt-test to check whether the means ofP-ratio
from different estimations have a significant difference compared to 0. The results shown in Figure 5 indicate that the difference is significant for SG and BD (p-value<0.05) while the difference on RC is not significant. Although there is small difference between the estimations, they are not conceptually contradictory. As shown in the statistics table in Figure 5, the effect size (ES) of SG and BD is around 0.2 and that of RC is as small as 0.076. Although the two-sidedt-test reports a difference significant atp<0.05 for SG and BD, the relatively small ES suggests that it is a “small” [16] effect.
5.3 Impact of Tasks and Participants
The mean ofP-ratioindicates that there is a small difference in the perceived time when reading relevant/irrelevant documents: the perceived time on relevant documents is underestimated relatively, comparing to that on irrelevant ones. We further explore whether this effect is consistent across tasks and participants (RQ3).
Figure 5:P-ratiodistribution by different measurements of es-timation (SG, BD and RC): breakdown for eses-timation methods (from left to right, SG, BD and RC;⇤: significant at 0.05; the point is mean and the whisker is median)
Table 4 shows theP-ratioon the four tasks finished by our par-ticipants. We conducted a two-sidedt-test for each task. It can be seen that none of the means ofP-ratiois above 0, for all the three measurements of the four tasks. However, only the differences of SG (ES=0.429) and BD (ES=0.380) on Task #4 are significant. A possible reason is that there are fewer samples for each task than the complete dataset. For Task #4, the meanP-ratioof SG, which is re-ported by the most participants as their most confident estimation, is 0.18 indicating that the perceived time on relevant documents is 16.4% shorter, comparing to that on irrelevant documents.
The mean ofP-ratiofor each participant is shown in Table 5. For 13 of the 24 (54.2%) participants, the means ofP-ratioon all the three measurements are below 0. Only 4 (16.7%) participants’ measurements are consistently above 0 (#2, #4, #14 and #20). This result also presents a trend that the perceived time on relevant docu-ment is underestimated, comparing to that on irrelevant docudocu-ments. From the aspect of estimation consistency, we can see that for 17 of 24 (70.8%) participants, their estimations are self-consistent, i.e.
P-ratios from all the three estimations are above 0 or below 0. From the Table 5, we can see that the perceived time varies across participants. For some participants, the “effect of underes-timation” is consistent and significant, for example, the participant #5, #12, #19 and #22. However, for some other participants, the perceived time presents a disagreement within estimations (#3, #6, #8 and etc.) or a contrary effect (#2, #14 and #20). The varia-tion between participants is potentially due to the complex nature of time perception. Both the physical states (age, clinical disorders and etc.) and the psychological factors (emotion, motivation and etc.) would influence the perceived durations [27]. Although we tried our best to control these stimuli, it is possible that there are some implicit variations between individuals.
We further divide the participants into two groups: theType I
group includes the participants who have at least 2 estimations with
P-ratiobelow 0, while theType IIgroup includes the participants who have at least 2 estimations withP-ratioabove 0. In other words, the Type I participants are more likely to have shorter per-ceived times on relevant documents, while the Type II participants are more likely to be opposite. Thus we have 17 Type I participants and 7 Type II participants.
Table 4: P-ratioby different measurements of estimation (SG, BD and RC) on individual tasks (calculated on allhR,Iidocument pairs;⇤: significant at 0.05)
Tasks Task #1 Task #2 Task #3 Task #4
Esti. SG BD RC SG BD RC SG BD RC SG BD RC
P-ratio -0.06 -0.09 -0.02 -0.04 -0.03 0.0 -0.1 -0.09 -0.06 0.18⇤ 0.16⇤ -0.07
t-stat -1.254 -1.728 0.400 -1.078 -0.628 -0.014 -1.671 -1.720 -0.960 -4.159 -3.683 -1.471
df/ES 92/0.131 92/0.180 92/0.042 79/0.121 79/0.071 79/0.002 94/0.172 94/0.177 94/0.099 94/0.429 94/0.380 94/0.152
Table 5: Mean ofP-ratiocalculated by different measurements of estimation (SG, BD and RC); breakdown for individual participant (calculated on allhR,Iidocument pairs;⇤: significant at 0.05); The Type I participants have at least 2 estimations whose means are below 0 while Type II participants have at least 2 estimations whose means are above 0.
Participant Type Type I
Participant # 1 3 5 7 9 10 11 12 13 15 17 18
SG 0.08 0.09 0.16⇤ 0.11 0.06 0.03 0.14 0.34⇤ 0.09 0.41 0.09 0.35⇤
BD 0.20⇤ 0.14 0.13⇤ 0.16⇤ 0.38⇤ 0.05 0.29⇤ 0.49⇤ 0.16 0.06 0.15⇤ 0.16
RC 0.01 0.09 0.12⇤ 0.10 0.02 0.17 0.30⇤ 0.48⇤ 0.25⇤ 0.34 0.14⇤ 0.20
Participant Type Type I (cont.) Type II
Participant # 19 21 22 23 24 2 4 6 8 14 16 20
SG 0.22⇤ 0.07 0.15⇤ 0.03 0.03 0.01 0.06 0.13 0.07 0.10⇤ 0.02 0.04
BD 0.23⇤ 0.06 0.38⇤ 0.18 0.47⇤ 0.25⇤ 0.40⇤ 0.15 0.02 0.03 0.01 0.31
RC 0.25⇤ 0.26⇤ 0.46⇤ 0.13 0.23 0.18 0.19 0.19 0.13 0.14⇤ 0.46⇤ 0.44⇤
I participants (Mean: 4.764, SD: 0.566) is lower than the Type II participants (Mean: 5.842, SD: 1.619), though the significance (p-value=0.124, df=22, ES=0.547) is a little higher than the con-ventional significance level of 0.05. The tiredness level of the Type I participants (Mean: 3.941, SD: 1.434) is higher than the Type II participants (Mean:2.857, SD: 1.143). The results are significant at
p-value0.050 (df=22, ES=0.836). This implies that for the par-ticipants, the less interested in the search tasks, the more sensitive to fatigue, the stronger the effect of their time perception varying according to document relevance can be found. The difference of interest and tiredness may provide some insights into the mecha-nism of underestimation on relevant documents. A potential ex-planation is that when a participant lacks interest and feels tired, it is more likely that he/she would perceive a more direct contrast of emotional states (satisfied or depressed) under different relevance conditions, since he/she would be more sensitive to the efforts and document qualities. This further leads to a stronger effect on time perception. Similar phenomenon has also been observed by psy-chological studies [40]. However, our experiments involve only 24 participants, therefore this result may just be indicative yet incon-clusive. We would leave the further analysis on a relatively large set of users as our future work.
5.4 Other Impacting Factors
As shown in Section 5.2, the mean ofP-ratiovaries across par-ticipants, and it varies with other factors (tasks, presentation order etc.) as well. Some of these factors are controlled by our experi-mental settings, while some others are not. To understand the im-pact of different factors, we adopt a similar approach as Bailey et al. did in analyzing effort expectation [5]. We use cumulative logistic regression to model theP-ratioas a response to a number of poten-tial variables: task (4 levels), participant (one level per participant), document order (2 levels: for document pairhR,Ii, whether the rel-evant document appears before the irrelrel-evant one in the session) and estimation methods (3 levels: SG, BD and RC).
More specifically, theP-ratios are divided into 5 bins of equal length based on their values and the model selection is performed to minimize the Akaike Information Criterion (AIC), which deals with the trade-off between the goodness of fit and the complexity of the model. The model is presented in Table 6. The effects are given as multipliers to odds ratios. Effects greater than 1 mean that comparing to the baseline factor, larger values of response are more likely as the underlying factor increases.
[image:8.612.316.544.411.519.2]We can see that the largest effects are due to the participants, from 0.278 to 8.104. This also correlates with the user variance in aforementioned psychological studies [27]. The tasks introduce a smaller but still notable effect and the effects brought by the dif-ferent methods were very close to each other. Recall our concern in Section 3.2, the incomplete coverage of document presentation orders may introduce a bias to the time perception. The results in-dicates that the effect of document order is almost as large as the estimation method, much smaller than the participants and tasks.
Table 6: Significant factors for estimates ofP-ratiobinin cumu-lative logistic regression model. Larger effects correspond to larger values ofP-ratiomore likely. All effects significant at
p<0.05, Wald test.
Factor Effect (mult. odds)
Participant 0.287⇠8.104 Task 1.391⇠2.092 Document order 0.913
Estimation_SG 0.947 Estimation_BD 0.861 Estimation_RC (baseline) 1.000
5.5 Improving Search Evaluation with Perceived
Time
For a number of search evaluation theories such as Information Foraging Theory, Search Economic Theory etc., users’ effort must be calculated in meaningful units. One of the most widely adopted measures is the dwell time on documents or search sessions. We are interested in whether the differences between perceived time and dwell time can be used to improve search evaluation (RQ4).
To examine the difference between perceived time and actual time duration in search evaluation, we conduct a preliminary study by investigating the correlation between evaluation metrics and sat-isfaction ratings provided by actual users. We choose a public available dataset shared by Liu et al. [44]. In their dataset, user behaviors (e.g. result click-through) are collected from 40 partici-pants while completing 30 search tasks. The relevance of all query-document pairs is annotated by external assessors.
obser-vation in Section 5.2, dwell time on relevant documents tends to be underestimated by users, we also use the sum of the perceived time on clicked results as search effort. Since we cannot collect actual perceived time of users, the perceived time (ptime) could be esti-mated by relatively shortening the duration on relevant documents as Equation 3, whereqdenotes the degree of underestimation. We intuitively letq=0.9 since the perceived time on relevant
docu-ments is about 10% underestimated according to Figure 5.
ptimed= (
dtd·q ifrel(d) 3
dtd otherwise. (3)
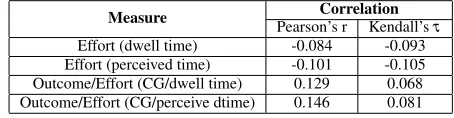
As shown in Table 7, both dwell time and perceived time nega-tively affects users’ satisfaction, while the correlation between per-ceived time and satisfaction is slightly stronger. This result is inline with findings in previous studies [61, 36]. Jiang et al. suggests that satisfaction can be best explained as the value of the search out-come compared with the degree of search effort [36], i.e. the search outcome per effort. Therefore, we extend this analysis by incor-porating search outcome information. In this dataset, each search session has only one query. For a specific session, the user’s search outcome is calculated by summing the gains across the clicked re-sults, e.g. the cumulated gain (CG). We calculate the correlations between the ratio of search outcome divided by search effort and users’ satisfaction. The results are presented in Table 7. It can be seen that both (CG/Dwell Time) and (CG/Perceived Time) has a positive correlation with users’ satisfaction. A slightly stronger correlation is achived when adopting perceived time as indicator of user effort in terms of both Pearson’s r and Kendall’st.
[image:9.612.57.284.527.586.2]Based on the above results, we can see that: (1) When using perceived time in this metric (Search Outcome/Search Effort), the evaluation results would better correlate with users’ satisfaction. Although perceived time does not bring a radical improvement, the difference between perceived time and dwell time is still signifi-cant. This may help us better understand the mechanism of users’ satisfaction. In future work, we are planning to investigate the im-pact of perceived time in a series of time-based evaluation metrics. (2) It is not surprising that the improvement given by perceived time is not very dramatic. Time perception is one of the most fundamen-tal cognitive functions of human beings. Although some factors, for example, document relevance, would lead to atemporal illu-sion[27] to some extent, the effect is not a great distortion.
Table 7: Correlation of several time-based measures with satis-faction reported by actual users (all the correlations are signif-icant atp<0.01)
Measure Pearson’s rCorrelationKendall’st
Effort (dwell time) -0.084 -0.093
Effort (perceived time) -0.101 -0.105
Outcome/Effort (CG/dwell time) 0.129 0.068
Outcome/Effort (CG/perceive dtime) 0.146 0.081
6. CONCLUSIONS AND FUTURE WORK
In this work, we established an experimental framework to mea-sure the subjective perception of time with three different estima-tion methods. Based on a user study conducted in the framework, this paper provides insights on the difference of time perception under different document relevance conditions.
• We find that the users’ dwell time durations on relevant doc-uments are much longer than that on irrelevant ones. This suggests that the assumptions behind a number of existing evaluation measures [51, 54], e.g., that the user reads each document from top to bottom with a constant speed, may not always be appropriate.
• We have observed an impact of document relevance on the time perception: perceived time durations on relevant docu-ments are relatively shortened compared with that on irrel-evant ones. For 17 out of 24 participants, the measurement of time perception is self-consistent across all three different estimation methods.
• We conduct a preliminary study by considering the differ-ence between dwell time and perceived time in a search eval-uation task. Experiments show that the revised evaleval-uation framework achieves a better correlation with users’ satisfac-tion feedbacks. This suggests that we may need to take the document relevance into account when using time as the proxy of effort in evaluation methodologies.
Our study also has a number of limitations. Firstly, our experi-ment was conducted in a task completion scenario in which users are required to annotate the relevance of documents. This may lead to some differences in user behavior comparing to that in Web search. When a person is using a search engine, many factors (pre-sentation, response latency etc.) would influence the time percep-tion process. In this preliminary study, we tried to control the im-pact of corresponding stimuli and focus on the effect of document relevance. The results and findings from this study may provide guidance for further experimental design in a more practical envi-ronment.
Secondly, only 24 participants are involved in our user study. This may have caused underpowered experiments withP-ratioon some tasks and estimation methods. The analyses in Section 5.3 and Section 5.4 show that for each individual, the strength of this effect would be affected by some individual characteristics. A fu-ture analysis on a relatively large scale of users, with more psycho-logical feedbacks collected may provide more insights about the mechanism of time perception in Web search environment.
7. ACKNOWLEDGMENTS
We thank Ms. Cong Wang for providing very useful sugges-tions for this paper. This work was supported by Natural Science Foundation (61622208, 61532011, 61472206) of China and Na-tional Key Basic Research Program (2015CB358700).
8. REFERENCES
[1] J. A. Aslam, M. Ekstrand-Abueg, V. Pavlu, F. Diaz, and T. Sakai. Trec 2013 temporal summarization. InTREC, 2013.[2] L. Azzopardi. The economics in interactive information retrieval. In SIGIR’2011.
[3] L. Azzopardi. Modelling interaction with economic models of search. InSIGIR’2014.
[4] L. Azzopardi and G. Zuccon. An analysis of theories of search and search behavior. InICTIR’2015.
[5] P. Bailey, A. Moffat, F. Scholer, and P. Thomas. User variability and ir system evaluation. InSIGIR’2015.
[6] K. Berberich, S. Bedathur, O. Alonso, and G. Weikum. A language modeling approach for temporal information needs. InECIR’2010. [7] N. Bisson, S. Tobin, and S. Grondin. Remembering the duration of joyful and sad musical excerpts: Assessment with three estimation methods.NeuroQuantology, 7(1), 2008.
[8] R. A. Block and D. Zakay. Prospective and retrospective duration judgments: A meta-analytic review.Psychonomic bulletin & review, 4(2):184–197, 1997.
[9] R. A. Block and D. Zakay. Psychological time at the millennium: Some past, present, future, and interdisciplinary issues.Time: Perspectives at the millennium (The study of time X), 2001. [10] A. Borisov, I. Markov, M. de Rijke, and P. Serdyukov. A
context-aware time model for web search. InSIGIR’2016. [11] P. Borlund, S. Dreier, and K. Byström. What does time spent on
[12] S. W. Brown. Time and attention: Review of the literature. Psychology of time, pages 111–138, 2008.
[13] S. Cheng, A. Arvanitis, and V. Hristidis. How fresh do you want your search results? InCIKM’2013.
[14] S. Chinchanachokchai, B. R. Duff, and S. Sar. The effect of multitasking on time perception, enjoyment, and ad evaluation. Computers in Human Behavior, 45:185–191, 2015.
[15] C. L. A. Clarke and M. D. Smucker. Time well spent. InIIiX’2014. [16] J. Cohen. Statistical power analysis for the behavioral sciences. 2nd
edn. hillsdale, new jersey: L, 1988.
[17] A. Crescenzi, D. Kelly, and L. Azzopardi. Impacts of time constraints and system delays on user experience. InCHIIR’2016.
[18] A. Crescenzi, D. Kelly, and L. Azzopardi. Time pressure and system delays in information search. InSIGIR’2015.
[19] N. Dai, M. Shokouhi, and B. D. Davison. Learning to rank for freshness and relevance. InSIGIR’2011.
[20] N. Dai, M. Shokouhi, and B. D. Davison. Learning to rank for freshness and relevance. InSIGIR’2011.
[21] W. Dakka, L. Gravano, and P. G. Ipeirotis. Answering general time sensitive queries. InCIKM’2008.
[22] S. Droit-Volet, S. L. Fayolle, and S. Gil. Emotion and time perception: effects of film-induced mood.Frontiers in integrative neuroscience, 5, 2011.
[23] M. Efron and G. Golovchinsky. Estimation methods for ranking recent information. InSIGIR’2011.
[24] P. Fraisse. Perception and estimation of time.Annual review of psychology, 35(1):1–37, 1984.
[25] N. Fuhr. A probability ranking principle for interactive information retrieval.Information Retrieval, 11(3):251–265, 2008.
[26] P. A. Gable and B. D. Poole. Time Flies When You’re Having Approach-Motivated Fun: Effects of Motivational Intensity on Time Perception.Psychological Science, 23(8):879–886, Aug. 2012. [27] S. Grondin.Psychology of time. Emerald Group Publishing, 2008. [28] S. Grondin and M. Plourde. Discrimination of time intervals
presented in sequences: Spatial effects with multiple auditory sources.Human movement science, 26(5):702–716, 2007. [29] S. Grondin and M. Plourde. Judging multi-minute intervals
retrospectively.The Quarterly Journal of Experimental Psychology, 60(9):1303–1312, 2007.
[30] D. Gupta and K. Berberich. Identifying time intervals of interest to queries. InCIKM’2014.
[31] A. Hassan. A semi-supervised approach to modeling web search satisfaction. InSIGIR’2012.
[32] A. Hassan, R. Jones, and K. L. Klinkner. Beyond dcg: user behavior as a predictor of a successful search. InWSDM’2010.
[33] R. E. Hicks, G. W. Miller, G. Gaes, and K. Bierman. Concurrent processing demands and the experience of time-in-passing.The American Journal of Psychology, pages 431–446, 1977. [34] J. Hornik. Subjective vs. objective time measures: A note on the
perception of time in consumer behavior.Journal of Consumer Research, 11(1):615–618, 1984.
[35] J. Jiang and J. Allan. Adaptive effort for search evaluation metrics. In ECIR’2016.
[36] J. Jiang, A. Hassan Awadallah, X. Shi, and R. W. White. Understanding and predicting graded search satisfaction. In WSDM’2015.
[37] J. Jiang, D. He, and J. Allan. Searching, browsing, and clicking in a search session: Changes in user behavior by task and over time. In SIGIR’2014.
[38] N. Kanhabua and K. Nørvåg. Learning to rank search results for time-sensitive queries. InCIKM’2012.
[39] Y. Kim, A. Hassan, R. W. White, and I. Zitouni. Modeling dwell time to predict click-level satisfaction. InWSDM’2014.
[40] D. E. Kornbrot, R. M. Msetfi, and M. J. Grimwood. Time perception and depressive realism: judgment type, psychophysical functions and bias.PLOS one, 8(8):e71585, 2013.
[41] C. Liu, J. Liu, N. Belkin, M. Cole, and J. Gwizdka. Using dwell time as an implicit measure of usefulness in different task types.ASS&T, 48(1):1–4, 2011.
[42] C. Liu, R. W. White, and S. Dumais. Understanding web browsing behaviors through weibull analysis of dwell time. InSIGIR’2010. [43] J. Liu, C. Liu, M. Cole, N. J. Belkin, and X. Zhang. Exploring and
predicting search task difficulty. InCIKM’2012.
[44] Y. Liu, Y. Chen, J. Tang, J. Sun, M. Zhang, S. Ma, and X. Zhu. Different users, different opinions: Predicting search satisfaction with mouse movement information. InSIGIR’2015.
[45] D. Metzler, R. Jones, F. Peng, and R. Zhang. Improving search relevance for implicitly temporal queries. InSIGIR’2009. [46] N. Mishra, R. W. White, S. Ieong, and E. Horvitz. Time-critical
search. InSIGIR’2014.
[47] Y. Moshfeghi, L. R. Pinto, F. E. Pollick, and J. M. Jose. Understanding relevance: an fmri study. InECIR’2013. [48] M.-H. Peetz, E. Meij, and M. de Rijke. Using temporal bursts for
query modeling.Information retrieval, 17(1):74–108, 2014. [49] P. Pirolli and S. Card. Information foraging.Psychological review,
106(4):643, 1999.
[50] E. Pöppel. Lost in time: historical foundations and the 3-second-window of temporal integration.Acta Neurobiol Exp (Wars), 64:295–301, 2004.
[51] T. Sakai and Z. Dou. Summaries, ranked retrieval and sessions: A unified framework for information access evaluation. InSIGIR’2013. [52] F. Scholer, E. Maddalena, S. Mizzaro, and A. Turpin. Magnitudes of
relevance–relevance judgements, magnitude estimation, and crowdsourcing. InEVIA’2014.
[53] F. Scholer and A. Turpin. Metric and relevance mismatch in retrieval evaluation. InAIRS’2009.
[54] M. D. Smucker and C. L. Clarke. Time-based calibration of effectiveness measures. InSIGIR’2012.
[55] E. Sormunen. Liberal relevance criteria of trec -: Counting on negligible documents? InSIGIR’2002.
[56] M. Sucala, B. Scheckner, and D. David. Psychological time: interval length judgments and subjective passage of time judgments.Current psychology letters. Behaviour, brain & cognition, 26(2, 2010), 2011. [57] M. L. Sucala and A. S. Tatar. Optimism, pessimism and negative
mood regulation expectancies in cancer patients.Journal of Evidence-Based Psychotherapies, 10(1):13, 2010.
[58] J. Teevan, K. Collins-Thompson, R. W. White, S. T. Dumais, and Y. Kim. Slow search: Information retrieval without time constraints. InHCIR’2013.
[59] E. A. Thomas and W. B. Weaver. Cognitive processing and time perception.Perception & Psychophysics, 17(4):363–367, 1975. [60] A. Turpin, F. Scholer, S. Mizzaro, and E. Maddalena. The benefits of
magnitude estimation relevance assessments for information retrieval evaluation. InSIGIR’2015.
[61] E. Yilmaz, M. Verma, N. Craswell, F. Radlinski, and P. Bailey. Relevance and effort: An analysis of document utility. In CIKM’2014.