Nastaran Dadashi*,**. David Golightly* Sarah Sharples*
*Human Factors Research Group, University of Nottingham, NG7 2RD (e-mail: Nastaran.Dadashi@ Nottingham.ac.uk).
**Centre for Arts, Design and Information Technology, George brown College, Toronto, Canada
Abstract: One of the recurring questions in designing dynamic control environments is whether providing more information leads to better operational decisions. The idea of having every piece of information and increasing situation awareness is so tempting (and in safety critical domains often mandatory) that has become an obstacle for designers and operators. This research examined this challenge within a railway control setting. A laboratory study was conducted to investigate the presentation of different levels of information (taken from data processing framework, Dadashi et al., 2014) and the association with, and potential prediction of, the performance of a human operator when completing a cognitively demanding problem solving scenario within railways. Results indicated that presenting users with information corresponding to their cognitive task (and no more) improves the performance of their problem solving/alarm handling. Knowing the key features of interest to various agents (machine or human) and using the data processing framework to guide the optimal level of information required by each of these agents could potentially lead to safer and more usable designs.
Keywords: Human Computer Interaction, Decision Support System, Usability Engineering.
1. INTRODUCTION
One of the recurring questions in designing dynamic control environments (from a simple mobile app to an advanced control setting) is whether providing more information leads to better operational decisions. The idea of having every piece of information and increasing the so called ‘situation awareness’ (Endsley, 1995) is so tempting (and in safety critical domains often mandatory) that has become a real obstacle for designers and further will become a challenge for operators. This getting lost in the trees and not seeing the woods can potentially lead to fatal errors or at best it will cause operational inefficiencies (e.g. McLennan et al., 2006). The problem is to convince designers and system owners that there is no need to present every piece of information. In doing so, there should be a method of assessing the relevancy and sufficiency of information to guide the order and amount of information presentation.
One such setting is alarm handling in railway control rooms. With the introduction of centralised and integrated control systems different members of staff with different roles are responsible together for broader and more complex problem solving situations (i.e. multi agent control shared between signalling, disruption management and control functions). The challenge facing these operators are twofold: not only they are presented with huge amounts of information but also they have to collaborate with other cognitive entities (in this case human operators) to complete one case of problem solving.
Alarm management is one critical part of ensuring rail infrastructure is operational and running as intended. Alarms can cover issues with the infrastructure (e.g. signal failure, track failure, power failure) or trouble with the system (e.g. system failure), security and fire alarms as well as weather related alarms (e.g. wind alarms, ice alarms). Weather related alarms are important, as they have direct impact on the performance of the train while on the move and failing to address the alarm in timely manner can put the train in an unsafe position (i.e. train speed limits needs to be adjusted in order to be stable during wind gusts) Alarm handling consists of four key activities: notification, acceptance, diagnosis and clearance (Dadashi et al., 2012a).
Thinking about the stages of problem solving in railways, upon introduction of Intelligent Infrastructure (Dadashi, 2012b) railway track workers are responsible for noticing faults and informing control room operators (“notification”). Control room operators then assess the authenticity of the fault (“acceptance”) and conduct the early stages of diagnosis (“diagnosis”) in order to assist the operational railway (“clearance”). This information would then be presented to the strategic analyst, who would recommend long term solutions to the fault and ideally to prevent them in the future (“clearance”).
sequential information presentation that is derived from in-depth understanding of the context.
The question is that whilst designing the intelligent infrastructure user interface, what should be presented to each of these roles to ensure that they are presented with sufficient information to fulfil their role and yet are not overloaded with too much information and hence the problem solving is optimal. A data processing framework (Dadashi et al., 2014) led to categorisation of relevant information to these three levels. These levels are corresponded to the stages of problem solving.
Figure 1 shows the data processing framework and the hypothetical level of information for alarm clearance. The framework has three rows; each row corresponds to different cognitive activities that are required during problem solving (alarm handling in this case). For further details of this framework please see Dadashi et al., 2014. The assumption explored in the present paper is that by presenting the relevant level of information (as recommended by the data processing framework), the performance of operators whilst conducting that cognitive task (alarm handling) will improve.
Fig.1. Hypothetical optimal level of information for alarm clearance
A low fidelity simulated experiment was conducted. The hypothesis explored here is that there is a relationship between the stages of problem solving and their corresponding level of information as suggested in the data processing framework.
2. STUDY APPROACH
Episodes of weather related alarms were simulated for the purpose of this study. Decision ladders (Rasmussen & Goodstein, 1985) developed within an earlier study (Dadashi et al., 2010) led to an understanding of the activities associated with this particular type of alarm and informed the selection of tasks.
2.1 Experimental tasks
Two experimental tasks were selected for this study: 1- alarm acceptance and 2- alarm clearance. They were selected because they incorporated the other two activities that have been identified, i.e., noticing the alarm and diagnosing the alarm. One cannot accept an alarm without noticing it;
similarly, it is impossible to clear an alarm without diagnosing it. Also, both of these activities, i.e., accepting and clearing the alarm require the operator to interact with a system to input information and will provide a measure of performance. It should be noted that these tasks are simplified forms of the activities observed in real wind alarm handling episodes.
Task 1: accepting wind alarms: When an alarm is generated, operators have to check to see if it is authentic or not (i.e. true failure or false alarm). This is referred to as alarm acceptance. When there is a wind alarm, an audible siren will be generated to inform the operator of the alarm.
Participants had to check the wind gust that was shown on the alarm’s main window and compare it against the threshold table provided to them. If the wind gust speed presented on the main window was higher than the threshold, then the alarm was true and participants had to accept it. In order to accept an alarm, participants were instructed to press ‘1’ on the keyboard and, to cancel the alarm, they had to press ‘2’.
Task 2: clearing wind alarms: The second task was to correct the fault by imposing a speed restriction on the train that was entering the alarmed location. The recommended speed restriction varies depending on the type of trains; therefore, the participants had to identify the type of train and impose the specific speed restriction accordingly.
Moreover, if operators were presented with information about ice alarms, they were advised to consider this in their clearance task. If there were also problems with ice in the alarmed location, a new set of speed restrictions had to be recommended. Note that attending to ice alarm information was optional for participants.
2.2 Levels of information
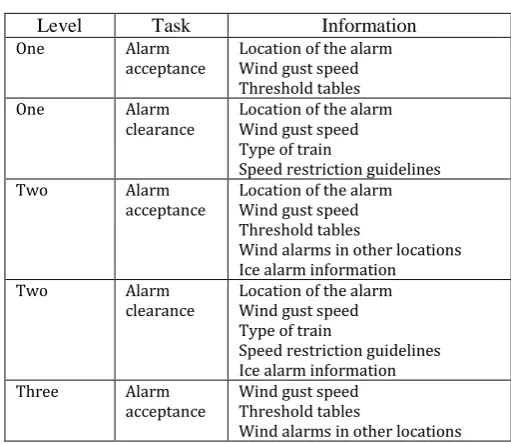
[image:2.595.46.290.335.444.2]Three levels of information as recommended in the data processing framework (Dadashi et al., 2014) were examined in this experiment and it is shown in Table 1 below.
Table 1. Levels of information
Level Task Information
One Alarm
acceptance Location of the alarm Wind gust speed
Threshold tables
One Alarm
clearance Location of the alarm Wind gust speed
Type of train
Speed restriction guidelines
Two Alarm
acceptance Location of the alarm Wind gust speed
Threshold tables
Wind alarms in other locations Ice alarm information
Two Alarm
clearance Location of the alarm Wind gust speed
Type of train
Speed restriction guidelines Ice alarm information
Three Alarm
acceptance Wind gust speed Threshold tables
[image:2.595.297.553.546.768.2]Level Task Information
Ice alarm information
Wind gust speed in the neighboring weather station
Three Alarm
clearance Location of the alarm Wind gust speed
Type of train
Speed restriction guidelines Ice alarm information
2.4 Experimental hypothesis
The alarm acceptance completion time is expected to increase from level 1 to level 3.The first level of information provides the participants with only a basic understanding of the problem by giving tables of train speeds and train types. The second level of information provides the wind alarm status in the neighbouring weather stations to provide the participants with an overview of the domain and the third level of information provides information regarding future potential wind alarms.
The increase in the completion time can simply relate to the increase in the amount of information presented to the participants. Moreover, information at levels 2 and 3 is not necessarily useful for the alarm acceptance task. Although the second level of information can provide participants with an overview (e.g. status of wind alarm in the neighbouring weather stations) of their choice (‘accept’ or ‘cancel’), it is not a necessary piece of information.
Similarly, errors are also expected to increase from level 1 to level 2, but will decrease when participants are presented with the third level of information. The errors in the second level increase possibly because operators become confused and their task does not really need an overview to aid their understanding. However, giving information to participants about future alarms means that, when those alarms occur, they are expecting them and therefore their errors may decrease.
In terms of alarm clearance task completion time will hypothetically increase. The increase in the task completion time is due to an increase in the amount of information presented to the operators.
The errors would probably decrease when operators are presented with the second level of information, as this information will give them a better overview of the problem. When presented with the third level of information, errors would probably increase due to the fact that the information is not directly related to operators’ task at hand. Instead, it provides information about future alarms, but does not add much in terms of the existing situation; such irrelevant information can confuse operators and may increase the error.
3. METHOD
31 students (14 male and 17 female, with a mean age of 22 years) from the University of Nottingham participated in this study. None of the participants had any prior experience of
alarm handling systems but were given related training and were assessed prior to the experiment. Ethical guidelines of the University of Nottingham were followed throughout this laboratory study.
Three groups of participants (group A, group B and group C) were instructed to conduct both alarm acceptance and alarm clearance tasks. A between subject study was designed: each group of participants was presented with only one of the levels of information. Both tasks were examined and participants’ response times and the number of errors they made while conducting the tasks were recorded.
Participants were asked to take note of specific faults that were logged on paper on the fault management system. This secondary task was used to keep the participants occupied between the occurrences of the alarms.
A 15” Sony VAIO™ laptop was used for displaying the screenshots of the wind alarm prototype (Figure 2). The experimental prototype is developed by prime 2.0 ™. E-prime 2.0 ™ is a software that is able to design an experimental study using drag and drop interfaces and simple scripting for the run of the experiment. Therefore, it is possible to define the sequence of activity live logging of participants’ responses and their completion times.
Fig.2. Example of a simulated wind alarm window
A 15” Dell™ laptop was used to display the maintenance control fault log to participants when they were not handling alarms. A fault log recording form was filled in by participants while monitoring the fault log. Finally, an Olympus™ audio recorder was used to record participants’ comments after the completion of the trial.
briefed and trained on task 2 for another 7 to 10 minutes. They then practiced with the experimental prototype, after which they were asked to attend to 16 cases of alarms.
There was a 30 second interval between each of the alarm cases, during which participants were asked to monitor and find ‘point machine’ faults on the fault log and fill in the fault log recording form.
Finally, participants were asked to comment on the alarm episodes and to describe their reasons for the decisions made. Their comments about the experimental prototype and the tasks were recorded using an audio recorder.
4. RESULTS
Participants’ completion times and errors during the trials were recorded through E-prime 2.0™. A 2X3 between subjects ANOVA test was conducted. The results have been analysed statistically using SPSS™ Version 18.0. Participants’ comments were reviewed and the main themes mentioned by participants were identified.
For both alarm acceptance and clearance, a linear increase in response was visible from level 1 to 3. Means of the response times associated with alarm acceptance and alarm clearance tasks while presented with three levels of information are shown in Figure 3 below.
Fig.3. Mean of completion time for two tasks at three different levels (milliseconds)
Multiple comparisons between different levels of information show significant differences between completion times of alarm acceptance with level 1 information, compared with alarm clearance with level 3 information (p<0.05).
Unlike alarm acceptance, when participants were clearing alarms, the completion time were significantly different depending on the level of information: F (2, 28) =11.73, p<0.001. Multiple comparison shows significant difference between all the levels (p<0.001).
The mean of the number of errors while performing both tasks and when participants were presented with the three levels of information is shown in Figure 4. The third level
generates the least number of errors while accepting alarms (task 1).
On the other hand, when participants were clearing alarms, depending on the level of information available to them, their errors were significantly different: F (2, 28) = 5.871, p<0.05. Multiple comparison between different levels of information shows significant difference between levels 1 and 2 (p<0.05) and levels 1 and 3 (p<0.01).
Secondary task performance refers to the percentage of faults logged correctly. The secondary task was designed to keep participants occupied when there was no alarm and it did not target any specific research questions. There was no significant difference between secondary task performance in both alarm acceptance and alarm clearance tasks when presented with various levels of information.
Fig.4. Mean of number of errors for two tasks at three different levels
When participants were presented with the first level of information, they found alarm clearance easier than alarm acceptance. One participant mentioned that “task 2 (alarm clearance) was easier because I only had to look at one thing”. In other words, the perceived difficulty was
associated with the amount of information available, which explains the higher response time for alarm acceptance tasks in comparison with alarm clearance. Out of the 10 participants presented with the first level of information, only one participant said that alarm acceptance was easier than alarm clearance and the reason mentioned was:” the location
of information was more organised on the screen than in task 2”. Although the presentation of information on the screen was not the focus of this study, this participant’s comment suggests that presenting the information on a display affects the user’s perception of task difficulty.
When presented with the second level of information, participants had the option of reviewing location information and using this data for decision making, if they wanted to. Although this was an optional piece of information, all 10 participants in this condition considered it. One of the participants mentioned:” well there is an option there and
you just want to use it”. Unlike the first group (first level of information), 7 of the 10 participants in the second group
Alarm
acceptance Alarm clearance
Level 1 4079.29 3654.85
Level 2 5881.39 10001.32
Level 3 8365.44 15948.68
Time
(m
s)
Alarm
acceptance Alarm clearance
Level 1 1.3 2
Level2 1.4 1.85
Level 3 1.09 2.31
N
u
mber
of
er
ros
found alarm clearance more difficult. This was due to the increase in the amount of information that they felt obliged to review and analyse. This difficulty is reflected in the quantitative data as well: errors and response times are higher for the alarm clearance task than for alarm acceptance. The 3 participants who found task 2 easier under the second condition gave different reasons. One participant said that the second task was easier because they were familiar with the system after performing alarm acceptance. Another participant made a mistake when accepting alarms due to distractions caused by monitoring the fault log and therefore found the task more difficult.
All 11 participants performing the tasks under the third condition attended to location information for the alarm clearance task but mostly ignored it when accepting alarms. One of the participants said that, during alarm acceptance, “I got quite stressed and I could not attend to any additional information regarding the location, I just wanted to deal with the absolute minimum”. However, five participants used the
information regarding the gust speed in the neighbouring location as a clue to predict future alarms. This explains the reason for the lower number of errors when performing the alarm acceptance in the third group (information level 3) in comparison with the other two groups. Participants mainly used these extra pieces of information to investigate a false alarm; if the alarm was true, participants were unlikely to consult any of these sources of information. Other participants chose not to refer to the wind speed in the neighbouring station as they wanted to handle alarms as quickly as possible and therefore did not want to attend to information believed to be beneficial in the future. One of the participants mentioned that: “I was not sure when these alarms would happen, so I thought by the time they are generated I might have forgotten them already”.
In the third group, only one participant used the route information to predict future alarms when clearing alarms; the rest chose not to use that information. One participants mentioned that, “ I felt it was too much”, another said that “ because there were too many pieces of information I knew I would not remember that route anyway, so it was better to deal with them when they were generated”.
In the third group, 7 out of 11 participants found the alarm acceptance task easier than the alarm clearance task. One participant thought that alarm acceptance was more difficult because, in alarm clearance, the user felt more engaged and felt that they had control over the situation. The participant said:”Task 1 (alarm acceptance) is too boring for the operator and should be done by a machine, not a human”. A
number of participants reported confusion when they had to deal with various pieces of information when clearing alarms and admitted that they might have made some mistakes.
6. Discussion
The study presented in this paper attempts to merge two challenging aspects of design that is relevancy and sufficiency of information (i.e. presenting the right information at the right time to the right user). This is a
problem in designing stand alone interfaces and it will grow to be one of the key obstacles in designing multi agent control systems where dynamic information captured from multiple locations are made available to facilitate a centralised decision making task.
The results of the present study suggest that if operators are presented with levels of information that corresponds to their cognitive tasks, their performance will be improved. The information levels and content is explored and indentified through a data processing framework.
These levels of information have commonalities with the three levels of Situation Awareness (perception, comprehension and projection). A more in-depth understanding of the context is required to avoid overloading decision support system’s displays with information in order to satisfy the high situation awareness design requirements.
The framework (Figure 1) identified three categories of data processing: data & information, Knowledge, and intelligence. These corresponded to the three levels of information investigated in the present study. The findings of the simulated study in admittedly limited conditions confirmed the impact of presenting various levels of information to operators at different stages of problem solving.
This study was limited due to low fidelity prototype and possibly the use of students as participants. However, it was believed with the existing scenario (i.e. wind alarm), using railway experts would be biased because it is not possible for an expert operator to distinguish between the two cognitive activities, in other words acceptance and clearance both occurs almost simultaneously and it is extremely difficult to distinguish these two activities.
The other limitation of this study which explains the lack of significant difference can be due to the number of participants. Although this number was suggested through a power analysis, the effect size was estimated to be medium, whereas looking through the mean results, it was best if the effect size were estimated to be low.
Despite this lack of significance the trend observed was in-line with the hypothesis of this study that was inspired through the data processing framework. More research is required to explore this significance.
It is reasonable to assume, from a system engineering perspectives that within integrated and centralised systems (e.g. railway Intelligent Infrastructure, smart home, IoT, etc) , this framework can be utilised to inform the data evolution and processing and can potentially inform the compartmentalisation that is required within design in order to correspond to the function allocation (human or machine).
REFERENCES
Dadashi, N., Wilson, J. R., Golightly, D., & Sharples, S. (2014). A framework to support human factors of
automation in railway intelligent
infrastructure.Ergonomics, 57(3), 387-402.
Endsley, M. R. (1995). Toward a theory of situation awareness in dynamic systems. Human Factors: The Journal of the Human Factors and Ergonomics Society, 37(1), 32-64.
McLennan, J., Holgate, A. M., Omodei, M. M., & Wearing, A. J. (2006). Decision making effectiveness in wildfire incident management teams. Journal of Contingencies and Crisis Management, 14(1), 27-37.
Dadashi, N., Wilson, J. R., Golightly, D., Sharples, S., & Clarke, T. (2012a). Practical use of work analysis to support rail electrical control rooms: A case of alarm handling. Proceedings of the Institution of Mechanical Engineers, Part F: Journal of rail and rapid transit, 0954409712465709.
Dadashi, N. (2012b). Human factors of future rail intelligent infrastructure (Doctoral dissertation, University of Nottingham).
Rasmussen, J., & Goodstein, L. P. (1985). Decision support in supervisory control. Roskilde: Risø National Laboratory.