Face exploration dynamics differentiate men and women
Antoine Coutrot
CoMPLEX, University College London, London, UKNicola Binetti
Department of Experimental Psychology, UniversityCollege London, London, UKCharlotte Harrison
Department of Experimental Psychology, UniversityCollege London, London, UKIsabelle Mareschal
Queen Mary University of London, London, UKAlan Johnston
School of Psychology, University of Nottingham,Nottingham, UKThe human face is central to our everyday social interactions. Recent studies have shown that while gazing at faces, each one of us has a particular eye-scanning pattern, highly stable across time. Although variables such as culture or personality have been shown to modulate gaze behavior, we still don’t know what shapes these idiosyncrasies. Moreover, most previous observations rely on static analyses of small-sized eye-position data sets averaged across time. Here, we probe the temporal dynamics of gaze to explore what
information can be extracted about the observers and what is being observed. Controlling for any stimuli effect, we demonstrate that among many individual
characteristics, the gender of both the participant (gazer) and the person being observed (actor) are the factors that most influence gaze patterns during face
exploration. We record and exploit the largest set of eye-tracking data (405 participants, 58 nationalities) from participants watching videos of another person. Using novel data-mining techniques, we show that female gazers follow a much more exploratory scanning strategy than males. Moreover, female gazers watching female actresses look more at the eye on the left side. These results have strong implications in every field using gaze-based models from computer vision to clinical
psychology.
Introduction
Our eyes constantly move around to place our high-resolution fovea on the most relevant visual
informa-tion. Arguably, one of the most important objects of regard is another person’s face. Until recently, a majority of face perception studies have been pointing to a ‘‘universal’’ face exploration pattern: Humans systematically follow a triangular scanpath (sequence of fixations) over the eyes and the mouth of the presented face (Vatikiotis-Bateson, Eigsti, Yano, & Munhall, 1998; Yarbus, 1965). However, more recent studies found that face-scanning strategies depend upon many factors, including task (Borji & Itti, 2014; Borji, Lennartz, & Pomplun, 2015), social context (Foulsham, Cheng, Tracy, Henrich, & Kingstone, 2010; Gobel, Kim, & Richardson, 2015), emotion (Eisen-barth & Alpers, 2011; Schurgin et al., 2014), personality (Perlman et al., 2009; Peterson & Eckstein, 2013), and even culture (Blais, Jack, Scheepers, Fiset, & Caldara, 2008; Wheeler et al., 2011). For instance, when watching videos of faces, observers believing that the targets would later be looking at them looked
proportionally less at the eyes of the targets with higher ranked social status (Gobel et al., 2015). Other studies showed that when participants discriminate between emotional and neutral facial expressions, distinct fixation patterns emerge for each emotion. In particu-lar, there is a focus on the lips for joyful faces and a focus on the eyes for sad faces (Schurgin et al., 2014). In parallel, it has very recently been shown that humans have idiosyncratic scanpaths while exploring faces (Kanan, Bseiso, Ray, Hsiao, & Cottrell, 2015) and that these scanning patterns are highly stable across time, representing a specific behavioral signature (Mehoudar, Arizpe, Baker, & Yovel, 2014). In the latter study, the
authors asked the subjects to perform a face recogni-tion task during three test sessions performed on three different days: Day 1, Day 3, and 18 months later. Their results show that individuals have very diverse scanning patterns. These patterns were not random but highly stable even when examined 18 months later.
In this study, we aimed to identify which factors drive this idiosyncratic behavior. To quantify their relative contributions, we had to overcome two major difficul-ties. First, in order to take into account as many factors as possible, we needed an unprecedentedly large eye-tracking data set. We had to move beyond the usual small-sized eye-tracking data sets with restricted partic-ipant profiles, the famous WEIRD (western, educated, industrialized, rich, and democratic) population (Hen-rich, Heine, & Norenzayan,2010). To do so, we increased our participant pool by recording and
exploiting the largest and most diverse eye-tracking data set that we are aware of (405 participants between 18 and 69 years old, 58 different nationalities; Winkler & Subramanian, 2013). Second, we needed to equip ourselves with eye-tracking data-mining techniques that could identify and quantify eye-gaze patterns in the data set. The vast majority of previous studies quantified observers’ scanpaths through spatial distributions of eye positions averaged over time, deleting the—manifestly critical—temporal component of visual perception (Le Meur & Baccino, 2013). In contradistinction, we proposed a new data-driven approach able to encapsu-late the highly dynamic and individualistic dimension of a participant’s gaze behavior. We identified systemic differences that allowed a classifier solely trained with eye-tracking data to identify the gender of both the gazer and actor with very high accuracy.
Methods and results
Experiment
This data set has been described and used in a pupillometry study (Binetti, Harrison, Coutrot, John-ston, & Mareschal,2016). Eye data, stimuli, and demographics are available at http://antoinecoutrot. magix.net/public/databases.html.
Participants
We recorded the gaze of 459 visitors to the Science Museum of London, UK. We removed from the analysis the data of participants under age 18 (n¼8) as well as 46 other participants whose eye data exhibited some irregularities (loss of signal, obviously shifted positions). The analyses are performed on a final group of 405 participants (203 males, 202 females). Mean age
of participants 30.8 years (SD¼11.5; males:M¼32.3,
SD¼12.3; females: M¼29.3,SD¼10.5). The experiment was approved by the UCL research ethics committee and by the London Science Museum ethics board, and the methods were carried out in accordance with the approved guidelines. Signed informed consent was obtained from all participants.
Stimuli
Stimuli consisted of video clips of eight different actors (four females, four males, see Figure 1). Each clip depicted the actor initially gazing toward the bottom of the screen for 500 ms, then gazing up at the participant for a variable amount of time (between 100 and 10,300 ms, in 300-ms increments across 35 clips), and finally gazing back at the bottom of the screen for 500 ms. Actors kept their head still and maintained a neutral facial expression. Width3Height¼4283720 pixels (16.78 328.18 of visual angle). Faces occupied most of the image, on average 2803420 pixels (10.98 3
16.48of visual angle). Average size of the eyes was 753
30 pixels (2.98 31.28of visual angle), nose 80390 pixels (3.18 33.58of visual angle), and mouth: 115335 pixels (4.58 31.48 of visual angle). Frame rate¼30 Hz. Videos were shot with the same distance between the actors and the camera in the same closed room with no window in diffuse lighting conditions. Actors sat against a green background, and the point between their eyes (nasion) was aligned with the center of the screen. Hence, the position of facial features slightly varied between actors due to individual morphological differences, but were largely overlapping between actors.
Apparatus
The experimental setup consisted of four computers: two for administering the personality questionnaire and two dedicated to the eye-tracking experiment and actor face-rating questionnaire (see Procedure). Each setup consisted of a stimulus presentation PC (Dell precision T3500 and Dell precision T3610) hooked up to a 19-in. LCD monitor (both 128031024 pixels, 49.98 339.98of visual angle) at 60 Hz and an EyeLink 1000 kit (http:// www.sr-research.com/). Eye-tracking data was collected at 250 Hz. Participants sat 57 cm from the monitor, their head stabilized with a chin rest, forehead rest, and headband. A protective opaque white screen encased the monitor and part of the participant’s head in order to shield the participant from environmental distractions.
Procedure
The study took place at the Live Science Pod in the
The room had no windows, and the ambient luminance was very stable across the experiment. It consisted of three phases for a total duration of approximately 15 min. Phase 1 was a 10-item personality questionnaire based on the Big Five personality inventory (Ramm-stedt & John,2007), collected on a dedicated set of computers. Each personality trait (extraversion, con-scientiousness, neuroticism, openness, and agreeable-ness) was assessed through two items. Item order was randomized across participants. Phase 2 was the eye-tracking experiment. Experimental design features, such as the task at hand or the initial gaze position, have been shown to drastically impact face exploration (Armann & B¨ulthoff, 2009; Arizpe, Kravitz, Yovel, & Baker, 2012). Here, they were standardized for every trial and participant. Participants were asked to freely look at 40 videos of one randomly selected actor. Prior to every trial, participants looked at a black central fixation cross presented on an average gray back-ground. The fixation cross disappeared before the onset
of the stimulus. In each trial, one of 35 possible clips for that same actor was presented. Because there were 40 trials, some clips were presented twice. At the end of each trial, participants were instructed to indicate via a mouse button press whether the amount of time the actor was engaged in direct gaze felt uncomfortably
shortoruncomfortably longwith respect to what would
[image:3.612.126.488.59.415.2]feel appropriate in a realinteraction. Each experiment was preceded by a calibration procedure, during which participants focused their gaze on one of nine separate targets in a 333 grid that occupied the entire display. A drift correction was carried out between each video, and a new calibration procedure was performed if the drift error was above 0.58. Phase 3 was an actor face-rating questionnaire (Todorov, Said, Engell, & Oos-terhof, 2008), in which participants rated on a 1–7 scale the attractiveness, threat, dominance, and trustworthi-ness of the actor they saw during the eye-tracking experiment.
Eye data processing
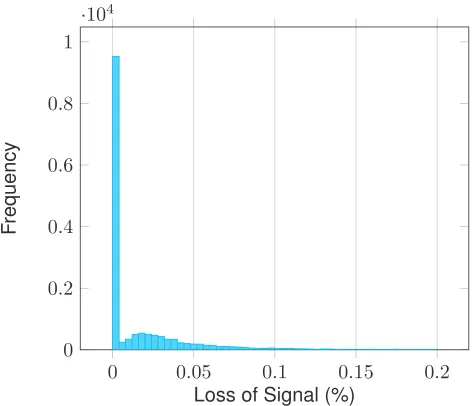
We parsed the (x,y) eye position signal into fixations and saccades with a custom algorithm (Nystr¨om & Holmqvist,2010). This algorithm relies on an adaptive velocity threshold, making the event detection less sensitive to variations in noise level. Hence, detection thresholds varied between trials. Absolute thresholds are used to discard obvious outliers. We used the ones provided by Nystr¨om and Holmqvist (2010, table 2: max saccade velocity¼10008/s; max saccade accelera-tion¼100,0008/s2; min saccade duration¼10 ms, min fixation duration¼40 ms). We provide an example of such parsing, along with the corresponding gazex -coordinate in Figure S6. We also provide the distribu-tions of fixation duration and saccade amplitude for all observers and all trials in Figure S7. Both position and pupil dilation data were further processed through a custom filtering algorithm that substituted signal losses with position/pupil data interpolated from data re-corded prior to and following the loss of signal. For every period of lost data (no size restriction), we performed a linear interpolation of the eye position (x
andycoordinates) and variation in pupil size, using 100 ms of signal before and after loss. We did not set a limit on displacement between preceding and succeeding samples. We discarded all points that fell outside the screen. In average, signal losses represented 2.45%of the trials. Based on this small number, it is unlikely that the interpolation significantly changed the data. Figure S8 shows a histogram of the percentage of data loss for all observers and trials. Pupil diameter was expressed on a trial-by-trial basis as a percentage change in diameter with respect to a baseline measure obtained in a 200-ms window preceding the start of each trial. Environmental luminance was constant throughout the whole experi-ment duration. We postprocessed the pupil signal to minimize artifacts caused by eye position. We removed the pupil foreshortening effect artifact (Jay, 1962; Spring & Stiles, 1948) from the pupil data by implementing a correction technique based on a geometric model that expresses the foreshortening of the pupil area as a function of the cosine of the angle between the eye-to-camera axis and the eye-to-stimulus axis (Hayes & Petrov, 2015). To estimate the variability of eye positions of a given observer, we used a
dispersion metric (Coutrot, Guyader, Ionescu, & Caplier, 2012). Ifneye positions were recorded from an observer,p¼(xi,yi)i[1..n], the eye position coordinates,
the intraobserver dispersion D is defined as follows:
DðpÞ ¼ 1
nðn1Þ
Xn
i¼1
Xn
j¼1 j6¼i
ffiffiffiffiffiffiffiffiffiffiffiffiffiffiffiffiffiffiffiffiffiffiffiffiffiffiffiffiffiffiffiffiffiffiffiffiffiffiffiffiffiffiffiffi
ðxixjÞ2þ ðyiyjÞ2
q
:
ð1Þ
The dispersion is the mean Euclidian distance between the eye positions of the same observers for a given clip. Small dispersion values reflect clustered eye positions.
Scanpath modeling
Hidden Markov modelsTo grasp the highly dynamic and individualistic components of gaze behavior, we model participant’s scanpaths using hidden Markov models (HMMs; Chuk, Chan, & Hsiao, 2014). This method acknowl-edges that visual exploration is a process that unfolds in a particular sequence over time and cannot be
summarized by mere average fixation counts or durations within predefined regions of interest (ROIs). We first represent the average scanpath of each participant as a Markov model. A Markov model is a memory-less stochastic model used for representing probability distributions over sequences of observa-tions or states (St)t[1. . .T]. It is composed of (a) priors
(the probability distribution over the initial state) and (b) a state transition matrix, defining P(StjSt–1), which
encapsulates the probability of travel between states. States can denote processes (e.g., scanning, reading, deciding; Simola, Saloj¨arvi, & Kojo, 2008), isolated targets (e.g., letter, line; Haji-Abolhassani & Clark, 2013), but here, in the specific context of face
exploration modeling, each state represents gaze falling on a ROI of the face. The distribution of eye positions (emission density) within each ROI is modeled as a 2-D Gaussian distribution,N(m,r), withmthe center andr the covariance matrix (the generalization of variance to 2-D) of the Gaussian. Modeling HMM states with Gaussians instead of more isolated targets allows us to relax the point of interest, taking into account
phenomena such as the dissociation between the center of gaze and the covert focus of attention and the imprecision of the human oculomotor system and of the eye-tracker. For more details on eye movement Bayesian modeling, we refer the reader to Boccignone’s (2015) thorough introduction. All the HMM parame-ters (priors, between-state transition probabilities, mean and covariance of the Gaussians) are directly learned from the eye data. They are obtained with the Baum–Welch algorithm, a special case of the expecta-tion–maximization algorithm (Bishop, 2006; Rabiner, 1989). We set the prior means of the Gaussian emissions to be the actors’ nasion and the prior covariance matrix to be isotropic with SD¼200 pixels (roughly the same size as the facial features). We trained one model per participant using their eye positions subsampled at 30 Hz (one value was drawn from the raw signal every cycle). We chose this
time-sampled eye positions instead of successive fixations allowed us to capture fixation duration information in the transition probabilities; 30 Hz is a good trade-off between complexity and scanpath information. To avoid local maximum problems, we repeated the training three times and retained the best performing model based on the log likelihood. We set the number of states to three (imposing the number of states is mandatory in order to cluster the Markov models; Chuk et al., 2014). We also performed the analysis with two and four states, see Figures S1 and S2. With only two states, the models lacked spatial resolution, and with K¼4, one state is often redundant. For this reason, K¼3 was deemed the best compromise. To cluster Markov models, we used the variational hierarchical EM (VHEM) algorithm for hidden Mar-kov models (Coviello, Chan, & Lanckriet, 2014). This algorithm clusters a given collection of Markov models into K groups of Markov models that are similar, according to their probability distributions, and char-acterizes each group by a ‘‘cluster centre,’’ i.e., a novel Markov model that is representative for the group. For more details, the interested reader is referred to the original publication.
One advantage of this method is that it is totally data-driven; we had no prior hypothesis concerning the states parameters. To estimate the global eye movement pattern across all participants, we averaged the
individual Markov models with the VHEM algorithm for a HMM (Coviello et al.,2014). This algorithm clusters Markov models intoN groups of similar models and characterizes each group by a ‘‘cluster centre,’’ i.e., a model representative of that group. Here, we simply setN¼1. In Figure 1a, we show a representative set of seven out of the 405 Markov models with three states we trained with participants’ eye positions sampled at 30 Hz. One can see the great variety of exploration strategies, with ROIs either distributed across the two eyes, the nose, and the mouth or shared between the two eyes or even just focused on one eye. Yet when Markov models are averaged over participants, the resulting center model (Figure 1b) displays a very clear spatial distribution: two narrow Gaussians on each eye and a broader one for the rest of the face. According to the priors, the probabilities at time zero, one is more likely to begin exploring the face from the left eye (66%) than from the background (32%) or from the right eye (only 2%). Moreover, the transition matrix states that when one is looking at the left eye, one is more likely to stay in this state (94%, with a 30-Hz sampling rate) than when in the right eye region (91%) or in the rest of the face (back, 89%). These values are backed up by the temporal evolution of the posterior probability of each state (Figure 1c). We clearly see a very strong left-eye
bias during the first 250 ms. This bias persists throughout but decreases over time.
Clusters of gaze behavior
To test whether this general exploration strategy accounts for the whole population or if there are clusters of observers with different gaze behaviors, we again use the VHEM algorithm. We set N¼2 and obtain two distinct patterns (see Figure S3). To identify the variables leading to these different gaze strategies, we use multivariate analysis of variance (MANOVA). MANOVA seeks to determine whether multiple levels of independent variables, on their own or in combina-tion, have an effect on the affiliation of participants to one group or the other. Here, the categorical variable is binary (group membership). We tested three groups of independent variables: personality traits, face ratings, and basic characteristics (nationality, age, gender of the observer [GO], gender of the corresponding actor [GA], and identity of the actor). We did not include actor’s gaze up time (300–10,300 ms) in the MANOVA as previous analyses showed that this variable does not correlate with any gaze metric except pupil dilation (Binetti et al., 2016). This is coherent with Figure 1, which shows that gaze dynamics plateau 1 s after stimulus onset. Only the basic characteristics group led to a significant separation between the two clusters,
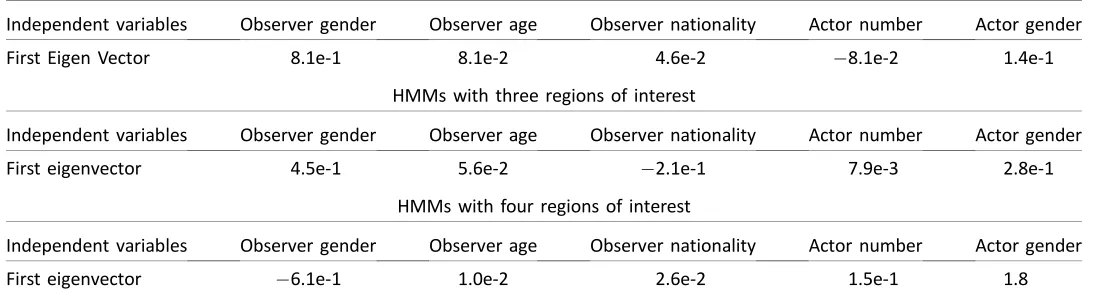
F(1, 404)¼7.5,p¼0.01, with observer and actor gender having the highest coefficient absolute value (see Table S1). Face ratings and personality traits failed to account for the separation between the two clusters, respectively, F(1, 404)¼1.4,p¼0.58, and F(1, 404)¼ 2.0, p¼0.55. We also ran a MANOVA with the three groups of independent variables combined and ob-tained similar results. OtherNvalues have been tested; i.e., we tried to separate the initial data set into three and four clusters of gaze behavior, but the MANOVA analysis was unable to find significant differences between identified groups. We also performed the same analysis (N¼2) for HMMs with two and four states and obtained similar results, see Table S1 for basic characteristics MANOVA coefficients. Hence, GA and GO are the most efficient variables to use to separate exploration strategies into two subgroups. In the following, we closely characterize these gender-induced gaze differences.
Gender differences
Figure 2displays the eye position heat maps of four individuals, each of them being characteristic of one of these groups. We first compared the simplest eye movement parameters between these groups: saccade amplitudes, fixation durations, and intraparticipant dispersion (i.e., eye position variance of a participant within a trial). In the following, the statistical
significance of the effects of actor and observer gender has been evaluated via one-way ANOVAs. Pair-wise comparisons have been explored via Tukey’s post hoc comparisons. We find that for male observers, fixation durations are longer (Figure 3a),F(3, 401)¼10.1,p ,
0.001; saccade amplitudes shorter (Figure 3b),F(3, 401) ¼8.5, p ,0.001; and dispersion smaller (Figure 3c),
F(3, 401)¼12.9,p,0.001, than for female observers. Actor gender does not influence these results. Note that these results are mutually consistent: Shorter saccades and longer fixations logically lead to lower dispersion. Gender also impacts on the increase of pupil diameter: This value is greater in MF than in any other group (Figure 3d),F(3, 401)¼2.8,p¼0.03, consistent with the Belladonna effect (Rieger et al., 2015; Tombs & Silverman, 2004). We used the VHEM algorithm to obtain the center Markov model of these four groups (N¼1 within each group). In all four groups, the spatial distribution of states is similar to the one
depicted in Figure 1b. We computed the posterior probabilities of each state as we did for the whole population (Figure S4). We find that during the first second of exploration, the left-eye bias is stronger in FF than in MM (Figure 3e),F(3, 401)¼3.1,p¼0.02, with no difference between the other comparisons. We also show that one is less likely to gaze at the eyes of a same-sex actor than of a different-same-sex actor (Figure 3f),F(3, 401)¼2.9, p¼0.03.
Gaze-based classification
These patterns appear systematic and rich enough to differentiate both actor and observer gender. To test this, we gathered all the gender differences in gaze behavior mentioned so far to train a classifier to be able to predict the gender of a given observer and/or the gender of the observed face (Figure 4). We started from a set of 15 variables (Di)i [1. . .N], withN the total
number of participants. Vector Di gathers for partic-ipant i the following information: Markov model parameters (spatial [x, y] coordinates of the states ranked by decreasing posterior probability value and posterior probability of the left eye, right eye, and rest of the face averaged over the first second of explora-tion), mean intraparticipant dispersion, mean saccade amplitude, mean fixation duration, mean pupil diam-eter, peak pupil diamdiam-eter, and latency to peak. We then reduced the dimensionality of this set of variables
(Di)i[1. . .N]by applying a MANOVA. We applied two
different MANOVAs: one to optimize the separation between two classes (M observers vs. F observers) and the other to optimize the separation between four classes (MM vs. MF vs. FM vs. FF). The eigenvector coefficients corresponding to each variable are avail-able in Tavail-ables S2 and S3. To infer the gender of an observer j, we used quadratic discriminant analysis (QDA). We followed a leave-one-out approach: At each iteration, one participant was taken to test and the classifier trained with all the others. For each partic-ipant j, we trained a QDA classifier withðEViÞii6¼½j1:::N,
EVrepresenting the first two eigenvectors from the first MANOVA. To infer the gender of both observer jand of the corresponding actor, we followed the same approach with the first two eigenvectors of the second MANOVA. Both classifiers performed highly above chance level (two-sided binomial test, p, 0.001).
Such a classifier is able to correctly guess the gender of the observer 73.4%of the time (two classes, chance level¼50%). It correctly guesses the gender of both the observer and of the corresponding face 51.2%of the time (four classes, chance level¼25%). We obtained similar results with linear discriminant analysis: 54.3% correct classification with four classes, 73.4%correct classification with two classes.
Discussion
Understanding the precise nature of face perception is challenging as the face comprises a high-dimensional, dynamic information space (Jack & Schyns,2015). In this study, we used novel data-mining methods that encapsulate the highly dynamic and individualistic spatiotemporal nature of gaze. Although a few previous studies have used Markov-based analysis with eye-tracking data to identify fixations and saccades (Salvucci & Goldberg, 2000), to infer observers’ tasks
[image:7.612.138.474.59.501.2]exploration strategies. We tested variables related to observers’ psychological profile (personality traits) and how they perceived actors’ face (face ratings) as well as basic demographics, such as age, nationality, and gender. We found both the gender of the observer and of the actor to be the most efficient variables to separate the different recorded exploration strategies into two homogeneous subgroups. This outcome cannot be explained by differences between stimuli because observers’ gender is balanced between stimuli as shown in Figure S5. This is backed up by the very low MANOVA coefficient associated with the identity of the actor (7.9e-3), see Table S1. Our model-based results are supplemented with more classic eye move-ment parameters, such as fixation duration, saccade amplitude, intraobserver dispersion, and pupilometry. In the following, we discuss the different strategies followed by different gender groups as well as their implication in perception bias.
Males are less exploratory than females
We present three complementary metrics indicating that female observers further explore the face they are presented with irrespective of the gender of the actor: Females make shorter fixations and larger saccades and their eye positions are more scattered over the actor’s face. Previous studies have reported the same pattern even with very different stimuli or experimental designs (Mercer Moss, Baddeley, & Canagarajah,2012; Shen & Itti, 2012; Vassallo, Cooper, & Douglas, 2009). For instance, in Shen and Itti (2012), eye movements were recorded while participants watched and listened to different speakers in various outdoor settings. The authors showed that women saccade more often away from the face of the speaker, especially to the body. This difference in gaze behavior has been linked to the greater accuracy of women in the decoding of nonverbal cues (Hall, 1984; Hall & Matsumoto, 2004; McClure, 2000; Schmid, Mast, Bombari, & Mast, 2011). Actively looking for nonverbal cues distributed in many different parts of the face (Vatikiotis-Bateson & Kuratate, 2012) and body of the speakers, especially their hands (Krauss, Chen, & Chawla, 1996), would increase female’s gaze dispersion. However, this hypothesis is undermined by the Reading the Mind in the Eyes test developed by Baron-Cohen, Wheelwright, Hill, Raste, and Plumb (2001), in which participants are asked to associate photographs of pairs of eyes with an adjective (e.g., playful, comforting, irritating, bored). Indeed, females are better than males at this task even though only the eye region is available (Kirkland, Peterson, Baker, Miller, & Pulos, 2013). Furthermore, males have been shown to be less exploratory than females even when exploring visual scenes without any face such as landscapes or art stimuli (Mercer Moss et al., 2012).
Females looking at females have stronger
left-side bias
[image:8.612.40.291.58.331.2]We provide some insights into the time course of the global preference for the eye on the left side. We report a very strong left-eye bias during the first 250 ms of exploration, persisting throughout but decreasing over time. The left-eye bias is a well-documented, face-specific characteristic. This bias is very strong when exploring upright faces, is weaker in inverted faces, and disappears with nonface stimuli whether they are symmetric (vases, fractals) or not (landscapes) (Leo-nards & Scott-Samuel, 2005; Mertens, Siegmund, & Gruesser, 1993). It is often associated with chimeric faces: faces composed of two left halves are often judged to be more similar to the original face than faces composed of two right halves. Other studies have reported than when the left- and the right-hand sides of Figure 4. Gaze-based gender classification. Solely relying on eye
a face are different, observers tend to base their responses on the information contained in the left side. This includes face recognition (Brady, Campbell, & Flaherty, 2005); gender identification (Butler et al., 2005); and facial attractiveness, expression, and age (Burt & Perrett, 1997). The factors determining this lateralization remain unclear. Some obvious potential determining factors have been excluded, such as observers’ eye or hand dominance (Leonards & Scott-Samuel, 2005). Other factors have been shown to interact with the left-side bias, such as scanning habits (left bias is weakened for native readers of right to left; Megreya & Havard, 2011) and start position (bias toward facial features furthest from the start position; Arizpe et al., 2012; Arizpe, Walsh, & Baker, 2015). The most common explanation found in the literature involves the right hemisphere dominance for face processing (Kanwisher, McDermott, & Chun, 1997; Yovel, Tambini, & Brandman, 2008). Although valid when fixation location is fixed at the center of the face, it may seem counterintuitive when participants are free to move their eyes (Everdell, Marsh, Yurick, Munhall, & Par`e, 2007; Guo, Meints, Hall, Hall, & Mills, 2009; Hsiao & Cottrell, 2008). Indeed, looking at the left side of the stimulus places the majority of the actor’s face in the observer’s right visual field, i.e., their left hemi-sphere. An interpretation proposed by Butler et al. (2005) is that starting from a central position—either because of an initial central fixation cross or because of the well-known center bias (Tseng, Carmi, Cameron, Munoz, & Itti, 2009)—the left-hand side of the face activates right hemisphere face functions, making the latter initially more salient than its right counterpart. This interpretation is also supported by the fact that during a face identification task, the eye on the left side of the image becomes diagnostic before the one on the right (Rousselet, Ince, Rijsbergen, & Schyns, 2014; Vinette, Gosselin, & Schyns, 2004). This explains why the left-side bias is so strong during the very first moments of face exploration, but why does it persist over time? Different authors have reported a preferred landing position between the right eye (left visual hemifield) and the side of the nose during face recognition (Hsiao & Cottrell, 2008; Peterson & Eckstein, 2013). This places a region of dense infor-mation—the left eye and brow—within the foveal region, slightly displaced to the left visual hemifield, hence again activating right hemisphere face processing functions. An alternative hypothesis is that the left-side bias could be linked to the prevalence of right-eye dominance in humans. When engaged in mutual gaze, the dominant eye may provide the best cue to gaze direction through small vergence cues. Because the majority of the population is right-eye dominant (Coren, 1993), humans might prefer looking at the right eye (i.e., at the left side of the face) as it provides a
clearer signal of mutual gaze. Here we found the left-side bias stronger in females looking at other females. This strengthening, coupled with the fact that the perception of facial information is biased toward the left side of face images complements an earlier study reporting that females are better at recognizing other female faces whereas there are no gender differences with regard to male faces (Rehnman & Herlitz, 2006). On the other hand, it is inconsistent with another study reporting that when looking at faces expressing a variety of emotions, men show asymmetric visual cortex activation patterns whereas women have more bilateral functioning (Proverbio, Brignone, Matarazzo, Del Zotto, & Zani, 2006). Further investigation is needed to disentangle the interaction between the gender of the observer and of the face observed in the activation of the right hemisphere face processing functions.
Limitations of this study
The authors would like to make clear that this study does not demonstrate that gender is the variable that most influences gaze patterns during face exploration
in general. Many aspects of the experimental design might have influenced the results presented in this paper. The actors we used were all Caucasian between 20 and 40 years old with a neutral expression and did not speak—all factors that could have influenced observers’ strategies (Coutrot & Guyader, 2014; Schurgin et al., 2014; Wheeler et al., 2011). Even the initial gaze position has been shown to have a significant impact on the following scanpaths (Arizpe et al., 2012; Arizpe et al., 2015). In particular, the task given to the participants—rating the level of comfort they felt with the actor’s duration of direct gaze— would certainly bias participants’ attention toward actors’ eyes. One of the first eye-tracking experiments in history suggested that gaze patterns are strongly modulated by different task demands (Yarbus, 1965). This result has since been replicated and extended: More recent studies showed that the task at hand can even be inferred using gaze-based classifiers (Boisvert & Bruce, 2016; Borji & Itti, 2014; Haji-Abolhassani & Clark, 2014; Kanan et al., 2015). Here, gender appears to be the variable that produces the strongest
Conclusion
Using the biggest and most diverse eye-tracking database recorded, we show that the way people look at faces contains systematic variations that are diagnostic of the gender of the observers and of the face they observe. These results have important implications in every field using gaze-based models. For instance, quantifying the nature of face processing and joint attention is critical to the understanding and the diagnosis of disorders, such as schizophrenia, autism, or attention deficit hyperactivity disorder (Freeth, Foul-sham, & Kingstone,2013; Wang et al., 2015). Tailoring these gaze-based models to a masculine or feminine population could lead to significant enhancements, particularly when a substantial sex ratio difference exists (e.g., autism). Going even further, one can speculate that different stimuli could elicit different systematic patterns diagnostic of other observers’ characteristics, such as their state of health or level of cognitive development (Tseng et al., 2013; Wass & Smith, 2014). Given the ubiquitous nature of eye movements, being able to deduce such fundamental characteristics about a person without the need for self-report would have tremendous impact across a broad range of fields.
Keywords: eye tracking, face perception, Markov models, scanpaths, gender difference
Acknowledgments
Competing interests: We have no competing inter-ests. Funding sources: A. C. has been funded by the Engineering and Physical Sciences Research Council (Grant No. EP/I017909/1). N. B., C. H., I. M., and A. J. have been funded by a Leverhulme trust grant (RPG-2013-218). Data accessibility: Eye data, stimuli, and demographics are available at http://antoinecoutrot. magix.net/public/databases.html.
Commercial relationships: none.
Corresponding author: Antoine Coutrot. Email: acoutrot@gmail.com.
Address: CoMPLEX, University College London, London, UK.
References
Arizpe, J. M., Kravitz, D. J., Yovel, G., & Baker, C. I. (2012). Start position strongly influences fixation patterns during face processing: Difficulties with
eye movements as a measure of information use.
PLoS One, 7(2), e31106.
Arizpe, J. M., Walsh, V., & Baker, C. I. (2015). Characteristic visuomotor influences on eye-move-ment patterns to faces and other high level stimuli.
Frontiers in Psychology, 6, 1–14.
Armann, R., & B¨ulthoff, I. (2009). Gaze behavior in face comparison: The roles of sex, task, and symmetry. Attention, Perception, & Psychophysics, 71(5), 1107–1126.
Baron-Cohen, S., Wheelwright, S., Hill, J., Raste, Y., & Plumb, I. (2001). The ‘reading the mind in the eyes’ test revised version: A study with normal adults, and adults with Asperger syndrome or high-functioning autism.Journal of Child Psychology and Psychiatry, 42(2), 241–251.
Binetti, N., Harrison, C., Coutrot, A., Johnston, A., & Mareschal, I. (2016). Pupil dilation as an index of preferred mutual gaze duration. Royal Society Open Science, 3(160086).
Bishop, C. M. (2006). Pattern recognition and machine learning. New York: Springer.
Blais, C., Jack, R. E., Scheepers, C., Fiset, D., & Caldara, R. (2008). Culture shapes how we look at faces. PLoS One, 3(8), e3022.
Boccignone, G. (2015). Advanced statistical methods for eye movement analysis and modeling: A gentle introduction. arXiv, 1506.07194.
Boisvert, J. F. G., & Bruce, N. D. B. (2016). Predicting task from eye movements: On the importance of spatial distribution, dynamics, and image features.
Neurocomputing, 207, 653–668.
Borji, A., & Itti, L. (2014). Defending Yarbus: Eye movements reveal observers’ task.Journal of Vision, 14(3):29, 1–22, doi:10.1167/14.3.29. [PubMed] [Article]
Borji, A., Lennartz, A., & Pomplun, M. (2015). What do eyes reveal about the mind? Algorithmic inference of search targets from fixations. Neuro-computing, 149(Pt. B), 788–799.
Brady, N., Campbell, M., & Flaherty, M. (2005). Perceptual asymmetries are preserved in memory for highly familiar faces of self and friend. Brain and Cognition, 58(3), 334–342.
Burt, M. D., & Perrett, D. I. (1997). Perceptual asymmetries in judgements of facial attractiveness, age, gender, speech and expression. Neuropsycho-logia, 35, 685–693.
eye-movement patterns? Neuropsychologia, 43(1), 52–59.
Chuk, T., Chan, A. B., & Hsiao, J. H. (2014).
Understanding eye movements in face recognition using hidden Markov models.Journal of Vision, 14(11):8, 1–14, doi:10.1167/14.11.8. [PubMed] [Article]
Coren, S. (1993). The lateral preference inventory for measurement of handedness, footedness, eyedness, and earedness: Norms for young adults. Bulletin of the Psychonomic Society, 31(1), 1–3.
Coutrot, A., & Guyader, N. (2014). How saliency, faces, and sound influence gaze in dynamic social scenes. Journal of Vision, 14(8):5, 1–17, doi:10. 1167/14.8.5. [PubMed] [Article]
Coutrot, A., Guyader, N., Ionescu, G., & Caplier, A. (2012). Influence of soundtrack on eye movements during video exploration.Journal of Eye Movement Research, 5(4), 1–10.
Coviello, E., Chan, A. B., & Lanckriet, G. R. G. (2014). Clustering hidden Markov models with variational HEM. Journal of Machine Learning Research, 15, 697–747.
Eisenbarth, H., & Alpers, G. W. (2011). Happy mouth and sad eyes: Scanning emotional facial expres-sions. Emotion, 11(4), 860–865.
Everdell, I. T., Marsh, H., Yurick, M. D., Munhall, K. G., & Par`e, M. (2007). Gaze behaviour in
audiovisual speech perception: Asymmetrical dis-tribution of face-directed fixations. Perception, 36, 1535–1545.
Foulsham, T., Cheng, J. T., Tracy, J. L., Henrich, J., & Kingstone, A. (2010). Gaze allocation in a dynamic situation: Effects of social status and speaking.
Cognition, 117(3), 319–331.
Freeth, M., Foulsham, T., & Kingstone, A. (2013). What affects social attention? Social presence, eye contact and autistic traits.PLoS One, 8(1), e53286. Gobel, M. S., Kim, H. S., & Richardson, D. C. (2015). The dual function of social gaze.Cognition, 136(C), 359–364.
Guo, K., Meints, K., Hall, C., Hall, S., & Mills, D. (2009). Left gaze bias in humans, rhesus monkeys and domestic dogs.Animal Cognition, 12, 409–418. Haji-Abolhassani, A., & Clark, J. J. (2013). A
computational model for task inference in visual search. Journal of Vision, 13(3):29, 1–24, doi:10. 1167/13.3.29. [PubMed] [Article]
Haji-Abolhassani, A., & Clark, J. J. (2014). An inverse Yarbus process: Predicting observers’ task from eye movement patterns.Vision Research, 103, 127–142. Hall, J. A. (1984).Nonverbal sex differences:
Commu-nication accuracy and expressive style. Baltimore, MD: The Johns Hopkins University Press. Hall, J. A., & Matsumoto, D. (2004). Gender
differences in judgments of multiple emotions from facial expressions. Emotion, 4(2), 201–206.
Hayes, T. R., & Petrov, A. A. (2016). Mapping and correcting the influence of gaze position on pupil size measurements. Behavior Research Methods,
48(2), 510–527.
Henrich, J., Heine, S. J., & Norenzayan, A. (2010). The weirdest people in the world? Behavioral and Brain Sciences, 33(2–3), 61–135.
Hsiao, J. H., & Cottrell, G. W. (2008). Two fixations suffice in face recognition. Psychological Science, 19(10), 998–1006.
Jack, R. E., Blais, C., Scheepers, C., Schyns, P. G., & Caldara, R. (2009). Cultural confusions show that facial expressions are not universal. Current Biol-ogy, 19(18), 1543–1548.
Jack, R. E., & Schyns, P. G. (2015). The human face as a dynamic tool for social communication.Current Biology, 25(14), R621–R634.
Jay, B. (1962). The effective pupillary area at varying perimetric angles.Vision Research, 1(5–6), 418–424. Kanan, C., Bseiso, D. N. F., Ray, N. A., Hsiao, J. H.,
& Cottrell, G. W. (2015). Humans have idiosyn-cratic and task-specific scanpaths for judging faces.
Vision Research, 108, 67–76.
Kanwisher, N., McDermott, J., & Chun, M. M. (1997). The fusiform face area: A module in human extrastriate cortex specialized for face perception.
The Journal of Neuroscience, 17(11), 4302–4311. Kirkland, R. A., Peterson, E., Baker, C. A., Miller, S.,
& Pulos, S. (2013). Meta-analysis reveals adult female superiority in reading the mind in the eyes test. North American Journal of Psychology, 15(1), 121–146.
Krauss, R. M., Chen, Y., & Chawla, P. (1996). Nonverbal behavior and nonverbal communica-tion: What do conversational hand gestures tell us?
Advances in Experimental Social Psychology, 28, 389–450.
Le Meur, O., & Baccino, T. (2013). Methods for comparing scanpaths and saliency maps: Strengths and weaknesses.Behavior Research Methods, 45(1), 251–266.
Leonards, U., & Scott-Samuel, N. E. (2005). Idiosyn-cratic initiation of saccadic face exploration in humans.Vision Research, 45, 2677–2684.
development in infants, children, and adolescents.
Psychological Bulletin, 126(3), 424–453. Megreya, A. M., & Havard, C. (2011). Left face
matching bias: Right hemisphere dominance or scanning habits? Laterality: Asymmetries of Body, Brain and Cognition, 16(1), 75–92.
Mehoudar, E., Arizpe, J., Baker, C. I., & Yovel, G. (2014). Faces in the eye of the beholder: Unique and stable eye scanning patterns of individual observers. Journal of Vision, 14(7):6, 1–11, doi:10. 1167/14.7.6. [PubMed] [Article]
Mercer Moss, F. J., Baddeley, R., & Canagarajah, N. (2012). Eye movements to natural images as a function of sex and personality.PLoS One, 7(11), 1–9.
Mertens, I., Siegmund, H., & Gruesser, O.-J. (1993). Perceptual asymmetries are preserved in memory for highly familiar faces of self and friend. Neuro-psychologia, 31, 989–998.
Nystr¨om, M., & Holmqvist, K. (2010). An adaptive algorithm for fixation, saccade, and glissade detection in eyetracking data. Behavior Research Methods, 42(1), 188–204.
Perlman, S. B., Morris, J. P., Vander Wyk, B. C., Green, S. R., Doyle, J. L., & Pelphrey, K. A. (2009). Individual differences in personality predict how people look at faces. PLoS One, 4(6), e5952. Peterson, M. F., & Eckstein, M. P. (2013). Individual differences in eye movements during face identifi-cation reflect observer-specific optimal points of fixation. Psychological Science, 24(7), 1216–1225. Proverbio, A. M., Brignone, V., Matarazzo, S., Del
Zotto, M., & Zani, A. (2006). Gender differences in hemispheric asymmetry for face processing. BMC Neuroscience, 7(44).
Rabiner, L. R. (1989). A tutorial on hidden Markov models and selected applications in speech recog-nition. Proceedings of the IEEE, 77(2), 257–286. Rammstedt, B., & John, O. P. (2007). Measuring
personality in one minute or less: A 10-item short version of the Big Five Inventory in English and German. Journal of Research in Personality, 41, 203–212.
Rehnman, J., & Herlitz, A. (2006). Higher face recognition ability in girls: Magnified by own-sex and own-ethnicity bias. Memory, 14(3), 289–296. Rieger, G., Cash, B. M., Merrill, S. M., Jones-Rounds,
J., Dharmavaram, S. M., & Savin-Williams, R. C. (2015). Sexual arousal: The correspondence of eyes and genitals.Biological Psychology, 104, 56–64. Rousselet, G. A., Ince, R. A. A., Rijsbergen, N., & Schyns, P. G. (2014). Eye coding mechanisms in
early human face event-related potentials. Journal of Vision, 14(13):7, 1–24, doi:10.1167/14.13.7. [PubMed] [Article]
Salvucci, D. D., & Goldberg, J. H. (2000). Identifying fixations and saccades in eye-tracking protocols. In
Proceedings of the symposium on eye tracking research applications(pp. 71–78). New York: ACM. Schmid, P. C., Mast, M. S., Bombari, D., & Mast, F.
W. (2011). Gender effects in information processing on a nonverbal decoding task. Sex Roles, 65(1–2), 102–107.
Schurgin, M. W., Nelson, J., Iida, S., Ohira, H., Chiao, J. Y., & Franconeri, S. L. (2014). Eye movements during emotion recognition in faces. Journal of Vision, 14(13):14, 1–16, doi:10.1167/14.13.14. [PubMed] [Article]
Shen, J., & Itti, L. (2012). Top-down influences on visual attention during listening are modulated by observer sex. Vision Research, 65(C), 62–76. Simola, J., Saloj¨arvi, J., & Kojo, I. (2008). Using
hidden Markov model to uncover processing states from eye movements in information search tasks.
Cognitive Systems Research, 9(4), 237–251. Spring, K., & Stiles, W. (1948). Apparent shape and
size of the pupil viewed obliquely.British Journal of Ophthalmology, 32, 347–354.
Todorov, A., Said, C. P., Engell, A. D., & Oosterhof, N. N. (2008). Understanding evaluation of faces on social dimensions.Trends in Cognitive Sciences, 12, 455–460.
Tombs, S., & Silverman, I. (2004). Pupillometry - A sexual selection approach. Evolution and Human Behavior, 25(4), 221–228.
Tseng, P.-H., Cameron, I. G. M., Pari, G., Reynolds, J. N., Munoz, D. P., & Itti, L. (2013).
High-throughput classification of clinical populations from natural viewing eye movements. Journal of Neurology, 260, 275–284.
Tseng, P.-H., Carmi, R., Cameron, I. G. M., Munoz, D. P., & Itti, L. (2009). Quantifying center bias of observers in free viewing of dynamic natural scenes.
Journal of Vision, 9(7):4, 1–16, doi:10.1167/9.7.4. [PubMed] [Article]
Vassallo, S., Cooper, S. L., & Douglas, J. M. (2009). Visual scanning in the recognition of facial affect: Is there an observer sex difference?Journal of Vision, 9(3):11, 1–10, doi:10.1167/9.3.11. [PubMed]
[Article]
Vatikiotis-Bateson, E., & Kuratate, T. (2012). Over-view of audiovisual speech processing. Journal of Acoustical Science and Technology, 33(3), 135–141. Vinette, C., Gosselin, F., & Schyns, P. G. (2004).
Spatio-temporal dynamics of face recognition in a flash: It’s in the eyes. Cognitive Science, 28, 289– 301.
Wang, S., Jiang, M., Duchesne, X. M., Laugeson, E. A., Kennedy, D. P., Adolphs, R., & Zhao, Q. (2015). Atypical visual saliency in autism spectrum disorder quantified through model-based eye tracking. Neuron, 88(3), 604–616.
Wass, S. V., & Smith, T. J. (2014). Individual differences in infant oculomotor behavior during the viewing of complex naturalistic scenes.Infancy, 19(4), 352–384.
Wheeler, A., Anzures, G., Quinn, P. C., Pascalis, O., Omrin, D. S., & Lee, K. (2011). Caucasian infants scan own- and other-race faces differently.PLoS One, 6(4), e18621.
Winkler, S., & Subramanian, R. (2013). Overview of eye tracking datasets. In Fifth International Work-shop on Quality of Multimedia Experience (Qo-MEX) (212–217). Klagenfurt, Austria: IEEE. Wu, C.-C., Kwon, O.-S., & Kowler, E. (2010). Fitt’s
Law and speed/accuracy trade-offs during se-quences of saccades: Implications for strategies of saccadic planning. Vision Research, 50, 2142–2157. Yarbus, A. L. (1965). Eye movements and vision. New
York: Plenum Press.
Yovel, G., Tambini, A., & Brandman, T. (2008). The asymmetry of the fusiform face area is a stable individual characteristic that underlies the left-visual-field superiority for faces. Neuropsychologia, 46(13), 3061–3068.
Appendix
Figure S4. Clusters of Markov model by observer and actor gender. Left: Markov models belonging to the MM, MF, FM, or FF group clustered via VHEM algorithm. Right: Corresponding posterior probabilities for the three possible states (left eye, right eye, and rest of the face). Error bars representSEM.
Figure S5. For each actor, proportion of male and female participants. Actors 2, 3, 6, and 7 are male, the others are female. The analyses are performed on 405 participants (203 males, 202 females).
[image:17.612.127.487.360.535.2]Figure S7. Distribution of fixation duration and saccade amplitude for all observers and all trials. We used 1,000 bins for both histograms.
[image:18.612.48.284.360.563.2]HMMs with two regions of interest
Independent variables Observer gender Observer age Observer nationality Actor number Actor gender
First Eigen Vector 8.1e-1 8.1e-2 4.6e-2 8.1e-2 1.4e-1
HMMs with three regions of interest
Independent variables Observer gender Observer age Observer nationality Actor number Actor gender
First eigenvector 4.5e-1 5.6e-2 2.1e-1 7.9e-3 2.8e-1
HMMs with four regions of interest
Independent variables Observer gender Observer age Observer nationality Actor number Actor gender
[image:19.612.34.585.72.223.2]First eigenvector 6.1e-1 1.0e-2 2.6e-2 1.5e-1 1.8
Table S1. Coefficients of the first eigenvector of the MANOVA separating the two clusters of HMMs computed via the VHEM algorithm.Notes: We performed this analysis for HMMs with (a) 2 states, (b) 3 states, and (c) 4 states. Categorical variable: cluster 1 or 2. Independent variables: basic characteristics group. This group is the only one that led to a significant separation between the two clusters of Markov models. In the three analyses, the highest coefficient absolute values are the ones of Observer Gender and Actor Gender.
State co-ord. ranked by posterior probabilities Posterior probabilities Classic parameters Pupillometry
x1 y1 x2 y2 x3 y3 Plefteye Prighteye Pback sacc amp fix dur disp p.mean p.peak p.lat
First eigenvector
7.8e-33.5e-3 5.4e-33.0e-3 1.4e-2 3.9e-3 2.8 2.0 2.7 1.5e-4 6.9e-3 1.4e-2 1.5e-4 1.7e-3 9.2e-3 Second eigenvector
[image:19.612.42.577.544.629.2]2.7e-3 9.9e-36.7e-4 1.0e-2 2.3e-3 1.0e-2 13.8 13.8 13.0 2.7e-2 1.8e-32.9e-2 2.8e-3 3.4e-3 1.7e-3
Table S2. Coefficients of the first and second eigenvectors of the MANOVA separating the eye data into four classes: MM, MF, FM, and FF.Notes: Categorical variables: gender of the observer and of the actor. Independent variables: state coordinates ranked by decreasing mean posterior probabilities; mean posterior probabilities of the left eye, right eye, and background; mean saccade amplitude; fixation duration and intraobserver dispersion; mean pupil diameter; maximum pupil diameter; and latency to maximum pupil diameter. The ratio of the between-group variance to the within-group variance for the first eigenvector is 0.39; 0.23 for the second.
State co-ord. ranked by posterior probabilities Posterior probabilities Classic parameters Pupillometry
x1 y1 x2 y2 x3 y3 Plefteye Prighteye Pback sacc amp fix dur disp p.mean p.peak p.lat
First eigenvector
8.5e-3 5.8e-4 4.7e-3 1.5e-3 9.9e-3 2.6e-3 8.9 8.2 8.2 1.3e-2 6.7e-32.3e-4 1.0e-32.4e-47.0e-3 Second eigenvector
5.8e-42.7e-31.1e-21.0e-22.2e-74.7e-25.7e-1 4.2e-1 9.8e-1 3.0e-3 1.8e-31.1e-27.3e-41.4e-35.6e-4