The role of cost-effectiveness analysis in the development of
indicators to support incentive-based behaviour in primary care in
the UK
Declarations
No funding was received for this manuscript and there are no conflicts of interest.
Key Words
primary care; cost-effectiveness; pay-for-performance
Word Count
3,575 Abstract and Main Text
28 References
5 Tables
Abbreviations used
UK
United Kingdom
QOF
Quality and Outcomes Framework
NHS
National Health Service
NICE
National Institute for Health and Care Excellence
ABPM
Ambulatory blood pressure monitoring
QALY
Quality adjusted life year
Abstract
Introduction
The Quality and Outcomes Framework (QOF) is a financial incentive scheme for UK general practices to improve quality of care. These practices’ performance is measured against a set of quality indicators. The scheme was introduced in 2004/05 and is a component of the revised General Medical Services contract between the UK Government and general practice. The funding is intended to reward quality of care, leading to benefits for patients and the National Health Service (NHS). Research has shown that financial incentive schemes have the potential to improve the quality of primary care, though longer-term effects are still unknown.1-3 In addition, there is some evidence to suggest that these incentives have the potential to improve delivery of clinical care in underserved populations.4, 5
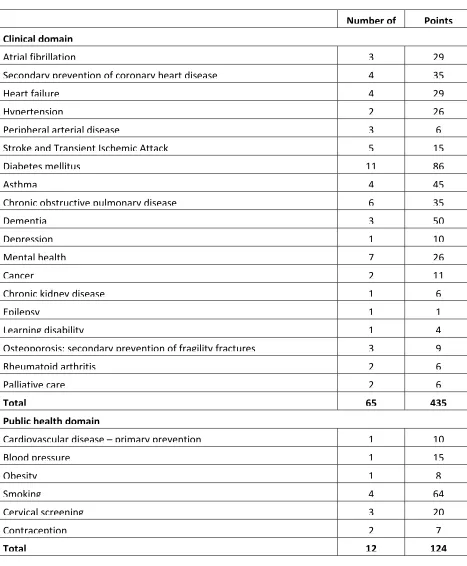
There are two main components to the QOF, known as domains, and each includes a set of indicators designed to measure performance. The two domains cover clinical and public health indicators. Points are awarded to practices on the basis of their levels of achievement against individual indicators. In 2015/16 there were 77 indicators for the two domains, through which practices could score up to 559 points. On average, a QOF point is worth £160.15 to a practice in England during 2015/16.6Table 1 shows the two domains, their associated indicators and the maximum number of points available for the indicators.
[TABLE 1]
cases these activities run across several indicator sets (Table 2). For instance, smoking cessation is linked to ten unique disease areas.
[TABLE 2]
The National Institute for Health and Care Excellence (NICE) convenes the Indicator Advisory Committee, quarterly to:
Prioritize suggestions for new clinical or public health topics and make recommendations for indicator development;
Consider the outcome of piloting, consultation and economic appraisal of potential indicators, and make final recommendations on new indicators;
Review information on the uptake of current indicators in the QOF and recommend whether any should be retired, considered for changes to points and/or thresholds, or be subject to further assessment.
Methods for assessing the cost-effectiveness of QOF indicators
The methods applied to determine the cost-effectiveness of QOF indicators adopt a net (monetised) benefit approach. In summary, the method applies the following calculation to an indicator:
Net benefit = (monetised health benefit – delivery cost) – QOF payment
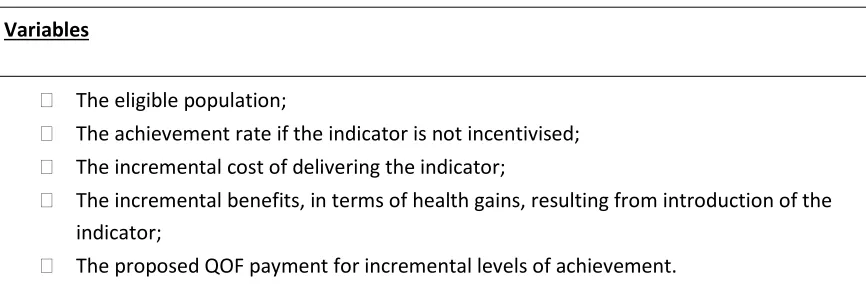
In order to undertake cost-effectiveness analysis for QOF indicators, estimates for a number of variables are required, including details listed in Table 3.
[TABLE 3]
To estimate the net benefit of an indicator, it is necessary to have information on the benefits and costs associated with the indicator. To gather these costs and benefits, a rapid review of the available economic evidence is carried out. The opinions of those involved in delivering the indicators at pilot GP sites are also sought. The costs associated with an indicator include care delivery costs; for example, the costs of additional GP or nurse consultations to monitor a patient’s health status over a period of time, the initial cost of implementing the intervention, and if relevant, secondary care service usage. The unit costs for these activities can be
obtained from sources 11, 12 such as the Personal Social Services Research Unit (PSSRU) and the Payment by Results tariff (PbR). Indicator costs also include unexpected consequences such as an increase in referrals resulting from more intensive monitoring. This may lead to increased health service usage costs in the short-term, as in the case of chronic kidney disease (CKD), where the introduction of estimated glomerular filtration rate (eGFR) as a prognostic indicator led to a 61 per cent increase in new patient referrals in a NHS Trust.13
The benefits refer to health benefits which might be gained by a patient as a result of
For example, in the case of using ambulatory blood pressure monitoring (ABPM) to confirm a diagnosis of hypertension, these can include the avoidance of cardiovascular events in people correctly diagnosed as hypertensive. These benefits are presented in terms of the change in quality adjusted life years (QALYs) as a result of introducing a new indicator compared to standard practice without the new indicator. QALYs are a measurement of health status, using utility measures such as the EQ-5D survey. These measures categorise a person’s health status as usually ranging from a value of one for someone in perfect health to a value of zero
representing death. 14 NICE recommends the use of QALYs as a measure of health benefit to enable a standardised approach for economic evaluations across health areas.15 In making recommendations on cost-effectiveness, NICE values QALYs between £20,000 and £30,000. For evaluating cost-effectiveness of new indicators, the lower QALY value of £20,000 is considered. In addition to the health benefits for patients, the cost-effectiveness analysis also takes into account any cost savings that might be achieved, such as avoided adverse events or avoided hospital admissions.
The QOF payments that are made on reaching particular levels of achievement for the
indicator are also considered in the net benefit analysis. The QOF payment is assumed to be an incentive payment that is additional to the delivery cost. Payments are triggered once
performance for an indicator exceeds the minimum threshold, i.e. the minimum proportion of the eligible population within a GP practice who receive the intervention associated with the indicator. Payments increase linearly until performance reaches the maximum threshold, which is usually around 85% to 90% of the eligible population. For instance, blood pressure management in secondary prevention of coronary heart disease (CHD) is incentivized. The payments for this indicator are triggered once 53 per cent of CHD patients in a general practice have a blood pressure reading of 150/90 mmHg or less in the preceding 12 months. The level of payment increases linearly up to a maximum of 93 per cent of CHD patients with a
Having taken account of the costs and benefits, described above, the output of this process is an estimate of net benefit. This analysis is conducted based on the entire population of England which is assumed to comprise 7,962 practices with a mean practice size of 7,034 patients.17 The findings are presented in the form of a net benefit table. The table shows different combinations of QOF points and levels of achievement (percentages of the eligible population to whom the indicator has been applied) at which the indicator can be considered to be cost-effective. This allows the Committee to consider the number of QOF points (and thus the associated incentive payments) that could be offered before the indicator would stop being cost-effective. Where the net benefit is positive, then the indicator is considered to be cost-effective (the benefits to the National Health Services (NHS) outweigh the costs). For instance, cost-effectiveness analysis for nine indicators for cardiovascular disease and diabetes (BP5, CHD9, CHD10, CHD11, CS1, DM15, DM21, LVD3, Stroke12) implemented in 2004/2005 with direct therapeutic impact were found to have positive net benefits, with mean payments per treated patient, made to general practice, ranging from £0.63 to £40.61.18 In some cases there may be a lack of evidence to support the use of the indicator on economic grounds, but it may be warranted according to other criteria, for example if it is considered by patients, the public and general practices to be valuable. In order to test the robustness of the results, sensitivity analysis is conducted to indicate the extent to which costs would have to rise, or benefits and eligible population would have to fall before the indicator ceased to be cost-effective for specific numbers of points.
Procedure for cost-effectiveness analysis of new indicators: role of the economic subgroup
managers, general practitioners, and patient representatives. This ensures the analysis reflects clinical practice and consumer preferences. Prior to analysis of any new pilot indicators, the indicators to take forward for economic evaluation are agreed with the economic subgroup. The subgroup scrutinises the rationale for evidence and costs to be used in net-benefit
analysis. Evidence of benefits of new indicators is derived from NICE evidence-based guidelines or other robust sources of evidence if NICE guidelines are not available. 19 Once the indicators to evaluate are agreed the health economists performs the economic analysis and presents their findings back to the subgroup for consideration and approval.
Considering the process in more detail, each clinical indicator attracts incentive payments through achievement of specified QOF points. The subgroup advises the health economists about the range of QOF points that should be considered for the economic analysis of each new indicator, for example, between five and 15 points. To determine the appropriate range of points, the QOF point allocation is appraised by the health economists for similar indicators which are already implemented. This helps to promote a reasonably consistent approach within the existing QOF menu. For example, indicators which include confirmation of diagnosis consistently have relatively low levels of QOF points allocated; e.g. COPD002 (The percentage of patients with COPD, diagnosed on or after 1 April 2011, in whom the diagnosis has been confirmed by post bronchodilator spirometry between 3 months before and 12 months after entering on to the register) has a maximum of five QOF points.
New indicators that are amenable to cost-effectiveness analysis are those that:
Lead to a specific treatment or therapy, e.g. cardiac rehabilitation after myocardial infarction;
Are likely to have relevant and robust data available on costs and benefits, e.g. reducing blood pressure in older people with hypertension.
Those indicators which are less likely to be considered for cost-effectiveness analysis are those that:
Are solely process measures, e.g. the creation of a register but with no other action implied;
Are unclear or inconsistent around the impact of the intervention, e.g. indicators that refer to ‘support and advice’;
Are likely to have a lack of availability of high level evidence (e.g. no randomized controlled trials).
These are not specific rules but provide a guide to the usual rationale adopted in deciding whether an indicator can be assessed for its cost-effectiveness. In some cases, the
effectiveness of a clinical indicator may not be clear and in these circumstances economic evaluation can still be performed using an approach called “threshold analysis”. This helps to determine the point at which an indicator becomes cost-effective (i.e. the net benefit is positive). For example, if there is a lack of evidence around the benefits of a specific treatment that could be incentivised through clinical indicators, threshold analysis can be used to
avoided with the intervention. Scenarios were developed to indicate how many points might be justified before the indicator would cease to be cost-effective.
Once economic evidence is collated for the relevant pilot indicators, the information is reported back to the economic sub-group for discussion and agreement. More recently, the economic sub-group has recommended further analysis to assess the extent to which the cost-effectiveness of an indicator exceeds the upper range of agreed QOF points. This allows an assessment of those indicators that are analysed as being very cost-effective, as opposed to simply reporting that the indicator is cost-effective to the upper limit of points originally agreed by the economic subgroup. As there are only a fixed number of QOF points to financially incentivise general practices, it is not feasible for these extra points to be
recommended for adoption. However, the upper limit of points does provide an indication of the extent to which the indicator is cost-effective.
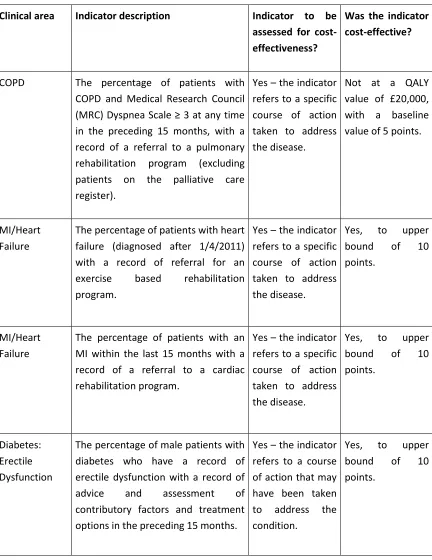
In 2012/13, there were 31 different new indicators proposed for piloting, of which 14 were considered viable for cost-effectiveness analysis. These latter indicators are outlined inTable 4
and twelve were assessed as being cost-effective. Some of the proposed new indicators, particularly those relating to reducing blood pressure, were considered to be cost-effective well above the maximum QOF points agreed by the economic sub-group.
[TABLE 4]
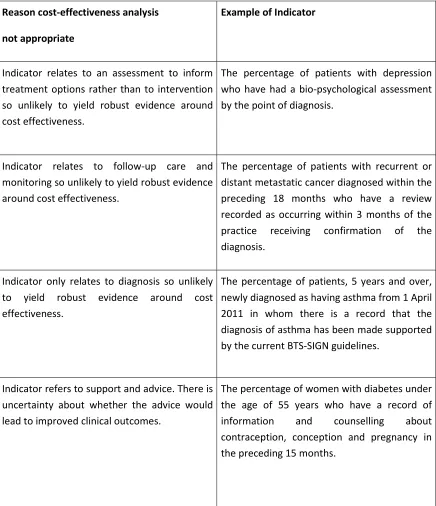
Table 5 summarises reasons why other indicators were not viable to perform economic analysis. This is primarily related to a lack of evidence or the inability to link an indicator to measurable clinical outcomes.
Limitations to the cost-effectiveness assessment method
The net benefit approach lends itself to evaluating the cost-effectiveness of indicators that have a clearly established direct therapeutic effect, ideally from robust trial evidence. That is, those indicators where achievement can be shown to clearly impact on health status or life expectancy, allowing the benefits to be expressed in terms of QALYs. Many of the ‘Ongoing management’ indicators have these characteristics. This approach is less applicable to evaluating ‘Initial diagnosis’ indicators, although this does not mean that such indicators are not actually cost-effective. In the absence of robust trial evidence, these indicators are normally evaluated for their cost-effectiveness by using clearly defined but very conservative modelling assumptions, i.e. using lower range estimates of benefits and higher range estimates for costs. Due to these conservative assumptions, ‘Initial diagnosis’ indicators may not appear as cost-effective as ‘Ongoing management’ indicators.
An example of such an indicator is the (now retired) chronic kidney disease indicator, CKD2 (The percentage of patients on the CKD register whose notes have a record of blood pressure in the preceding 15 months), which was based on the assumption that monitoring can lead to differing levels of therapy resulting in improvement in renal function. However, it could equally be argued that monitoring per se, provides little if any health benefit and the benefits associated with improved control only occur as a result of subsequent treatment. Critically, a clear link needs to be made between process measures and their clinically-relevant outcomes.
It is important to note that NICE does not consider the broader societal perspective in considering costs. Hence, analyses are limited to a health services perspective which, for practical purposes, simplifies the economic evaluation. External costs such as the productivity loss or lost household production are not included in the analyses.
long-term care, such as dementia, will impact the quality of life of both patients and their care-givers and family members. The 2014/15 NICE indicators included two indicators to improve dementia care (NM64, NM65).20 However, cost-effectiveness analysis assessing these indicators did not involve outcomes associated with family members and care-givers. If these outcomes were to be included in the analysis, these dementia indicators may be extremely cost-effective as seen in studies which have assessed outcomes associated with care givers.20
Discussion
This approach to assess the economic viability of new pay-for-performance indicators
represents a pragmatic and effective way of providing the NICE Indicator Advisory Committee with information to inform its decision making and recommendations for new national QOF indicators. The clear presentation of the economic net benefit taking account of both delivery and reimbursement costs, supported by close scrutiny of the clinical evidence and regular expert input, allows the Committee to understand whether the new indicator is likely to be cost-effective in general practice and, more importantly, the extent to which it is cost-effective through application of sensitivity analysis.
ameliorated by pilot testing of new indicators prior to implementation. Further, whilst there has been modest observed improvement in quality of care in the short to medium-term in indicator areas, such as reduction in hospital admissions 23, decrease in short-term mortality 24, and modestly improved quality of care for chronic diseases 25,the long-term impacts on costs, practitioner behaviour, and population health outcomes still need evaluating. Going forward, direct extraction of data on health benefits and baseline target performance from general practices, rather than basing these on trial evidence, would allow the economic subgroup to make more robust and realistic decisions about the effectiveness and cost-effectiveness of specific indicators within the pay-for-performance scheme.
Finally, the recommendations for new QOF pay-for-performance indicators are being developed in a climate of financial restraints. Across England in 2011 to 2013, practices achieved the upper payment thresholds for 87 per cent of all clinical indicators. 26 This level of achievement is greater than policy makers had anticipated. To reduce resource implications, the English Department of Health has increased payment thresholds and is reducing point allocation. 27 As a consequence, although economic analysis may show that an indicator may be cost-effective up to a very high number of QOF points, it is not feasible to recommend those points. However, there may be other opportunities to adopt these indicators:
commissioners at local and regional level are already incentivising certain clinical activities, in some cases using QOF-like pay-for-performance schemes.28 Commissioners may also consider clinical areas, identified as highly cost-effective, appropriate to incentivise locally over and above the national QOF scheme. This may be particularly relevant for indicators that have been shown to be cost-effective up to much higher levels of QOF points than would be feasible to be awarded within the finite and reducing budget in the national QOF scheme.
Acknowledgement
The final version of the document is available at http://hsr.sagepub.com/
References
1. Scott A, Sivey P, Ait Ouakrim D, et al. The effect of financial incentives on the quality of health care provided by primary care physicians. The Cochrane database of systematic reviews 2011; (9): CD008451.
2. Campbell SM, Reeves D, Kontopantelis E, Sibbald B, Roland M. Effects of Pay for Performance on the Quality of Primary Care in England. New England Journal of Medicine 2009; 361(4): 368-78.
3. Campbell S, Reeves D, Kontopantelis E, Middleton E, Sibbald B, Roland M. Quality of Primary Care in England with the Introduction of Pay for Performance. New England Journal of Medicine 2007; 357(2): 181-90.
4. Ashworth M, Medina J, Morgan M. Effect of social deprivation on blood pressure monitoring and control in England: a survey of data from the quality and outcomes framework. BMJ 2008; 337: a2030.
5. Doran T, Fullwood C, Kontopantelis E, Reeves D. Effect of financial incentives on inequalities in the delivery of primary clinical care in England: analysis of clinical activity indicators for the quality and outcomes framework. Lancet 2008; 372(9640): 728-36. 6. Changes to the QOF 2015/16. London, UK: NHS Employers, 2015.
http://www.nhsemployers.org/your-workforce/primary-care-contacts/general-medical-services/quality-and-outcomes-framework/changes-to-qof-2015-16
7. BPLT Trialist Collaboration. Effects of different blood-pressure-lowering regimens on major cardiovascular events: results of prospectively-designed overviews of randomised trials. The Lancet 2003; 362(9395): 1527-35.
8. Critchley JA, Capewell S. Mortality risk reduction associated with smoking cessation in patients with coronary heart disease: A systematic review. JAMA 2003; 290(1): 86-97.
9. Parsons A, Daley A, Begh R, Aveyard P. Influence of smoking cessation after diagnosis of early stage lung cancer on prognosis: systematic review of observational studies with meta-analysis. BMJ 2010; 340: b5569.
10. Lester H, Matharu T, Mohammed MA, Lester D, Foskett-Tharby R. Implementation of pay for performance in primary care: A qualitative study 8 years after introduction. The British Journal of General Practice. 2013;63:e408-e415
12. Phillips LA, Donovan KL, Phillips AO. Renal quality outcomes framework and eGFR: impact on secondary care. QJM : monthly journal of the Association of Physicians 2009; 102(6): 415-23.
13. Brooks R, Rabin R, de Charro F. The measurement and valuation of health status using EQ-5D: A European perspective. Dordrecht, The Netherlands: Kluwer Academic Publishers; 2003.
14. Guide to the Methods of Technology Appraisal. London, UK: The National Institute for Health and Care Excellence, 2008.
15. 2014/15 General Medical Services (GMS) Contract Quality and Outcomes Framework (QOF). London, UK: The NHS Confederation (Employers) Company Ltd, 2014.
16. General practice trends in the UK. London, UK: Health and Social Care Information Centre, 2014.
17. Walker S, Mason AR, Claxton K, et al. Value for money and the Quality and Outcomes Framework in primary care in the UK NHS. The British Journal of General Practice 2010;
60(574): e213-20.
18. Developing indicators for the Commisioning Outcomes Framework (COF) London, UK: National Institute for Health and Care Excellence, 2012.
19. Summary of recommendations for the NICE menu of indicators for the QOF. London, UK: National Institute for Health and Care Excellence, 2013.
20. Graff MJL, Adang EMM, Vernooij-Dassen MJM, et al. Community occupational therapy for older patients with dementia and their care givers: cost effectiveness study. BMJ 2008;
336(7636): 134-8.
21. Fleetcroft R, Parekh-Bhurke S, Howe A, Cookson R, Swift L, Steel N. The UK pay-for-performance programme in primary care: estimation of population mortality reduction. British Journal of General Practice 2010; 60(578): e345-52.
22. Steel N, Bachmann M, Maisey S, et al. Self-reported receipt of care consistent with 32 quality indicators: national population survey of adults aged 50 or more in England. British Medical Journal 2008; 337: a957.
23. Harrison MJ, Dusheiko M, Sutton M, Gravelle H, Doran T, Roland M. Effect of a national primary care pay for performance scheme on emergency hospital admissions for ambulatory care sensitive conditions: Controlled longitudinal study. BMJ. 2014;349
24. McDonald R, Boaden R, Roland M, et al. A qualitative and quantitative evaluation of the Advancing Quality pay-for-performance programme in the NHS North West. Health Services and Delivery Research 2015; 3(23): 1.
25. Gillam SJ, Siriwardena AN, Steel N. Pay-for-performance in the United Kingdom: impact of the quality and outcomes framework: a systematic review. Annals of Family Medicine 2012; 10(5): 461-8.
27. Caley M, Burn S, Marshall T, Rouse A. Increasing the QOF upper payment threshold in general practices in England: impact of implementing government proposals. British Journal of General Practice 2014; 64(618): e54-e9.
28. Hackett J, Glidewell L, West R, Carder P, Doran T, Foy R. 'Just another incentive
Table 1: QOF domains, indicators and points for 2015/16
Number of indicators
Points Clinical domain
Atrial fibrillation 3 29
Secondary prevention of coronary heart disease 4 35
Heart failure 4 29
Hypertension 2 26
Peripheral arterial disease 3 6
Stroke and Transient Ischemic Attack 5 15
Diabetes mellitus 11 86
Asthma 4 45
Chronic obstructive pulmonary disease 6 35
Dementia 3 50
Depression 1 10
Mental health 7 26
Cancer 2 11
Chronic kidney disease 1 6
Epilepsy 1 1
Learning disability 1 4
Osteoporosis: secondary prevention of fragility fractures 3 9
Rheumatoid arthritis 2 6
Palliative care 2 6
Total 65 435
Public health domain
Cardiovascular disease – primary prevention 1 10
Blood pressure 1 15
Obesity 1 8
Smoking 4 64
Cervical screening 3 20
Contraception 2 7
Table 2: Clinical and Public Health QOF indicators with high points allocations (2015/16)
Indicator Points
HYP006: The percentage of patients with hypertension in whom the last blood pressure reading (measured in the preceding 12 months) is 150/90 mmHg or less
20
AST003: The percentage of patients with asthma, on the register, who have had an asthma review in the preceding 12 months that includes an assessment of asthma control using the 3 RCP questions
20
DEM004. The percentage of patients diagnosed with dementia whose care plan has been reviewed in a face-to-face review in the preceding 12 months
39
SMOK002: The percentage of patients with any or any combination of the following conditions: CHD, PAD, stroke or TIA, hypertension, diabetes, COPD, CKD, asthma, schizophrenia, bipolar affective disorder or other psychoses whose notes record smoking status in the preceding 12 months
25
SMOK005: The percentage of patients with any or any combination of the following conditions: CHD, PAD, stroke or TIA, hypertension, diabetes, COPD, CKD, asthma, schizophrenia, bipolar affective disorder or other psychoses who are recorded as current smokers who have a record of an offer of support and treatment within the preceding 12 months
Table 3: Variables required in cost-effectiveness analysis of QOF indicators
Variables
The eligible population;
The achievement rate if the indicator is not incentivised; The incremental cost of delivering the indicator;
The incremental benefits, in terms of health gains, resulting from introduction of the indicator;
Table 4: Cost-effectiveness of new proposed 2012-2013 pilot indicators
Clinical area Indicator description Indicator to be assessed for cost-effectiveness?
Was the indicator cost-effective?
COPD The percentage of patients with COPD and Medical Research Council (MRC) Dyspnea Scale ≥ 3 at any time in the preceding 15 months, with a record of a referral to a pulmonary rehabilitation program (excluding patients on the palliative care register).
Yes – the indicator refers to a specific course of action taken to address the disease.
Not at a QALY value of £20,000, with a baseline value of 5 points.
MI/Heart Failure
The percentage of patients with heart failure (diagnosed after 1/4/2011) with a record of referral for an exercise based rehabilitation program.
Yes – the indicator refers to a specific course of action taken to address the disease.
Yes, to upper bound of 10 points.
MI/Heart Failure
The percentage of patients with an MI within the last 15 months with a record of a referral to a cardiac rehabilitation program.
Yes – the indicator refers to a specific course of action taken to address the disease.
Yes, to upper bound of 10 points.
Diabetes: Erectile Dysfunction
The percentage of male patients with diabetes who have a record of erectile dysfunction with a record of advice and assessment of contributory factors and treatment options in the preceding 15 months.
Yes – the indicator refers to a course of action that may have been taken to address the condition.
Tightly linked measures
The percentage of patients with Type 2 diabetes aged 40 years and over with successful lipid management defined as either:
a) last recorded cholesterol in the preceding 12 months ≤ 4.0mmol/l b) last recorded cholesterol in the preceding 12 months > 4.0mmol/l and commenced on a moderate dose generic statin within 90 days of cholesterol recording
c) last recorded cholesterol in the preceding 12 months > 4.0mmol/l and generic statin dose increased within 90 days of cholesterol recording
d) or, last recorded cholesterol in the preceding 12 months > 4.0mmol/l and cholesterol lowering therapy changed to a different drug within 90 days of cholesterol recording.
Yes – parts b), c) and d) of the indicator refers to therapy so cost effectiveness data is likely to be available.
Yes, to upper bound of 30 points.
Hypertension The percentage of patients under 80 years old with hypertension in whom the last recorded blood pressure (measured in the preceding 9 months) is 140/90 or less.
Yes – the indicator refers to an intermediate outcome for which there is likely to be economic
evidence around relevant
interventions.
Hypertension The percentage of patients aged 80 years and over with hypertension in whom the last recorded blood pressure (measured in the preceding 9 months) is 150/90 or less.
Yes – the indicator refers to an intermediate outcome for which there is likely to be economic
evidence around relevant
interventions.
Yes, to upper bound of 15 points.
Rheumatoid arthritis
The percentage of patients with rheumatoid arthritis aged 30-84 years who have had a cardiovascular risk assessment using a tool adjusted for RA in the preceding 15 months (with appropriate exclusions).
NOTE: currently the only CVD risk assessment tool which adjusts for RA is QRISK2.
Yes – the indicator refers to a risk assessment, upon which treatment and therefore improvement could potentially be based.
Yes, to upper bound of 10 points.
Hypertension The percentage of patients with a new diagnosis of hypertension after 1 April 2012 whose diagnosis was confirmed following ambulatory blood pressure monitoring (ABPM).
Yes – the indicator indicates
confirmation of a diagnosis that should lead to treatment or therapy.
Yes but only 23 points were justified at £20,000 per QALY.
Dementia care The percentage of care givers (of a person with dementia) who have had an assessment of their health and support needs in the preceding 12 months.
Yes – the indicator refers to an assessment which may lead to
support or
treatment being provided.
CHD The percentage of patients under 80 with coronary heart disease in whom the last blood pressure reading (measured in the preceding 15 months) is 140/90 or less.
Yes – the indicator refers to an intermediate outcome for which there is likely to be economic
evidence around relevant
interventions.
Yes, to upper bound of 20 points.
Peripheral Arterial Disease
The percentage of patients 80 and over with peripheral arterial disease in whom the last blood pressure reading (measured in the preceding 15 months) is 150/90 or less.
Yes – the indicator refers to an intermediate outcome for which there is likely to be economic
evidence around relevant
interventions.
Not at a QALY value of £20,000, with a baseline of 5 points.
Peripheral Arterial Disease
The percentage of patients under 80 with a history of PAD whose last recorded blood pressure reading (measured in the preceding 15 months) was 140/90.
Yes – the indicator refers to an intermediate outcome for which there is likely to be economic
evidence around relevant
interventions.
Yes, to upper bound of 10 points.
Stroke The percentage of patients under 80 with a history of stroke or TIA in whom the last blood pressure reading (measured in the preceding 15 months) is 140/90 or less.
Yes – the indicator refers to an intermediate outcome for which there is likely to be economic
evidence around relevant
Table 5: Reasons cost effectiveness of new proposed 2012-2013 pilot indicators not viable
Reason cost-effectiveness analysis
not appropriate
Example of Indicator
Indicator relates to an assessment to inform treatment options rather than to intervention so unlikely to yield robust evidence around cost effectiveness.
The percentage of patients with depression who have had a bio-psychological assessment by the point of diagnosis.
Indicator relates to follow-up care and monitoring so unlikely to yield robust evidence around cost effectiveness.
The percentage of patients with recurrent or distant metastatic cancer diagnosed within the preceding 18 months who have a review recorded as occurring within 3 months of the practice receiving confirmation of the diagnosis.
Indicator only relates to diagnosis so unlikely to yield robust evidence around cost effectiveness.
The percentage of patients, 5 years and over, newly diagnosed as having asthma from 1 April 2011 in whom there is a record that the diagnosis of asthma has been made supported by the current BTS-SIGN guidelines.
Indicator refers to support and advice. There is uncertainty about whether the advice would lead to improved clinical outcomes.