An investigation into the depth and time dependent behavior of UV
cured 3D ink jet printed objects
X. Chen, I.A. Ashcroft, C.J. Tuck,a)Y.F. He, R.J.M. Hague, and R.D. Wildman
Faculty of Engineering, The University of Nottingham, University Park, Nottingham NG7 2RD, UK AU1
AU2
(Received 26 August 2016; accepted 19 December 2016)
An ultra-violet (UV) curable ink jet 3D printed material was characterized by an inversefinite element modeling (IFEM) technique employing a nonlinear viscoelastic–viscoplastic (NVEVP) material constitutive model; this methodology was compared directly with nanoindentation tests. The printed UV cured ink jet material properties were found to be z-depth dependent owing to the sequential layer-by-layer deposition approach. With further post-UV curing, thez-depth dependence was weakened but properties at all depths were influenced by the duration of UV exposure, indicating that none of the materials within the samples had reached full cure during the 3D printing process. Effects due to the proximity of an indentation to the 3D printed material material-sample fixing interface, and the different mounting material, in a test sample were examined by direct 3Dfinite element simulation and shown to be insignificant for experiments performed at a distance greater than 20lm from the interface.
I. INTRODUCTION
Additive manufacturing (AM) or 3D printing is the technology of building three-dimensional objects layer-by-layer using computer-aided designs (CAD).1 It is capable of fabricating complex three-dimensional objects, which cannot be produced using conventional manufacturing techniques. It consists of several classes of processes, including extrusion, powder bed fusion, vat photopolymerization, and importantly, material jetting (MJ), based on ink jet based techniques.1–8 This latter process is significant, since it is one of the most prom-ising routes to AM based multi-material (MFAM) pro-duction. Both extrusion and MJ methods have been used to develop MFAM, with extrusion showing interesting developments in terms of biological material scaffolds in tissue engineering9,10 amongst other applications. The fundamental difference between extrusion and MJ is the mode of delivery, where extrusion is capable of deliver-ing relatively highly loaded or higher molecular weight materials but at lower resolution than MJ. Should MFAM be realized, it will lead to the production of new multi-functional products, including those in the electronics, bio-printing, and pharmaceutical industries. One mode of ink jet printing is reactive ink jet (RIJ). RIJ involves the deposition of one or more liquid raw materials onto the same location, after which a chemical interaction is activated, producing a new material in situ to the manufacturing process.11,12 One common method is to
use materials that are able to crosslink under the appli-cation of ultra-violet (UV) light. Commercial machines are now available where the UV source is in line with the printing head, leading to the creation of material on a layer-by-layer basis. In this regard, there are similarities to stereolithography (SLA), which also relies on UV based solidification mechanisms.13–16This layer-by-layer synthesis approach however, whilst it has advantages in being able to readily access forms not achievable by traditional manufacturing methods, is not well understood, particularly in relation to the distribution of material properties, both temporally and spatially. Recently it has been shown that mechanical testing methods can be combined with finite element (FE) based solid mechan-ical models to create an inverse FE method (IFEM) for characterizing complex material properties.17–22 This method is particularly useful when combined with nano-indentation as the test enables the spatial distribution of properties to be investigated whilst the IFEM enables access to material models not available in the standard forward analysis of nanoindentation data.23–28This tech-nique has been described previously by the authors in the analysis of 3D ink jet based printed objects to identify spatial variation in properties.28 All methods and applications using the IFEM technique require selec-tion of the right material constitutive model since without it, it is not possible to describe the mechanical behavior of the material in question. In Ref. 28, four different material constitutive models were used: linear viscoelastic (VE), nonlinear viscoelastic (NVE), viscoelastic–viscoplastic (VEVP), and nonlinear viscoelastic–viscoplastic (NVEVP). The work showed that the NVEVP material model offers the best approximation for the material used in that study.
1 2 3 4 5 6 7 8 9 10 11 12 13 14 15 16 17 18 19 20 21 22 23 24 25 26 27 28 29 30 31 32 33 34 35 36 37 38 39 40 41 42 43 44 45 46 47 48 49 50 51 52 53 54 55 56 57 58 59 60
Contributing Editor: Paolo Colombo
a)
What was also evident from this work were the strong spatially varying properties in the printed materials and as a consequence, it was proposed that the time and spatial dependence of these materials should be examined.
In this paper, the IFEM based method will be used to investigate the time and spatially varying material properties of a 3D ink jet printed object. The methodology for pre-paring samples and their analysis will be presented first, followed by an analysis of the variation of mechanical properties, both with and without post-curing. Finally an assessment will be made of possible errors that can be introduced into the analysis by the presence offixing agents and property gradients during the experimental testing.
II. EXPERIMENTAL STUDY
A. Samples preparation and nanoindentation
All materials within this work were printed using a Stratasys Objet Connex 260 3-D printer system
AU3 . The ink
used was VeroClear Fullcure 810 (Stratasys Ltd.). This ink is available in the liquid state and then cured to form a solid through exposure to suitable UV light. To prepare samples, the inks were printed into 40 10 5 mm3 rectangular sections; the solid samples were then chopped into small cuboid pieces using a hand saw. Initial polishing was performed on each piece to remove a layer of material on each chopped surface, to avoid the possible detection of mechanical hardening caused by chopping. These small pieces were mounted on Epofix resin, using Epofix hardener as a crosslink agent, at a 15:2 volume ratio in a cylindrical sample mold kept at room temper-ature. The mounted sample was allowed to harden for at least 8 hours which was followed by grinding and polishing, to produce a mountable sample ready for nanoindentation. Figure 1(a) shows an example of one
of these samples. It is a cylinder with both the diameter and height of around 30 mm, containing several VeroClear cuboid solids within the sample. Each surface was clearly marked to ensure the correct orientation was achieved and was observable under the microscope of the indentation machine [Fig. 1(a)].
Nanoindentation tests were conducted on aNanoTest600
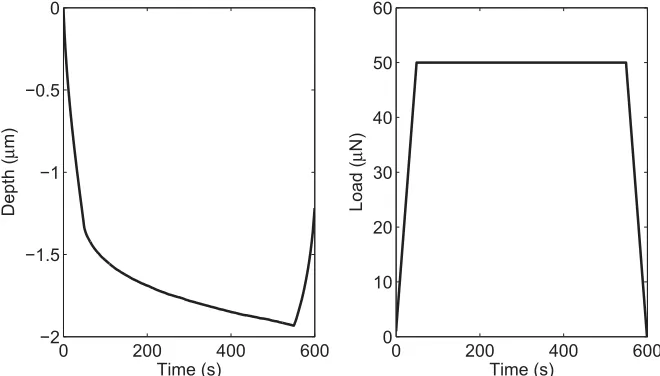
instrument (Micro Materials Limited). The machine is AU5 housed in a polymethyl methacrylate (PMMA) enclosure to separate the instrument from environmental pertur-bations. In our study, the loading pattern was fixed and a typical depth versus time curve was obtained [Figs. 1(c) and 1(d)]. The loading time was set at 50 s, during which the indentation load linearly increased from zero to a maximum, after which the indentation load was maintained for 500 s to allow the material to creep. In the last 50 s, the indentation load was linearly decreased from maximum to zero, resulting in the recovery of elastic deformation. The aim of the IFEM is to extract the optimal local material property param-eters from the depth–time curve under a given load for a specified material constitutive model.
B. Post-curing UV illumination conditions
To investigate any material property changes after production, nanoindentation tests with post-cured samples were also performed. To achieve this, the samples were exposed to a UV light source in a test chamber. A Q-Sun UV oven xenon test chamber was used for this purpose, which allowed the exposure of the sample with UV light at a wave length of 340 nm at a prescribed level of 0.68 W/m2 and temperature of 50 °C. The prepared VeroClear cuboids were exposed to UV light between 2.5 min and 40 h. Control experiments were performed on samples sealed in the aluminum foil. The samples and
1 2 3 4 5 6 7 8 9 10 11 12 13 14 15 16 17 18 19 20 21 22 23 24 25 26 27 28 29 30 31 32 33 34 35 36 37 38 39 40 41 42 43 44 45 46 47 48 49 50 51 52 53 54 55 56 57 58 59
[image:2.585.121.451.525.713.2]their controls were mounted with epofix resin at room temperature to form nanoindentation samples ready for sanding and polishing. When not under testing, samples were stored within an air-conditioned environment, wrapped with dry tissue paper, and covered with the aluminum foil to avoid further UV exposure.
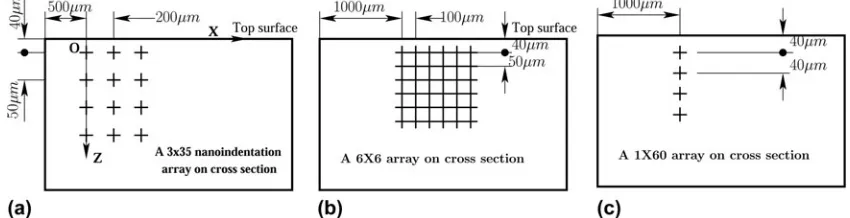
[image:3.585.86.511.503.612.2]Figure 2 shows the schematic experimental protocols used in indentation tests for samples without post-curing [Figs. 2(a) and 2(b)] and for samples with post-curing [Fig. 2(c)]. The maximum indentation load was given by two values,first at 50 mN for the samples with UV post-curing up to and equal to 60 min, and at 75 mN for post-curing greater than 60 min, to allow maximal indentation depth at the same level for all samples, and thus keeping the signal to noise ratio and surface roughness effects at the same level for all samples.
III. RESULTS
A series of experiments were performed to determine the x and z dependence of the material properties and the effect of additional UV curing post-deposition. Table I shows the experiments performed and the relevant properties and conditions.
A. Material property variation following 3D printing
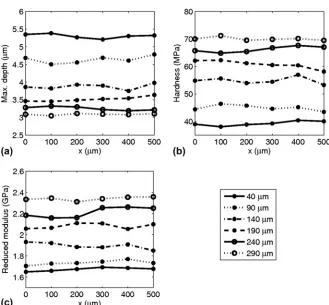
The dependence of material properties on the x- and z-position was first examined by conducting a 6 6 indentation array test on a sample cross section [Fig. 2(b)] mapping along both thexandzdirections. Figure 3 shows the maximum indentation depth, hardness, and reduced modulus for various x locations and z-depths. It can be seen that in the x direction, the properties were broadly
constant but that there is a large variation in all properties as a function of depth. The legend in thefigure shows the distance of indentation location to the top surface of the sample and it can be seen that closer to the top surface, the maximum indentation depth increases and both the hardness and reduced modulus decrease. This indicates that a greater degree of cure has been experienced by the material at a larger depth from the top surface, which is explored in more detail below.
It is hypothesized that the observed z-depth depen-dency in the material properties is closely related to the material manufacturing procedure deployed in the MJ process. This is emphasized by the appearance of clear interfaces between layers as seen in the polished cross section in Fig. 4(a). Figure 4(b) shows the same surface after indentation and it can be seen that there are larger and more defined indents closer to the top surface of the sample, reinforcing the data in Fig. 3 and the observed trend that the layers nearer the top surface are softer. However, the layers are no longer visible after post-curing with UV light. The VeroClear ink was jetted layer-by-layer using the Objet260 Connex system. Themodus operandiof the system is to print material which is then almost immediately exposed to UV light which initiates a crosslinking reaction in the polymer. Since VeroClear has a degree of transparency in the UV region used to initiate the crosslinking reaction, when a subsequent layer of material is printed, the initial layer of the material will be exposed to further UV irradiation albeit to a lesser extent due to absorption of some of the incident light by the second layer. It is thought, however, that this multiple pass of UV light will result in further cross-linking of previous layers resulting in a degree of cross-linking
1 2 3 4 5 6 7 8 9 10 11 12 13 14 15 16 17 18 19 20 21 22 23 24 25 26 27 28 29 30 31 32 33 34 35 36 37 38 39 40 41 42 43 44 45 46 47 48 49 50 51 52 53 54 55 56 57 58 59 60
FIG. 2. Typical schematic protocols applied during nanoindentation. Diagram (a) shows the indentation protocol of a 335 array used to map the
material propertyz-depth dependence, (b) is the protocol for a 66 array of indentations used to check thexindependence of the material property
on a cross section and (c) illustrates the protocol of a 160 test array used to map the material property withz-depth for post-cured samples.
TABLE I. Details of indentation arrays on sample cross sections for experiments performed without and with post-curing.
Nanoindentation array test Relevant properties Test surfaces Figure Indentation Max. load (mN)
335 Identification of viscoelastic properties Cross section Figures 1, 2 and 5 50
66 Assessment ofxdependence Cross section Figures 2 and 3 50
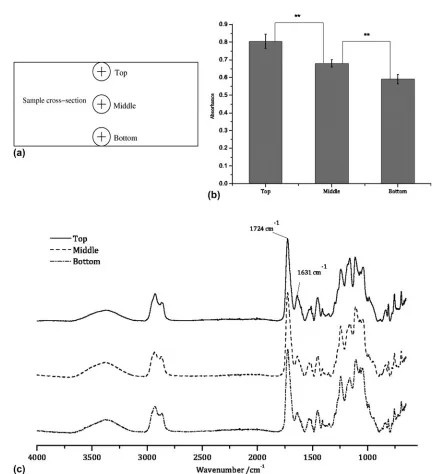
strongly dependent on z. To test this idea of depth dependent cross-linking, an experiment was performed to examine the degree of cross-linking using a Fourier transform near infrared (FTIR) spectrometer (PerkinElmer Inc.). The degree of cross-linking at the top, middle, and bottom locations (0, 0.5, and 3 mm from the top surface, respectively) on a sample cross section was compared using a field of view of ;1 mm2, which although not able to provide the quantitative analysis of the chemistry
with the resolution over which depth changes are likely to occur, will indicate coarse changes in chemistry. Figure 5 shows the absorbance due to C5C bonds at the top, middle, and bottom locations [Fig. 5(a)] on the sample cross section, with the bottom region showing significantly lower absorbance, indicating a greater de-gree of crossl-inking in layers deposited earlier. This behavior can be captured in a simple, discrete model of absorption as follows.
[image:4.585.121.450.76.381.2]1 2 3 4 5 6 7 8 9 10 11 12 13 14 15 16 17 18 19 20 21 22 23 24 25 26 27 28 29 30 31 32 33 34 35 36 37 38 39 40 41 42 43 44 45 46 47 48 49 50 51 52 53 54 55 56 57 58 59 60
FIG. 3. Results of nanoindentation performed on the cross section of a sample in thexdirection. Diagrams (a), (b), and (c) show the achieved maximum
[image:4.585.107.468.428.593.2]depth, hardness, and the corresponding reduced modulus, respectively. The legend shows thez-depth from the top surface for each indentation.
FIG. 4. Surface textures in sample sections prepared for nanoindentation (a) as removed from the 3D printer and sectioned, (b) with residual
The initial concentration of a reactant (such as readily available photo-initiator available for interac-tion with a photon) is c0, and the UV light intensity incident upon the uppermost layer is I0. Following the illumination of the sample with UV light for a duration of Dt, a chemical reaction occurs and a concentration change in the current printing layer will result, giving29
Dc0 ¼ kI0c0Dt ; ð1Þ
where k is a constant of proportionality that relates the change in concentration to the state of the illuminating
light and the material condition, andDc0is the change of concentration due to thefirst illuminating. Therefore, the concentration of reactant,c1, immediately after the first pass, in layer 1, is given by
c1 ¼c0þDc0¼c0ð1kI0DtÞ : ð2Þ
When another layer is deposited onto the already printedfirst layer, the UV light intensity incident on the first printed layer (now the bottom layer) is I1 5 aI0 where a # 1 as a result of absorption of the material when passing through the current printing layer, leading to a change in the concentration of
1 2 3 4 5 6 7 8 9 10 11 12 13 14 15 16 17 18 19 20 21 22 23 24 25 26 27 28 29 30 31 32 33 34 35 36 37 38 39 40 41 42 43 44 45 46 47 48 49 50 51 52 53 54 55 56 57 58 59 60
FIG. 5. (a) Measurement locations on a sample cross section. (b) Comparison of absorbance of C5C bond at 1631 cm1and different locations
[image:5.585.77.511.70.544.2]Dc1 ¼ kI1c1Dt ; ð3Þ
so that when the second deposition is finished, the concentration in thefirst printed layer becomes
c2 ¼c0 1kI0a0Dt
1kI0a1Dt
ð4Þ
where the superscripts reflect the changing conditions of each layer, leading to possible variation in absorption
1 2 3 4 5 6 7 8 9 10 11 12 13 14 15 16 17 18 19 20 21 22 23 24 25 26 27 28 29 30 31 32 33 34 35 36 37 38 39 40 41 42 43 44 45 46 47 48 49 50 51 52 53 54 55 56 57 58 59 60
[image:6.585.118.452.152.311.2]FIG. 6. (a) The maximum depth achieved with 50 mN indentation load, and the indentations and locations that will be used in IFEM, marked by crosses. (b) and depth versus time curves used in IFEM. The curves correspond to the crosses in (a).
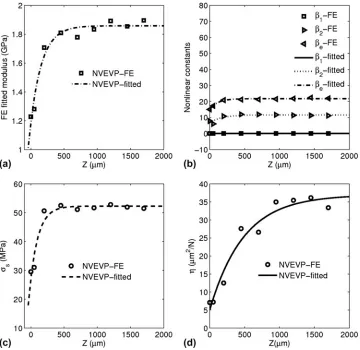
FIG. 7. Typical material parameters of RIJ printed VeroClear achieved by IFEM: (a) Instantaneous modulus as a function ofz, determined using
the NVEVP material constitutive models, (b) nonlinear coefficients obtained byfitting the NVEVP model and subsequently Eq. (6), (c) initial yield
[image:6.585.108.468.356.706.2]coefficients. Generally, when the nth layer printing is finished, the resultant concentration of the first printed layer is
cn¼c0 1kI0a0Dt
1kI0a1Dt
. . .1kI0an1Dt :
ð5Þ
In this work, it is assumed that the material interacts only weakly with the incident radiation, allowing us to simplify to one value ofafor all layers of the material. Plotting Eq. (5) and comparing it with an exponentially decaying function showed good agreement, allowing further simplification and parameterization of the behavior with phenomenological constants. Mechanical properties are known to be linked to the degree of completion of the cross-linking process,30thus it is reasonable to characterize these using a similar form of equation. Therefore, it is assumed that all properties will show a depth dependency of the form
R¼R0 1exp Z Z0
þR1 ð6Þ
whereR is a material parameter, andR0, z0, and R1 are material constants. These were determined by non-linear regression, as discussed in Sec. III B.
B. IFEM derived properties of 3D printed material
Since thexaxis dependence of material properties has been shown to be insignificant, and there are clear
[image:7.585.55.549.71.403.2]1 2 3 4 5 6 7 8 9 10 11 12 13 14 15 16 17 18 19 20 21 22 23 24 25 26 27 28 29 30 31 32 33 34 35 36 37 38 39 40 41 42 43 44 45 46 47 48 49 50 51 52 53 54 55 56 57 58 59 60
FIG. 8. Typical viscoelastic relaxation parameters for the reactive ink-jetted VeroClear material extracted via a NVEVP constitutive model based IFEM method. Diagrams (a), (b), and (c) show the variation of relative relaxation moduli as a function ofzand (d), (e), and (f) show thezdependency
of the corresponding relaxation times. The curves represent the bestfit of Eq. (6) to the spatially varying IFEM determined material properties.
TABLE II. Range of phenomenologicalz-dependent material
param-eters determined by bestfitting of Eq. (6) to the spatially varying IFEM determined material properties.
Model type Parameters R0 R1 Z0(lm)
NVEVP
E0(GPa) 0.6707 1.1878 172.7588
g1 0.09214 0.2765 113.4839
g2 0.1840 0.4300 231.6405
g3 0.0229 0.1793 126.6954
s1(s) 0.2159 0.2793 173.6662
s2(s) 79.0869 223.1458 125.1153
s3(s) 14.4538 34.4622 103.0051
b1 . . . 0.0000 . . .
b2 4.9683 6.6618 171.0384
be 6.7901 14.9613 113.6560
rs(MPa) 24.9974 27.2857 125.7688
[image:7.585.307.547.489.634.2]dependencies in the z direction, from hereon the x
dependence is neglected and all properties will be assumed to be z dependent only. To more fully map the z-depth dependence of material properties, inden-tations were conducted on the cross section of a sample with an array of 35 indentations in the z direction to investigate the depth dependence and 3 in the
x-directions for averaging [see Figs. 1(b) and 2(a)]. The distance between adjacent rows was 50 lm, the separation between columns was 200 lm, and the distance from the first column to the closest side surface of the sample was 500 lm. The distance from thefirst indentation to the top surface for each column was around 40 lm. The schematic of the indentation protocol is given in Fig. 2(a). The decrease in the maximum depth of the indentations with respect to depth below the top surface from this array is shown in Fig. 6(a).
In Ref. 28, a number of constitutive models were explored for possible descriptions of a VeroClear 810 ink jet printed material. In this work, we selected a NVEVP based model, which was shown to perform as well or better than other choices. Using the IFEM technique developed in Ref. 28, the spatially varying constitutive properties of VeroClear 810 were deter-mined. This method has benefits over those using direct nanoindentation parameters, since the parame-ters are intrinsic and can be utilized in any future predictive model based on the same constitutive relationships. Figure 6(b) shows the indentation depth–time curves at selected z-depths [indicated by the crosses in Fig. 6(a)] that were used to determine the material parameters using the IFEM described in Ref. 28.
The basis of the NVEVP model is a VE model, where the viscous stress tensorr0iðtÞrelated togiis computed from
[image:8.585.76.501.327.704.2]1 2 3 4 5 6 7 8 9 10 11 12 13 14 15 16 17 18 19 20 21 22 23 24 25 26 27 28 29 30 31 32 33 34 35 36 37 38 39 40 41 42 43 44 45 46 47 48 49 50 51 52 53 54 55 56 57 58 59 60
FIG. 9. Indentation test results for samples with increasing duration of UV exposure. (a) shows the maximum indentation depths for given loads
(50 mN for aging#60 min & 75 mN for aging.60 min), (b) shows the variation of hardness, and (c) shows the variation of the reduced modulus
r0
ið Þ ¼t giG0
Z t
0
exp ts s i
_
e0ds ; ð7Þ
wheretis time,giis the relative relaxation modulus and correspondingly, si is the relaxation time, G0 is the instantaneous modulus, ande9is deviatoric strain tensors. If it is assumed that the strain rate does not change significantly (such as in the case of a nanoindentation test), then Eq. (7) can be simplified to
r0
ið Þ t giG0e_0
Z t
0
exp ts s i
ds
¼giG0e_0si 1exp
t
si
: ð8Þ
It can be seen from Eq. (8) that the product ofgiandsi approximately determines the amplitude of the viscous stress tensorr0ið Þt whilesishows the effective time range of the change ofr0ið Þt is approximately from 0 tosi; after
[image:9.585.51.294.82.272.2]1 2 3 4 5 6 7 8 9 10 11 12 13 14 15 16 17 18 19 20 21 22 23 24 25 26 27 28 29 30 31 32 33 34 35 36 37 38 39 40 41 42 43 44 45 46 47 48 49 50 51 52 53 54 55 56 57 58 59 60
FIG. 10. Average of indentation depth–time curve with errorbar
for a sample with 20 h post-curing and 75 mN indentation load, which is used as a reference data set in IFEM for the post-cured sample, where the insert shows the typical error in the curve. (color online)
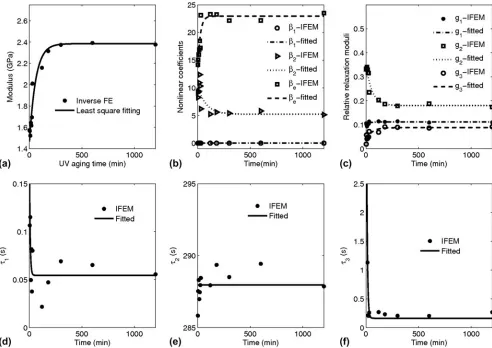
FIG. 11. (a) Instantaneous modulus of VeroClear with further UV curing, evaluated by IFEM with the NVEVP material constitutive model,31
[image:9.585.53.545.357.705.2]t.si,r0ið Þt is nearly constant. Thus it can be said that the greater the product of gi andsiis, the more viscous the material is; the higher si is, the longer the change of viscous stress remains. In Ref. 28, this basic model was expanded to include non-linear termsb1,b2, andb3, and viscoplastic terms that represent the yield stress rh and the strain rate sensitivity parameter, g. Readers are referred to Ref. 28 for more detail on these relations.
The depth dependent modulus determined by NVEVP based IFEM is shown in Fig. 7(a), in which the reference data were obtained from indentation tests with a 50 mN maximum load. The relative relaxation moduli change and relaxation times overzare shown in Fig. 8, but it is seen that the relaxation times do not change significantly with z [Fig. 8(d)–8(f)]. The variation of the material property is, in this case, mainly represented by the change of instantaneous modulus and relative relaxation moduli, such as g2 and g3. Figure 8 illustrates that generally, exposure to UV radiation reduces the viscous component of stress [see Eq. (8)].
The material property parameters are fitted with the exponential function given by Eq. (6), by nonlinear regression, and are shown by curves in Figs. 6 and 7. The obtained material parameter results are shown in Table II.
C. Material property evaluation of samples with post-deposition curing
A preliminary experiment to observe the change that may arise with further UV exposure showed that the layer interfaces were no longer visible [Fig. 4(c)]. This suggests that post-curing can lead to the integration of the layers of material, most likely due to cross-linking between layers, creating covalent links, and homoge-nizing the material. In addition, it demonstrates that further curing over the whole depth of the material may occur, not just at the relatively low modulus upper surface.
Samples with additional UV curing time were indented with a 1 60 indent map [Fig. 2(c)]. The indentation array was located 1000lm from its nearest side surface for each test. The distance of thefirst indentation to the top surface was around 40 lm, and the separation of the two indentations next to each other was 40lm.
[image:10.585.40.274.373.717.2] [image:10.585.37.277.378.518.2] [image:10.585.295.537.594.712.2]Figure 9 shows the experimentally determined material dependent parameters as a function of the time of exposure. It can be seen that as the duration of exposure lengthens, the modulus and hardness increase and corre-spondingly, the maximum depth of penetration for a given load decreases. This trend is observed for allz-positions. What is also observed is that, although thez-depth depen-dence is greatly reduced, even at large z-values the modulus and hardness increase, suggesting that curing during manufacture is not close to completion with respect to fully saturated cross-linking. This correlates with the observation that the interfaces at all depths are eliminated with further UV exposure on the cross section [Fig. 4(c)] and that the C5C absorption does not go to zero even at the bottom of the sample (Fig. 5).
1 2 3 4 5 6 7 8 9 10 11 12 13 14 15 16 17 18 19 20 21 22 23 24 25 26 27 28 29 30 31 32 33 34 35 36 37 38 39 40 41 42 43 44 45 46 47 48 49 50 51 52 53 54 55 56 57 58 59
60 FIG. 12. The change in initial yield stress,parameter,g, with post-curing time. rs, and viscoplastic
FIG. 13. Schematic diagram showing the process for determining the material properties under various conditions.
TABLE III. Phenomenological constants reflecting the variation in
material properties with aging, determined byfitting Eq. (9) to IFEM
derived average parameters.
Material model Parameters R0 R1 t0(min)
NVEVP
E0(GPa) 0.9491 1.4362 59.6447
s1(s) 0.1617 0.2162 6.5516
s2(s) . . . 288.5935 ∞
s3(s) 7.9148 8.0771 7.4110
g1 0.01268 0.09919 31.1499
g2 0.1756 0.3554 55.5907
g3 0.05472 0.03321 53.0578
b1 . . . .
b2 5.0620 10.2890 78.9823
be 10.1198 12.8243 23.6829
rs(MPa) 38.2023 40.7710 171.4188
Two loads were used for the indentations (Sec. II. B), 50 mN and 75 mN for aging durations of ,60 min and
.60 min, respectively. One consequence of this differ-ence is that an accurate comparison of aging at short and long times in the context of indentation parameters is not reliable, since there are often load dependent effects that arise.31
Further, the nanoindentation depth versus time curves over the range of z explored were averaged to obtain mean values of the IFEM derived material parameters (Fig. 10). These average parameters were then plotted as a function of the aging time to observe the dependence on the UV exposure duration. In a pattern similar to that
observed in Fig. 8, the material properties tend to vary with aging time, plateauing toward an asymptotic behav-ior as the duration becomes long (Fig. 11).
Illumination in the UV chamber raises the temperature to 50 °C. To see the effect of this temperature change, control samples were produced, wrapped in the alumi-num foil, and placed in the UV test chamber alongside samples open to the UV light. No significant variation with duration of exposure to the heat in the chamber was found (figure not shown).
To better understand the observed time dependence of material properties, a phenomenological description of thez-averaged behavior was adopted. Since the probability
[image:11.585.50.545.266.694.2]1 2 3 4 5 6 7 8 9 10 11 12 13 14 15 16 17 18 19 20 21 22 23 24 25 26 27 28 29 30 31 32 33 34 35 36 37 38 39 40 41 42 43 44 45 46 47 48 49 50 51 52 53 54 55 56 57 58 59 60
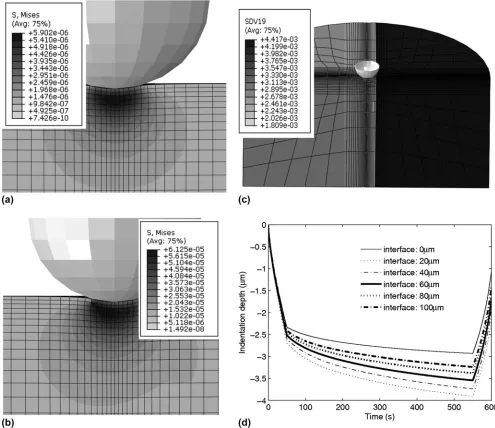
FIG. 14. Diagram (a) shows the von Mizes stress distribution of an indentation with material interface 100lm away from the indentation center,
(b) illustrates the von Mizes stress distribution with material gradient and material interface 40 lm away from the indentation center, (c)
demonstrates the corresponding distribution of instantaneous modulus, and (d) displays the depth versus time curve obtained by artificial tests for
of absorption per photo-initiator molecule is likely to be constant at the surface, it is reasonable to expect an exponential variation in availability of absorbers over time, and a consequent exponential change in material properties, such that
R¼R0 1exp t t0
þR1 ; ð9Þ
where R is a material parameter determined by IFEM, R0, R1, andt0 are regression constants, where t0 is a parameter that represents the time it takes for a parameter to decay by e. This enables the material parameter variation to be simply characterized with time through t0. The fitted parameters are shown in Table III. Reflecting the increase in modulus with time, Fig. 11(a) shows that the instantaneous modulus determined by IFEM increases with duration of aging. The nonlinear coefficients (b1, b2, and be28) also respond to the additional UV illumination, indicating a change in the degree of non-linearity with curing.
The changes in the viscous part of the material behavior can be observed from the relaxation moduli and their
corresponding relaxation times. The relaxation time s2 associated with g2 is two orders of magnitude greater thans1ands3, suggesting thatg1andg3can be neglected in comparison tog2 (Fig. 11). The reduction in g2 with curing time indicates a tendency for the material to become less viscous with aging, and less susceptible to processes such as creep. The viscoplastic behavior of the material also varies with aging, with the yielding stress increasing with curing time (Fig. 12). Once again, this indicates a loss of plasticity with aging. However, the increase in viscoplastic parameter g (Fig. 12) also suggests that the material becomes more elastoplastic with curing.
D. Effects of material interfaces and material property gradients
One aspect that must be resolved before being able to attribute the near surface variation in observed properties to changes in the material behavior is an evaluation of whether performing tests near to the interface between the high modulus Epofix support resin and the VeroClear 810 resin, in addition to the presence of material property
[image:12.585.106.466.382.703.2]1 2 3 4 5 6 7 8 9 10 11 12 13 14 15 16 17 18 19 20 21 22 23 24 25 26 27 28 29 30 31 32 33 34 35 36 37 38 39 40 41 42 43 44 45 46 47 48 49 50 51 52 53 54 55 56 57 58 59 60
FIG. 15. The typical material property difference and error between the given value and the value evaluated by IFEM, by using the artificial test
strategy, where (a) shows the instantaneous modulus difference, (b) demonstrates the variation of relative relaxation modulus ofg1, (c) illustrates
gradients, may skew the observed results. To address this question, a limited number of fully 3D numerical experi-ments were performed, which enabled an interface and gradients to be specified. This approach is vastly more computationally intensive than the axisymmetric domain and was only used to determine the degree of bias owing to interfacial and gradient effects.
The 3D model was used to create an “experimental” result with materials of known properties. The test for the IFEM approach was then to use this load-depth information provided by the 3D model and to determine the variance in the determined material properties, the general methodology being shown in Fig. 13. A 3D material subroutine with a linear VE constitutive model was developed using material properties obtained from IFEM. The step change in material properties was implemented in the 3D FE model via a user developed 3D UMAT subroutine [Fig. 14(c)]. The similarity of the 3D result to an axisymmetric model is illustrated by Fig. 14, where as can be seen from Fig. 14(a), when the indentation center is 100lm away from the interface, the stress distribution is almost axisymmetric and when the indentation center is 40lm away from the interface, the stress distribution is slightly away from axisymmetric distribution [Fig. 14(b)]. Although the material property gradient, material interface, and a step change in property at the interface are involved in the model, the output of FE modeling is still close to be axisymmetric, depending on the distance of indentation location to the material interface.
Figure 15 shows the percentage variation in key material properties as the numerical indentation experi-ment is moved toward the interface. For example, a distance of 0 lm would reflect a 3D FE model of an indentation exactly on the interface between the two materials, from which the axisymmetric IFEM based model would extract material data (which assumes a homogenous VeroClear 810 material distribution). It can be seen that there is a 5–10% error at 20 lm from the interface, beyond which the error increases as the interface is approached. This suggests that at distances greater than;20lm, errors below 5% can be expected, and such discrepancies are significantly below the experimental variations observed near to the surface. Therefore the assumptions on which the IFEM model is based (axisymmetry, small gradients within) can be considered safe, and the influence of the stiffer material can be considered negligible for distances greater than 20lm from the interface. Noting that this is only correct for these materials and test conditions.
IV. CONCLUSIONS
A 3D ink jet printed part was examined for spatial and temporal variations, with material parameters derived by
using IFEM in combination with indentation, and then fitting phenomenological relations to obtain parametric dependencies. This showed a clear z dependence. This z dependence was reduced by further exposure to UV light, which acts to homogenize the material and eliminate the strong gradients in the material properties. The IFEM derived parameters and the phenomenological relations that empirically describe the variation inzand with aging, can be used to predict intra-part properties and how the behavior will evolve with exposure to aging conditions.
ACKNOWLEDGMENTS
The authors would like to acknowledge the support of University of Nottingham and of the Engineering and Physical Research Council for funding under grant EP/I033335/2, the EPSRC Center for Innovative Manufacturing in Additive Manufacturing.
REFERENCES
1. J-P. Kruth, M.C. Leu, and T. Nakagawa: Progress in additive
manufacturing and rapid prototyping. CIRP Ann. 47, 525–540
(1998).
2. I. Gibson, D. Rosen, and B. Stucker: Additive Manufacturing
Technologies 3D Printing, Rapid Prototyping, and Direct Digital Manufacturing(Springer, New York, 2010); pp. 63–203. 3. L.P. Hue: Progress and trends in ink-jet printing technology.
J. Imaging Sci. Technol.42(1), 49–62 (1998).
4. S. Vafaei, C. Tuck, R. Wildman, and I. Ashcroft: Spreading of the
nanofluid triple line in ink jet printed electronics tracks. Addit.
Manuf.11, 77–84 (2016).
5. D.H. Gunasekera, S. Kuek, D. Hasanai, Y. He, C. Tuck, A.K. Croft, and R.D. Wildman: Three dimensional ink-jet printing
of biomaterials using ionic liquids and co-solvents. Faraday
Discuss.(2016). doi: 10.1039/c5fd00219b. AU6
6. Y. He, C.J. Tuck, E. Prina, S. Kilsby, S.D.R. Christie, S. Edmondson, R.J.M. Hague, F.R.A. Rose, and R.D. Wildman: A new photocrosslinkable polycaprolactone-based ink for
three-dimensional inkjet printing. J. Biomed. Mater. Res., Part B
00B(00), 1–13 (2016). AU7
7. F. Zhang, C. Tuck, R. Hague, Y. He, E. Saleh, Y. Li, C. Sturgess, and R. Wildman: Inkjet printing of polyimide insulators for the 3D printing of dielectric materials for microelectronic applications.
J. Appl. Polym. Sci.133, 43361(1-11) (2016).
8. Y. He, R.D. Wildman, C.J. Tuck, S.D.R. Christie, and S. Edmonson: An investigation of the behavior of solvent based
polycaprolactone ink for material jetting.Sci. Rep.(2016). http://
eprints.nottingham.ac.uk/id/eprint/31244. AU8
9. M. Domingos, F. Intranuovo, T. Russo, R. De Santis, A. Gloria,
L. Ambrosio, J. Ciurana, and P. Bartolo: The first systematic
analysis of 3D rapid prototyped poly(e-caprolactone) scaffolds
manufactured through BioCell printing: The effect of pore size and
geometry on compressive mechanical behaviour and in vitro
hMSC viability.Biofabrication5(4), 045004(13 pp) (2013).
10. T. Patrício, M. Domingos, A. Gloria, U. D’Amora, J.F. Coelho,
and P.J. Bártolo: Fabrication and characterisation of PCL and
PCL/PLA scaffolds for tissue engineering.Rapid Prototyping J.
20(2), 145–156 (2014).
11. L.R. Hart, S. Li, C. Sturgess, R. Wildman, J.R. Jones, and W. Hayes: 3D printing of biocompatible supramolecular polymers
and their composites.ACS Appl. Mater. Interfaces8, 3115–3122 (2016).
12. S. Fathi and P.M. Dickens: Challenges in drop-on-drop deposition
of reactive molten nylon materials for additive manufacturing.J.
Mater. Process. Technol.213, 84–93 (2013).
13. R.B. Kulkarni and C.R. Manners: Stereolithographic process of making a three-dimensional object, US6558606 B1, May 6, 2003. 14. M.P. Lee, G.J.T. Cooper, T. Hinkley, G.M. Gibson, M.J. Padgett, and L. Cronin: Development of a 3D printer using scanning
projection stereolithography. Sci. Rep. 5, 9875. doi: 10.1038/
srep09875.
AU9
15. M.N. Cooke, J.P. Fisher, D. Dean, C. Rimnac, and A.G. Mikos: Use of stereolithography to manufacture critical-sized 3D
bio-degradable scaffolds for bone ingrowth.J. Biomed. Mater. Res.,
Part B64, 65–69 (2003).
16. P.W. Melchels, J. Feijen, and D.W. Grijpm: A review on
stereo-lithography and its applications in biomedical engineering.
Bio-materials31, 6121–6130 (2010).
17. M. Dao, N. Chollacoop, K.J. Van Vliet, T.A. Venkatesh, and S. Suresh: Computational modeling of the forward and reverse
problems in instrumented sharp indentation. Acta Mater. 49,
3899–3918 (2001).
18. J. Lin, X.Y. Niu, and X.F. Shu: Reverse analysis for determining
the mechanical properties of zeolite ferrierite crystal. J.
Nano-mater., Article ID 395738, 7 pages (2008).
AU10
19. C. Hernandez, A. Maranon, I.A. Ashcroft, and J.P. Cases-Rodriguez: An inverse problem for the characterization of dynamic material
model parameters from a single SHPB test. Procedia Eng. 10,
1603–1608 (2011).
20. G. Rauchs and J. Bardon: Identification of elasto-viscoplastic
material parameters by indentation testing and combined finite
element modeling and numerical optimization.Finite Elem. Anal.
Des.47, 653–667 (2011).
21. C. Hernandez, A. Maranon, I.A. Ashcroft, and J.P. Casas-Rodriguez: A computational determination of the Cowper-Symonds
param-eters from a single Taylor test. Appl. Math. Model. 37,
4698–4708 (2013).
22. M. Hamzah, D. Subit, S. Boruah, J. Forman, J. Crandall, D. Ito,
S. Ejima, K. Kamiji, and T. Yasuki: An inverse finite element
approach for estimating the fiber orientations in intercostal
muscles. Presented at theIRCOBI Conference 2013, IRC-13-88,
pp. 722–733. AU11
23. C.A. Clifford and M.P. Seah: Modeling of nanomechanical nano-indentation measurements using an AFM or nanoindenter for
compliant layers on stiffer substrates.Nanotechnology17, 5283–
5292 (2006).
24. A. Gerday, N. Clement, P. Jacques, T. Pardoen, A. Habaken, and G.K. Nihon: Inverse modeling of nanoindentation tests to identify
Ti-555 behavior. Presented at theWorld Conference on Titanium;
Ti-2007 Science and Technology; JIMIC5, 507–510.
25. J. Wang and T.C. Ovaer: Computational mechanical property determination of viscoelastic/plastic materials from
nanoindenta-tion creep test data.J. Mater. Res.24, 1245–1257 (2009).
26. P. Zlamal, O. Jirousek, D. Kytyr, and T. Doktor: Indirect de-termination of material model parameters for single trabecula based on nanoindentation and three-point bending test. Presented
at the 18th International Conference, Engineering Mechanics,
Svratka, Czech Republic, 2012, pp. 394–395.
27. M.H. Abyaneh, R.D. Wildman, I.A. Ashcroft, and P.D. Ruiz:
A hybrid approach to determining cornea mechanical propertiesin
vivo, using a combination of nano-indentation and inversefinite
element analysis.J. Mech. Behav. Biomed. Mater. 27, 239–248
(2013).
28. X. Chen, I. Ashcroft, R. Wildman, and C. Tuck: An inverse
analysis method for the depth profiling and characterisation of 3D
printed objects.Proc. R. Soc. A471, 20150477 (2015).
29. J.R. Sheats, J.J. Diamond, and J.M. Smitht: Photochemistry
in strongly absorbing media. J. Phys. Chem.92, 4922–4938
(1988).
30. Y. Liu and M.B. Huglin: Effective crosslinking densities and
elastic moduli of some physically crosslinked hydrogels.Polymer
36, 1715–1718 (1995).
31. Y.V. Milman,А.А. Golubenko, and S.N. Dub: Indentation size
effect in nanohardness.Acta Mater.59, 7480–7487 (2011).
1 Please check whether the corresponding author details are presented correctly. 2 Please provide full given name for all the authors.
3 Please provide the manufacturer details (company name, city/state if produced in the US or city/country name if produced outside US) for‘Stratasys Objet Connex 260 3-D Printer; Q-Sun UV Oven Xenon Test Chamber’. 4 Please note that the part captions‘a–d’are given in the text but not mentioned in the artwork of Figure‘1’. Please
provide an updated artwork or confirm that this part of the captions should be deleted.
5 Please provide the manufacturer details (city/state if produced in the US or city/country name if produced outside US) for‘NanoTest600, Fourier Transform Near InfraRed (FTIR) Spectrometer’.
6 Please update reference‘5’.
7 Please check the volume number for reference‘6’.
8 Please provide the volume number and page number for reference‘8’. 9 Please provide the year of publication for reference‘14’.
10 Please check and update reference‘18’.
11 Please check the edits made to the references ‘22 and 24’.