The effect of temperature upon acid–base status in ectotherms has been intensively studied, beginning with the pioneering work on alligators by Austin et al. (1927). The consistent and by now familiar picture that has developed is that pH rises when body temperature falls, although the slope of this relationship (DpH/DT) varies considerably among species, over different temperature intervals within a species, and even among tissues within individual animals (Heisler, 1986). Much of the early work was carried out on the blood of reptilian and amphibian species in which it was shown that DpH/DT≈0.017 pH units °C21 and that arterial P
CO∑ (PaCO∑)
decreased with decreasing temperature over a wide temperature range. Robin (1962), Robin et al. (1969) and Reeves (1972) were impressed by the similarity between these in vivo adjustments and the acid–base response of an in vitro sealed (constant CO2content) sample of blood equilibrated at
different temperatures (Rosenthal, 1948). They concluded that, just as in the Rosenthal system, the thermally induced acid–base adjustments in air-breathing ectotherms were the result of passive physico-chemical changes in the equilibrium
constants of the principal buffers and the CO2 solubility
coefficient. This concept is embodied in Reeves’ general theory of acid–base balance, termed the alphastat hypothesis (Reeves, 1972).
Animals are, of course, open systems with respect to CO2, and
so it was recognized that physiological control of ventilation was needed to preserve the PCO∑that was automatically produced by
the passive physical effects of a temperature change upon the chemical equilibria of the blood buffers. More specifically, air-breathing ectotherms must increase ventilation relative to metabolism, i.e. they must increase the air convection requirement (V˙air/V˙O∑, V˙air/V˙CO∑) as temperature decreases. This
relative hyperventilation acts to hold the appropriate PaCO∑at its
physico-chemically determined value; i.e. the change in air convection requirement does not produce a new PaCO∑but rather
it simply preserves the PaCO∑ produced by the shifts in the
chemical equilibria. The first study to report an increase in air convection requirement at reduced temperature in air-breathing ectotherms was the seminal work by Jackson (1971) on freshwater turtles Pseudemys (=Trachemys) scripta elegans. His
Printed in Great Britain © The Company of Biologists Limited 1996 JEB9988
There is increasing evidence that many amphibian and reptilian species use relatively slow ion-exchange mechanisms in addition to ventilation to adjust pH as body temperature changes. Large changes in blood bicarbonate concentration with changes in temperature have previously been reported for the snake Coluber constrictor. The purpose of the present study was to determine the ventilatory and pH adjustments associated with the increase in CO2stores when the snakes are cooled. Body
temperature was lowered from 30 to 10 °C within 4 h, at which time measurements of inspired minute ventilation (V˙air), O2consumption (V˙O∑) and CO2 production (V˙CO∑)
were started and continued for 56 h. The decrease in temperature produced a transient fall in the respiratory exchange ratio (V˙CO∑/V˙O∑) to 0.2–0.3 and a steady-state
value of 0.65±0.14 (mean ±S.D., N=7) was not achieved until about 35 h. There were concomitant transient reductions in
V˙air and V˙air/V˙O∑. However, V˙air/V˙CO∑ initially increased,
with a corresponding reduction in arterial PCO∑ (PaCO∑)
and increase in arterial pH. By 35 h, V˙air/V˙CO∑ had
decreased and PaCO∑ had increased to steady-state levels,
but pH decreased very little because of a gradual increase in bicarbonate concentration. We conclude that the drop in temperature imposed a metabolic acidosis for approximately 35 h because of the time required to increase bicarbonate concentration, and that the acidosis was compensated for by an elevated V˙air/V˙CO∑. Steady-state
breathing and acid–base status were not achieved until the relatively slow increase in CO2stores had been completed.
Key words: snake, Coluber constrictor, reptile, temperature, air convection requirement, ventilation, respiratory exchange ratio, oxygen consumption, carbon dioxide production, acid–base balance, pH, lactate.
Summary
VENTILATORY AND BLOOD ACID–BASE ADJUSTMENTS TO A DECREASE IN
BODY TEMPERATURE FROM 30 TO 10 °C IN BLACK RACER SNAKES
COLUBER CONSTRICTOR
J. N. STINNER, M. R. GRGURIC ANDS. L. BEATY
The Department of Biology, The University of Akron, Akron, OH 44325-3908, USA
Accepted 29 November 1995
findings have since been confirmed on a variety of other reptilian species and this has led to the commonly held view that, in response to a temperature change, physiological control of acid–base adjustments is ventilatory and there is no significant metabolic regulation of pH, i.e. no ion exchange (see review by Reeves, 1977). A putative advantage of this system, in which acid–base adjustments result from shifts in chemical equilibria that are accompanied by rapid changes in the air convection requirement, is that acid–base transitions can be accomplished virtually instantaneously with changes in body temperature and hence disruption of pH-dependent physiological processes is avoided (Reeves and Malan, 1976). Consistent with this concept, several studies examined the time course of temperature effects on blood (plasma) acid–base status and concluded that they occur rapidly and that a period of acclimation is not necessary to obtain steady-state results (Baumgardner and Rahn, 1967; Jackson and Kagen, 1976; Ackerman and White, 1980; Bickler, 1981; Douse and Mitchell, 1991).
Increasingly, however, there is convincing evidence that many air-breathing ectotherms employ relatively slow ion-exchange mechanisms to adjust acid–base status with changes in temperature (Nolan and Frankel, 1982; Stinner and Wardle, 1988; Lutz et al. 1989; Stinner et al. 1994). The emerging picture is that air-breathing ectotherms utilize a combination of respiratory and metabolic mechanisms and hence are not unlike water breathers (Butler and Day, 1993; Gaillard and Malan, 1985). The relative contributions of these two control mechanisms probably differ substantially among species and among tissues within an animal. For example, plasma [HCO32] is independent of temperature in the American
alligator Alligator mississippiensis, but varies by 0.23 mmol l2l°C21in black racer snakes (Douse and Mitchell,
1991; Stinner and Wardle, 1988). Kayser (1940) reported that blood [CO2] changed by approximately 0.7 mmol l21°C21
when the Mediterranean spur-thighed tortoise Testudo graeca was cooled from 20 to 5 °C. In the cane toad Bufo marinus, plasma [HCO32] is independent of body temperature from 30
to 10 °C, whereas many tissues in the toad exhibit striking changes in intracellular [CO2] over this temperature range
(Boutilier et al. 1987; Stinner et al. 1994). Consequently, acid–base adjustments associated with changes in body temperature are complex and cannot be assumed to occur rapidly in many species. In black racer snakes cooled from 30 to 5 °C within a few hours, blood [CO2] did not reach
steady-state levels until approximately 60 h after the decrease in temperature (Stinner and Wardle, 1988). Relatively slow changes in blood [CO2], and hence [HCO32], in other
amphibian and reptilian species cooled to low temperatures have also been reported by early investigators (see Kayser, 1940).
The objective of the present study was to determine the time course of ventilatory adjustments related to acid–base regulation in a species known to exhibit large increases in blood [HCO32] when body temperature is lowered.
Consequently, we chose the black racer snake Coluber constrictor, which we cooled from 30 to 10 °C within 4 h and
then monitored acid–base status and air convection requirement. We hypothesized that air convection requirement would not reach steady-state levels until the relatively slow increase in CO2stores had been completed.
Materials and methods
Animals
Black racer snakes Coluber constrictor L. were purchased from a commercial supplier and flown to Ohio. The snakes were housed two to three per cage (120 cm355 cm325 cm; length, width, height). A light bulb inside each cage set to a 12 h:12 h L:D cycle afforded a basking site at about 35 °C. Room temperature was thermostatically controlled at 27–29 °C. Approximately once weekly, the snakes were fed on mice and rat pups. Water was available at all times. All animals used in this study appeared to be in excellent health. They were fasted for 1 week prior to experimentation.
Ventilation and metabolism
Ventilation volumes were measured plethysmographically. Close-fitting latex masks were constructed as previously described (Stinner, 1982). The anterior portion of the mask covering the eyes and nares was cut away and enlarged with clear silicone rubber to form a chamber of approximately 5 ml with incurrent and excurrent air ports. The masks were sealed to the animals with cyanoacrylate adhesive (Krazy Glue). Care was taken to flush the masks continuously with room air during cementing.
The masked animals were placed inside a 26.5 cm315 cm341 cm (width, height, length) acrylic chamber that served as the plethysmograph. The plethysmograph was housed inside a temperature-controlled cabinet (Precision Scientific model 815, ±1 °C). The ports of the masks were connected to 6 mm i.d. flexible silastic tubing. Outside the plethysmograph, the incurrent air line was extended by a 40 cm section of Tygon tubing (1 cm i.d.) into a container filled with water absorbent (Drierite). The container was open to the cabinet air. This incurrent air line set-up ensured a negligible resistance to breathing in order to avoid unnatural pressures associated with a closed head chamber (Clark et al. 1978). Air was drawn through the container, tubing and mask at approximately 200 ml min21by R-1 flow
control pumps (Ametek, Pittsburg, PA, USA) situated outside the temperature cabinet. The snakes were left unrestrained within the sealed plethysmograph.
The temperature-controlled cabinet containing the plethysmograph was equipped with a one-way mirror so that the snakes could be observed. Air from inside the cabinet was continuously drawn through the Drierite container into the incurrent air line, mask and excurrent air line. Outside the cabinet, a sample (approximately 150 ml min21) of the
CO2 analyzer was calibrated twice daily with dry CO2-free
room air and a 1.50 % CO2(balance air) certified gas mixture.
Accuracy (±0.01 % O2, 1 % of CO2 reading), response time
(90 % in 0.1 s for O2, 0.03 s for CO2) and stability of the
analyzers were verified by Ametek shortly before this study began. The oxygen and carbon dioxide percentages were recorded using a Gould model 2400S chart recorder. For calculating metabolic rates (see below), the recordings were integrated over 1 h intervals, either by cutting and weighing the paper or by using an Un-Scan-It scanner and digitizing software (Silk Scientific, Inc., Orem, UT, USA). Tidal volumes were measured using a Validyne DP45 differential pressure transducer positioned between the plethysmograph and the temperature cabinet air. The transducer signal was fed into a model CD12 transducer indicator (Validyne Engineering Corp., Northridge, CA, USA) and recorded with a Gould model TA 4000 recorder. The plethysmograph was calibrated using manual injections of air from a syringe at both 30 and 10 °C at rates close to breathing frequencies while the animals were inside the chamber.
The animals were left undisturbed inside the plethysmograph and temperature-controlled cabinet for at least 24 h at 30 °C. Metabolic and breathing rates were then determined for inactive animals over a 1–5 h period. The cabinet temperature was lowered to 10 °C and recordings were continued for 60 h. Temperature within the plethysmograph fell from 30 to 10 °C within 4 h. Preliminary studies in which cloacal temperature was measured with a rectal temperature probe (Yellow Springs Instruments, Yellow Springs, OH, USA) showed that body temperature also fell to 10±1 °C within 4 h. Briefly opening a valve outside the temperature-controlled cabinet allowed for pressure equilibration between the plethysmograph and atmosphere during cooling.
O2uptake (V˙O∑) was calculated from the equation:
where V˙Eis the flow rate in the excurrent air line, which was measured using a Brooks flow meter calibrated against a small-animal respirometer (Warren E. Collins, Braintree, MA, USA), FIN∑and FIO∑are the fractions of N2or O2in dry incurrent air,
and FEN∑ and FEO∑ are the fractions of N2 and O2 in dry
excurrent air. The ratio FEN∑/FIN∑converts V˙Eto V˙I, the flow rate in the incurrent air line (Depocas and Hart, 1957). FIN∑
and FEN∑ were calculated from 12(FIO∑+FICO∑) and
12(FEO∑+FECO∑) respectively, where FEO∑ and FECO∑ were
obtained by the integration procedure described above. CO2production (V˙CO∑)was calculated from the equation:
Metabolic rates (V˙O∑ and V˙CO∑) are reported in
mlSTPDkg21h21. For the temperature conversion, incurrent
air-line temperature was monitored with a certified instant digital hygrometer/thermometer (Fisher Scientific). The
respiratory exchange ratio (RE) was calculated from the ratio V˙CO∑/V˙O∑. Inspired minute ventilation was obtained by
summing the inspired tidal volumes for 1 h intervals.
Cannulation and blood analyses
Prior to surgery, 16 snakes were chilled for 2–3 h in crushed ice and 0.1 ml of Lidocaine (2 %) was injected at the surgical site. A ventral midline incision was made at the level of the tenth, eleventh and twelfth scales from the anal plate. A PE-50 cannula filled with heparinized (1000 i.u. ml21) saline was
advanced several centimeters upstream into the dorsal aorta and tied occlusively. The free end of the cannula was exteriorized laterally using a blunt needle and anchored using sutures and Krazy Glue. The ventral incision was closed with three stitches and sealed using Krazy Glue.
After surgery, the snakes were allowed to recover in their cages for about 72 h. They appeared to be in excellent health and there were no observable effects of the procedure on motor performance. After recovery, the snakes were placed inside individual 16 cm326 cm336 cm (height, width, length) acrylic chambers, which were housed inside the Precision temperature-controlled cabinets. A swivel extending through the floor of the chamber was attached to the snake near the anal plate by two narrow (2 cm) strips of tape. The trailing end of the cannula was passed out of the temperature-controlled cabinet through the swivel and floor, so that blood could be sampled without disturbing the snake. The total length of the cannula was 50–60 cm. The chambers were continuously flushed throughout the experiment with cabinet air (400 ml min21) using R-1 flow control pumps.
The snakes were left undisturbed for 48 h at 30 °C to adjust to the experimental apparatus. They were not fed while in the chamber, but water was available at all times. In seven of the snakes, cabinet temperature was then lowered to 10 °C; a blood sample was taken 4 h after changing the temperature, and approximately eight further samples were taken from each snake over a 4 day period. During this time, the snakes remained at 10 °C and were left undisturbed.
To sample blood, the cannula deadspace was first flushed by withdrawing its contents (heparinized saline) followed by about 0.2 ml of blood into a syringe. A train of four heparinized microhematocrit capillary tubes was connected to the cannula and the snake’s blood pressure rapidly filled each tube with approximately 0.07 ml of blood. A few drops of blood were allowed to run out of the free end of the capillary tube train before sealing in order to avoid using blood exposed to air during collection. The capillary tube train was then detached from the cannula, sealed with Critocaps, and immediately immersed in iced water for future analysis. The blood in the syringe was returned to the snake and the cannula was filled with fresh heparinized saline.
All blood sample analyses were completed within 1 h of collection. PCO∑ and pH were measured using Radiometer
BMS-3 electrodes thermostatted to 10 °C and Radiometer PHM72 acid–base analyzers. The PCO∑ electrode was
calibrated using a 5.0 % CO2certified Radiometer gas mixture
(2)
FEN∑
FIN∑
V˙CO∑= V˙EFECO∑− V˙E× FICO∑,
(1)
FEN∑
FIN∑
and a 1.39 % CO2mixture supplied by mass flow controllers
(model FC-260, Tylan Corp., Torrance, CA, USA). Precision of the PCO∑ electrode was ±0.01 kPa. The pH electrode was
calibrated using Radiometer precision buffers. Precision of the pH electrode was ±0.001 pH units. PCO∑ and pH electrode
calibrations were verified immediately before blood measurements. For plasma [CO2], a microhematocrit tube
containing 0.07 ml of blood was spun at 15 000 g for 5 min in a microcapillary centrifuge (Haemofuge, Baxter Scientific Products). Plasma [CO2] was then determined in duplicate
using a Capni-con 3a CO2analyzer (Cameron Instrument Co.,
Port Aransas, TX, USA). Precision of the CO2analyzer was
±0.2 mmol l21.
In the remaining nine cannulated snakes, blood samples were collected as described above at the end of the 48 h at 30 °C and then at 2 and 4 h after changing the cabinet temperature to 10 °C. Blood samples taken at 30 °C were analyzed in duplicate for plasma [CO2] using the Capni-con 3a CO2analyzer, and
plasma [lactate] was determined on all 27 blood samples. Within 15 min of blood collection, 100ml of the plasma was deproteinized by adding 200ml of a cold 8 % perchloric acid solution. The mixture was spun at 15 000 g for 10 min in an Eppendorf microcentrifuge (Fisher Scientific) and the supernatant was then frozen for not more than 3 days before plasma [lactate] analysis using an enzymatic test kit (Sigma no. 726-uv/826-uv) and Coleman Jr II model 6/20 spectrophotometer.
Comparisons between values were performed using paired t-tests, Student’s t-tests, least-squares regression or one-way analysis of variance (ANOVA), and significance was assumed when P<0.05. Means ±S.D. are reported for group values.
Results
Ventilation and metabolism
Cooling seven masked C. constrictor (mean mass 190 g, range 140–249 g) from 30 to 10 °C lowered V˙O∑ from
100.5±16.8 to 11.3±4.4 ml kg21h21and V˙
CO∑ from 62.0±9.9
to 7.4±2.9 ml kg21h21(Table 1). The mean metabolic rate at
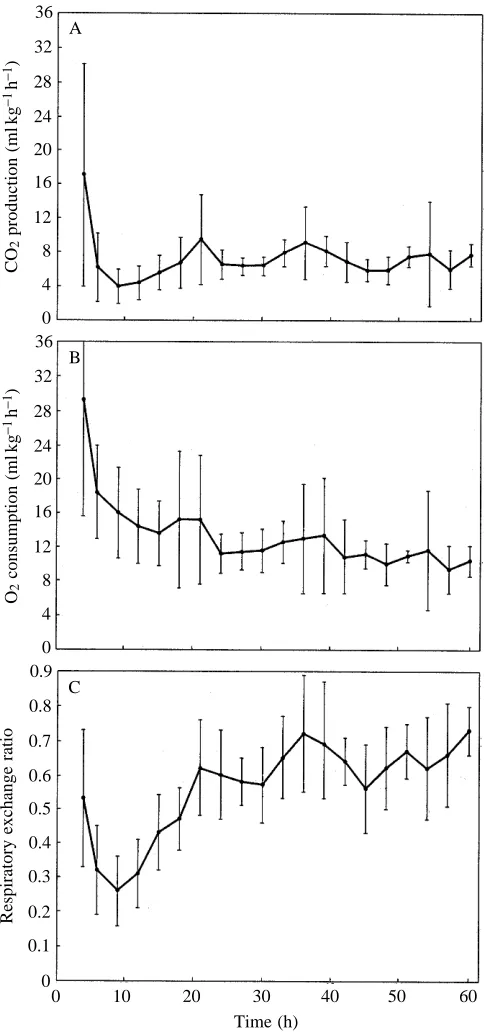
10 °C was calculated from rates measured from 36 to 60 h after starting the temperature reduction, where metabolic rate appeared to be stable (Fig. 1). The quadratic polynomial expression for oxygen consumption from 4 to 60 h is V˙O∑=23.5620.59t+0.01t2, where t is time in hours (P<0.01).
From 4 to 9 h, V˙CO∑ declined more rapidly than V˙O∑ and a
depression below steady-state V˙CO∑was evident (Fig. 1). V˙CO∑
from 6 to 18 h was significantly lower than at 21–60 h (ANOVA, P<0.001). Consequently, RE fell to 0.26±0.l at 9 h, and then gradually increased to stable values by approximately 35 h. RE from 9 to 33 h was significantly lower (P<0.001) than at 36–60 h. RE from 36 to 60 h averaged 0.65±0.14, which was not significantly different from RE at 30 °C (0.64±0.07) (Table 1).
Lowering body temperature significantly decreased breathing frequency from 2.6±1.1 breaths min21 to a
steady-state value of 0.44±0.18 breaths min21at 10 °C (average after
35 h; Table 1). Tidal volume at 30 °C was not significantly different from tidal volume at 10 °C, and there was no evidence of a change in tidal volume during the time at 10 °C. Minute ventilation (V˙air) fell to a steady-state value of
6.4±2.4 ml air kg21min21 at 10 °C (average after 35 h). The A
36
32
28
24
20
16
12
8
4
0
CO
2
production (ml
kg
−
1h
−
1)
B 36
32
28
24
20
16
12
8
4
0 O2
consumption (ml
kg
−
1h
−
1)
C 0.9
0.8
0.7
0.6
0.5
0.4
0.3
0.2
0.1
0
Respiratory exchange ratio
0 10 20 30 40 50 60
[image:4.609.316.558.71.588.2]Time (h)
pattern of change in breathing frequency and V˙airproduced by
the reduction in temperature appeared to follow that of V˙CO∑,
with some depression below 10 °C steady-state values evident within the first 24 h (Fig. 2). V˙air from 9 to 18 h was
significantly lower (ANOVA, P<0.025) than that from 21 to 60 h. However, the apparent reduction in breathing frequency over this period was not significant.
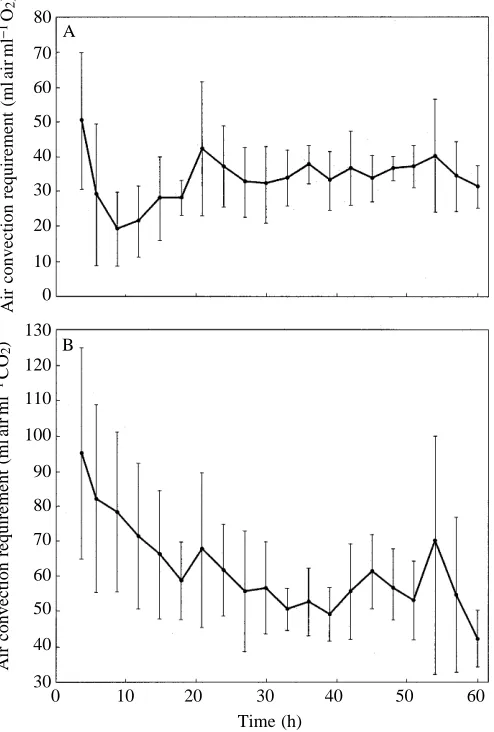
Air convection requirements (V˙air/V˙O∑, V˙air/V˙CO∑) did not
stabilize until RE had reached steady state, i.e. at about 35 h (Fig. 3). V˙air/V˙O∑ was significantly lower (P<0.025) and
V˙air/V˙CO∑ was significantly higher (P<0.05) at 9–33 h than at
36–60 h. V˙air/V˙O∑followed the same pattern as RE, falling to
19.3±10.2 ml air ml21O
2at 9 h and then increasing to a
steady-state value of 35.6±8.5 ml air ml21O
2, which was higher but
not significantly different (P>0.05, Student’s t-test) from values at 30 °C (28.6±10.0 ml air ml21O
2, Table 1). V˙air/V˙CO∑
followed a very different pattern from V˙air/V˙O∑. Cooling C.
constrictor produced a hyperventilation relative to V˙CO∑which
gradually declined to steady-state levels within about 35 h. The quadratic polynomial expression for this pattern is
V˙air/V˙CO∑=91.9821.82t+0.02t2, where t is time in hours
(P<0.01). Steady-state V˙air/V˙CO∑ at 10 °C
(55.3±16.7 ml air ml21CO
2) was higher but not significantly
different from that at 30 °C (45.5±13.0 ml air ml21CO 2).
Plasma PCO∑, [CO2], pH and [lactate]
Consistent with the changes in V˙air/V˙CO∑with cooling in the
snakes, PaCO∑ was initially low (1.47±0.33 kPa at 4 h) and
gradually increased to stable values within about 35 h (Fig. 4). PaCO∑measured after 35 h averaged 2.07±0.20 kPa (N=6, mean
mass 360 g, range 267–464 g). Plasma [CO2] also increased
during the initial 35 h, from 21.1±2.5 mmol l21 at 4 h to a
steady-state value of 25.1±1.7 mmol l21 (Fig. 4; N=7, mean
mass 363 g, range 267–464 g). There was a slight decrease in pH during the 100 h of measurements, from 7.665±0.094 at 4 h to 7.574±0.062 at 100 h (Fig. 4). The quadratic polynomial expression for this trend is pH=7.65320.0019t+0.00001t2
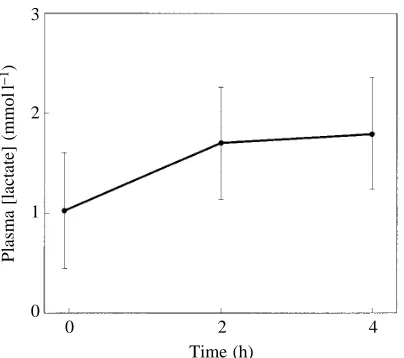
(P<0.01), where t is time in hours. There was no significant change in pH after 35 h, and steady-state pH averaged 7.581±0.076 (N=7) at 10 °C. Plasma [lactate] was low at 30 °C, averaging 1.0±0.6 mmol l21 (N=9, mean mass 246 g, range
[image:5.609.316.567.72.396.2]208–323 g). Cooling the snakes produced a small, but significant (P<0.05), rise in plasma [lactate] of 0.8 mmol l21
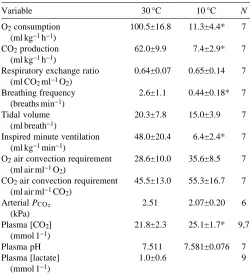
Table 1. Steady-state values for metabolic rate, ventilation rate and plasma acid–base status at 30 and 10 °C in the
snake Coluber constrictor
Variable 30 °C 10 °C N
O2consumption 100.5±16.8 11.3±4.4* 7 (ml kg−1h−1)
CO2production 62.0±9.9 7.4±2.9* 7 (ml kg−1h−1)
Respiratory exchange ratio 0.64±0.07 0.65±0.14 7 (ml CO2ml−1O2)
Breathing frequency 2.6±1.1 0.44±0.18* 7 (breaths min−1)
Tidal volume 20.3±7.8 15.0±3.9 7 (ml breath−1)
Inspired minute ventilation 48.0±20.4 6.4±2.4* 7 (ml kg−1min−1)
O2air convection requirement 28.6±10.0 35.6±8.5 7 (ml air ml−1O
2)
CO2air convection requirement 45.5±13.0 55.3±16.7 7 (ml air ml−1CO
2)
Arterial PCO∑ 2.51 2.07±0.20 6 (kPa)
Plasma [CO2] 21.8±2.3 25.1±1.7* 9,7 (mmol 1−1)
Plasma pH 7.511 7.581±0.076 7 Plasma [lactate] 1.0±0.6 9
(mmol 1−1)
Values are means ±S.D.
* indicates values significantly different (P<0.05) from those at 30 °C.
Arterial plasma PCO∑ and pH at 30 °C were predicted from equations in Stinner and Wardle (1988).
Values at 10 °C were measured after 35 h following reduction of temperature from 30 °C, except for tidal volume which was measured after 4 h.
A 1.8
1.6
1.4
1.2
1.0
0.8
0.6
0.4
0.2
0
Breathing frequency (breaths
min
−
1)
B 28
24
20
16
12
8
4
0
Minute ventilation (ml
kg
−
1min
−
1)
0 10 20 30 40 50 60
Time (h)
[image:5.609.47.297.107.385.2](Fig. 5). Plasma [CO2] in nine snakes at 30 °C was not
significantly different from that in seven snakes at 4 h of cooling (Table 1; Fig. 4).
Behavior
During cooling, the snakes occasionally moved within the chambers. These movements were deliberate and appeared to involve light to moderate levels of activity. The snakes did not struggle in an attempt to escape the falling temperature. After 4 h at the lower temperature, the snakes rarely moved.
Discussion
Our steady-state results are qualitatively similar to those reported previously. Steady-state V˙O∑, V˙CO∑and V˙airdecreased
when temperature was lowered from 30 to 10 °C, but the decrease in metabolic rate exceeded the decrease in ventilation rate so that the air convection requirement (V˙air/V˙O∑ or
V˙air/V˙CO∑) increased. This is a typical pattern for reptiles and
accounts for their positive temperature–PaCO∑relationship (see
reviews by Jackson, 1986; Glass and Wood, 1983; Reeves, 1977). The increase in steady-state air convection requirement in C. constrictor was relatively small (from 28.6 ml air ml21O
2 A
60
50
40
30
20
10
0
130
120
110
Air convection requirement (ml
air
ml
−
1O
2
)
B
100
90
80
70
60
50
40
30
Air convection requirement (ml
air
ml
−
1CO
2
)
0 10 20 30 40 50 60
Time (h) 80
[image:6.609.315.557.74.621.2]70
Fig. 3. Effect of changing temperature from 30 to 10 °C on air convection requirements (A, V˙air/V˙O∑; B, V˙air/V˙CO∑) in seven Coluber
constrictor. Values are means ±S.D. Other details are as in Fig. 1.
A 2.40
2.13
1.87
1.60
1.33
1.07
Arterial plasma
PCO
∑
(kPa)
B 29
27
25
23
21
19
17
Arterial plasma [CO
2
] (mmol
l
−
1)
C 7.9
7.8
7.7
7.6
7.5
7.4
Arterial plasma pH
0 20 40 60 80 100
Time (h)
Fig. 4. Effect of changing temperature from 30 to 10 °C on arterial plasma PCO∑, (A) (N=6), [CO2] (B) (N=7) and pH (C) (N=7) in
[image:6.609.47.294.77.443.2]to 35.6 ml air ml21O
2) and was not statistically significant
(P>0.05). This small increase is, however, consistent with the small decrease in steady-state PaCO∑ measured in C.
constrictor (2.07 kPa at 10 °C versus 2.51 kPa at 30 °C; Stinner and Wardle, 1988; this study).
Of greater significance to the present study is the transition between steady states. Lowering body temperature from 30 to 10 °C initially depressed the RE, and approximately 35 h was required to re-establish the steady-state value. Many studies have now documented that RE falls transiently with cooling and increases transiently with warming in a variety of amphibian and reptilian species, including urodeles (Cook, 1949), anurans (Dontcheff and Kayser, 1936; Stinner et al. 1994), turtles (Hall, 1924; Ludicke, 1936; Kayser, 1940; Benedict, 1932; Stinner and Wardle, 1988; Pages et al. 1994), lizards (Kayser, 1940; Potter and Glass, 1931; Cook, 1949; Bickler, 1981; Ackerman and White, 1980), snakes (Benedict, 1932; Stinner, 1982; Stinner and Wardle, 1988) and crocodilians (Ludicke, 1936). These transient changes in RE have been correlated with adjustments in blood [CO2] in some species (Kayser, 1940;
Ackerman and White, 1980; Bickler, 1981; Stinner, 1982; Stinner and Wardle, 1988) and intracellular [CO2] in the toad
Bufo marinus (Stinner et al. 1994).
Kayser (1940) suggested that the depression in RE and accompanying CO2 retention recorded in reptiles during
cooling represented an acidosis much like that in mammalian hibernators entering torpor (see, for example, Nestler, 1990). More recently, in the light of the alphastat hypothesis, investigators have interpreted the retention of CO2as a
stress-related respiratory acidosis produced by rapidly cooling the animals below their normal activity temperature range (Ackerman and White, 1980; Bickler, 1981). Stinner (1982) reported an inverse relationship between temperature and blood [CO2] over the temperature range 30–20 °C in the snake
Pituophis melanoleucus and hypothesized that this was caused
by changes in resting levels of lactic acid. However, Stinner and Wardle (1988) showed that this proposal was incorrect because steady-state resting levels of blood lactic acid changed very little with temperature (T) changes despite large 2D[CO2]/DT and 2D[HCO32]/DT coefficients in the blood of
C. constrictor. They concluded that the depression in RE with cooling and the concomitant rise in blood [HCO32] resulted
from ion-exchange mechanisms that contributed to the now familiar DpHa/DT relationship in ectotherms. Given the large number of species known to vary RE with changes in temperature, this conclusion implies that probably most species of air-breathing ectotherms utilize a combination of respiratory and metabolic (ion-exchange) mechanisms to achieve the appropriate temperature-dependent pH. This view is contrary to predictions based upon a Rosenthal system, in which there is no ion exchange and ventilatory control is the sole mechanism used to defend the physico-chemically determined pH (Reeves, 1972).
The time courses required to reach steady-state RE values are strikingly different for cooling compared with heating (Benedict, 1932; Stinner, 1982; Stinner and Wardle, 1988; Stinner et al. 1994). This thermal hysteresis presumably reflects the effect of temperature upon the bicarbonate-producing steps, including CO2 production, membrane
transport and possibly tissue blood flow. When, for example, C. constrictor was cooled from 30 to 5 °C, approximately 60 h was required to reach steady-state RE values, but only 6–7 h was required when the snakes were reheated to 30 °C (Stinner and Wardle, 1988). The time courses for changes in blood [CO2] closely paralleled the transients in RE. The adjustments
in RE and blood [CO2], particularly for cooling, took
considerably longer than the 2–3 h taken to change body temperature. This suggests that physiological adjustments related to acid–base homeostasis continue long after the change in body temperature. The present study demonstrates that, in C. constrictor, the ventilatory adjustments associated with temperature-related changes in acid–base status occur relatively slowly and are correlated with the time required to alter CO2stores.
Ventilation and acid–base status did not reach steady-state values in C. constrictor until about 35 h after starting the decrease in temperature. C. constrictor responded to the fall in body temperature by temporarily increasing V˙air/V˙CO∑, which
lowered PaCO∑ and elevated plasma pH. Plasma [lactate] at
30 °C and during the 2–4 h it took to reduce the temperature to 10 °C was low and typical of levels in resting reptiles (Bennett and Dawson, 1976). These low lactate levels are consistent with our observations of only light to moderate activity by the snakes during cooling. Hence, a lactacidosis does not appear to be of primary importance in elevating V˙air/V˙CO∑. With the
relatively slow accumulation of plasma CO2, and hence
[HCO32], RE was depressed. Traditionally, [HCO32] is
considered to be the sum of all ionic CO2species ([CO322],
[NaCO32], [protein-NH-COO2]) and is referred to as the
apparent [HCO32] (Siggaard-Anderson, 1974). The apparent
[HCO32] is calculated by subtracting dissolved [CO2], i.e. 3
2
1
0
Plasma [lactate] (mmol
l
−
1)
0 2 4
[image:7.609.74.276.70.249.2]Time (h)
aCO23PCO∑, from gasometrically determined total [CO2]. At
10 °C, the CO2 solubility of plasma (aCO2) is
0.4719 mmol l21kPa21(Severinghaus, 1965). In C. constrictor
at 10 °C, PaCO∑increased by 0.6 kPa (Fig. 4) and thus dissolved
[CO2] increased by 0.3 mmol l21, which is about 7.5 % of the
change in total [CO2] measured in this study. Consequently,
the gradual increase in plasma [CO2] evident in Fig. 4 is
primarily the result of HCO32 production. The site of
bicarbonate production has not been determined, but is presumably the kidney, stomach and/or tissues such as skeletal muscle. With the rise in plasma [HCO32], V˙air/V˙CO∑declined
and PaCO∑ increased to steady-state levels with only a small
decrease in plasma pH. This response is suggestive of a metabolic acidosis with respiratory compensation until a new temperature-specific steady-state plasma [HCO32] could be
achieved. The compensation was rapid since, at 30 °C, plasma pH in C. constrictor is 7.511 (Stinner and Wardle, 1988), but within 4 h after cooling began, when the first blood samples were taken, plasma pH was already close to its steady-state value at 10 °C. Correlated with bicarbonate production, and the corresponding depression in pulmonary CO2elimination that
produced the low RE, was the transient decrease in V˙air and
V˙air/V˙O∑.
An alternative interpretation of our results is that the gradual decline in V˙air/V˙CO∑ produced the low RE and rise in PCO∑,
which resulted in the formation of bicarbonate owing to titration of nonbicarbonate buffers (i.e. protein) within the extracellular fluid and red blood cells. However, the nonbicarbonate buffer value of extracellular fluid is much too low to account for the relatively large increase in plasma [CO2]
observed in this study, as the following calculations show. Blood hemoglobin concentration and hematocrit in C. constrictor are close to 80 g l21 and 25 %, respectively
(Stinner, 1987). Plasma protein concentration is 50 g l21(J. N.
Stinner, unpublished results). Blood volume and extracellular fluid volume (‘thiocyanate space’) in snakes are about 5.5 % and 42 % of body mass, respectively (Smits and Lillywhite, 1985). Assuming that interstitial fluid contains no protein and that the plasma is well mixed with the interstitial fluid, the hemoglobin and protein concentrations for the whole extracellular fluid volume (interstitial fluid + plasma + red blood cell volume) are 10.l g l21 and 6.3 g l21, respectively.
The gram buffer values for hemoglobin and plasma protein are 0.18 and 0.11 mmol HCO32l21pH unit21g21, respectively
(Siggaard-Anderson, 1974). In C. constrictor, plasma pH fell by 0.09 pH units as V˙air/V˙CO∑declined. Hence, the increase in
extracellular fluid [HCO32] from buffering by hemoglobin is
0.18310.130.09=0.16 mmol HCO32l21ECF, where ECF is
extracellular fluid, and from plasma protein buffering would be 0.1136.330.09=0.06 mmol HCO32l21ECF, for a total
increase in [HCO32] of about 0.2 mmol l21. These calculations
ignore the minor corrections for differences in the distribution of HCO32 between red blood cells and plasma, and the
difference between solution versus water concentrations. Thus, less than 7 % of the rise in plasma [CO2] (see Table 1) can be
attributed to nonbicarbonate buffering.
In conclusion, acid–base adjustments are not accomplished instantaneously with changes in body temperature in this species. Although the ionization constants and CO2solubility
coefficient presumably decrease virtually instantaneously with a decrease in temperature, the physiologically regulated [HCO32] imposes a constraint that prolongs the time course
for achieving steady-state ventilation and acid–base status.
References
ACKERMAN, R. A. AND WHITE, F. N. (1980). The effects of
temperature on acid–base balance and ventilation of the marine iguana. Respir. Physiol. 39, 133–147.
AUSTIN, J. H., SUNDERMAN, F. W. ANDCAMACK, J. G. (1927). Studies in serum electrolytes. II. The electrolyte composition and the pH of serum of a poikilothermous animal at different temperatures. J. biol. Chem. 72, 677–685.
BAUMGARDNER, F. W. ANDRAHN, H. (1967). Normal blood pH of the toad at different temperatures as a function of the ionization constant of water. Physiologist 10, 121.
BENEDICT, F. C. (1932). The Physiology of Large Reptiles. Carnegie Institute Washington Publications.
BENNETT, A. F. ANDDAWSON, W. R. (1976). Metabolism. In Biology
of the Reptilia, vol. 5 (ed. C. Gans and W. R. Dawson), pp. 127–223. New York, London: Academic Press.
BICKLER, P. E. (1981). Effects of temperature on acid–base
balance and ventilation in desert iguanas. J. appl. Physiol. 51, 452–460.
BOUTILIER, R. C., GLASS, M. L. ANDHEISLER, N. (1987). Blood gases and extracellular/intracellular acid–base status as a function of temperature in the anuran amphibians Xenopus laevis and Bufo marinus. J. exp. Biol. 130, 13–25.
BUTLER, P. J. AND DAY, N. (1993). The relationship between intracellular pH and seasonal temperature in the brown trout Salmo trutta. J. exp. Biol. 177, 293–297.
CLARK, B. D., GANS, C. ANDROSENBERG, H. I. (1978). Air flow in snake ventilation. Respir. Physiol. 32, 207–212.
COOK, S. F. (1949). Respiratory metabolism of certain reptiles and amphibia. Univ. Calif. Publ. Zool. 53, 367–376.
DEPOCAS, F. AND HART, J. S. (1957). Use of the Pauling oxygen analyzer for measurement of oxygen consumption of animals in open-circuit systems and in a short-lag, closed-circuit apparatus. J. appl. Physiol. 10, 388–392.
DONTCHEFF, L. AND KAYSER, C. (1936). Effet de concentrations, variées en acide carbonique de l’air atmospherique sur le quotient respiratoire et la reserve alcaline de la grenouille. C.r. hebd. Séanc. Soc. Biol. 123, 815–820.
DOUSE, M. A. AND MITCHELL, G. S. (1991). Time course of temperature effects on arterial acid–base status in Alligator mississippiensis. Respir. Physiol. 83, 87–102.
GAILLARD, S. ANDMALAN, A. (1985). Intracellular pH–temperature relationships in a water breather, the crayfish. Molec. Physiol. 7, 1–16.
GLASS, M. L. ANDWOOD, S. C. (1983). Gas exchange and control of breathing in reptiles. Physiol. Rev. 63, 232–260.
HALL, F. G. (1924). The respiratory exchange in turtles. J. Metab. Res. 6, 393–401.
JACKSON, D. C. (1971). The effect of temperature on ventilation in the turtle, Pseudemys scripta elegans. Respir. Physiol. 12, 131–140. JACKSON, D. C. (1986). Acid–base regulation of reptiles. In Acid–Base
Regulation in Animals (ed. N. Heisler), pp. 235–263. Amsterdam: Elsevier Biomedical Press.
JACKSON, D. C. AND KAGEN, R. D. (1976). Effects of temperature transients on gas exchange and acid–base status of turtles. Am. J. Physiol. 230, 1389–1393.
KAYSER, C. (1940). Le quotient respiratoire chez quelques espèces poikilothermes. Annls physiol. physiochim. Biol. 16, 1–68.
LUDICKE, M. (1936). Untersuchungen uber de respirations und
harnguotienten an kaltbluten. Pflügers Arch. ges. Physiol. 237, 222–230.
LUTZ, P. L., BERGEY, A. AND BERGEY, M. (1989). Effects of temperature on gas exchange and acid–base balance in the sea turtle Caretta caretta at rest and during routine activity. J. exp. Biol. 144, 155–169.
NESTLER, J. R. (1990). Relationships between respiratory quotient and metabolic rate during entry to and arousal from daily torpor in deer mice (Peromyscus maniculatus). Physiol. Zool. 63, 504–515. NOLAN, W. F. ANDFRANKEL, H. M. (1982). Effects of temperature on
ventilation and acid–base status in the black racer snake, Coluber constrictor. Comp. Biochem. Physiol. 73A, 57–61.
PAGES, T., FUSTER, J. F. AND PALACIOS, L. (1994). Ventilatory responses to temperature variation in the fresh water turtle, Mauremys caspica leprosa. J. comp. Physiol. B 164, 390–395. POTTER, G. E. ANDGLASS, H. B. (1931). A study of hibernating horned
lizards, Phrynosoma cornutum. Copeia 1931, 128–131.
REEVES, R. B. (1972). An imidazole alphastat hypothesis for
vertebrate acid–base regulation: tissue carbon dioxide content and body temperature in bullfrogs. Respir. Physiol. 14, 219–236. REEVES, R. B. (1977). The interaction of body temperature and
acid–base balance in ectothermic vertebrates. A. Rev. Physiol. 39, 559–586.
REEVES, R. B. ANDMALAN, A. (1976). Model studies of intracellular acid–base temperature responses in ectotherms. Respir. Physiol. 28, 49–63.
ROBIN, E. D. (1962). Relationship between temperature and plasma pH and carbon dioxide tension in the turtle. Nature 195, 249–251. ROBIN, E. D., BROMBERG, P. A. AND CROSS, C. E. (1969). Some aspects of the evolution of acid–base regulation in vertebrates. Yale J. Biol. Med. 41, 448–467.
ROSENTHAL, T. B. (1948). The effects of temperature on the pH of blood and plasma in vitro. J. biol. Chem. 173, 25–30.
SEVERINGHAUS, J. W. (1965). Blood gas concentrations. In Handbook of Physiology, Respiration, vol. II (ed. W. O. Fenn and H. Rahn), pp. 1475–1487. Washington: American Physiological Society. SIGGAARD-ANDERSON, O. (1974). The Acid-Base Status of the Blood,
4th edn. Copenhagen: Munksgaard.
SMITS, A. W. ANDLILLYWHITE, H. B. (1985). Maintenance of blood volume in snakes: transcapillary shifts of extravascular fluids during acute hemorrhage. J. comp. Physiol. B155, 305–310. STINNER, J. N. (1982). Ventilation, gas exchange and blood gases
in the snake, Pituophis melanoleucus. Respir. Physiol. 47, 279–298.
STINNER, J. N. (1987). Cardiovascular and metabolic responses to temperature in Coluber constrictor. Am. J. Physiol. 253, R222–R227.
STINNER, J. N., NEWLON, D. L. ANDHEISLER, N. (1994). Extracellular and intracellular CO2 concentration as a function of body temperature in the toad Bufo marinus. J. exp. Biol. 195, 345–360. STINNER, J. N. ANDWARDLE, R. L. (1988). Effect of temperature upon