Rapid MR Imaging of the Pediatric Brain Using the Fast
Spin-Echo Technique
S. S. Ahn,1.2 M. T. Mantello,l.2 K. M. Jones,1.2 R. V. Mulkern,1 P. S. Melki,2 N. Higuchi,3 and P. D. Barnes1 ·4
Purpose: To evaluate diagnostic reliability and to establish optimal scanning techniques of a recently developed Fast Spin-echo MR pulse sequence that allows rapid proton density-weighted and T2-weighted imaging. Methods: We compared lesion conspicuity and signal intensity meas-urements on Fast Spin-echo and conventional spin-echo sequences in 81 patients ranging from 1 week to 25 years in age on a 1.5-T MR unit. A total of 28 Fast Spin-echo dual-echo images (14 slice locations) were obtained in 2:08 minutes with a 256 X 128 matrix or in 3:12 minutes with a 256 X 192 matrix at a TR of 2000 msec and two excitations. Results: Lesion conspicuity and characterization on Fast Spin-echo images compared favorably with conventional spin-echo images in our series when pseudo-TEs of 15 and 90 msec were employed for proton density-weighted and T2-weighted images, respectively. Fast Spin-echo images yielded diagnostic information in four nonsedated patients whose conventional spin-echo images were either degraded by motion or unobtainable. Fat signal remained bright on T2-weighted Fast Spin-echo images. Magnetic-susceptibility effects were slightly reduced with Fast Spin-echo but did not pose any diagnostic problem in our series. Conclusion: Diagnostically reliable rapid dual-echo brain images can be obtained with Fast Spin-echo sequences.
Index terms: Magnetic resonance, technique; Brain, magnetic resonance; Pediatric neuroradiology
AJNR 13:1169-1177, Jul/Aug 1992
Magnetic resonance (MR) imaging has proven to be the study of choice for many neuroradio-logic applications since its introduction into clin-ical practice. The popularity of the conventional spin-echo (CSE) sequence is attributed to its simple contrast behavior and relative insensitivity to field inhomogeneity and magnetic-susceptibility effects ( 1 ).
One drawback of the CSE sequence is a rela-tively long acquisition time. A typical dual-echo CSE sequence employing 2000/30, 80/2 (TR/ TE/excitations) and a 256 X 128 (frequency X
Received August 30, 1991; accepted and revision requested October 3; revision received November 11.
Presented at the 29th Annual Meeting of the ASNR, Washington DC, June 9-14, 1991.
1
Department of Radiology, The Children's Hospital, Boston, MA. 2
Department of Radiology, Section of Neuroradiology, Brigham and Women's Hospital, Harvard Medical School, Boston, MA.
3
Keio University Hospital, Department of Radiology, Tokyo, Japan. 4
Address reprint requests to Patrick D. Barnes, MD, Department of Radiology, The Children's Hospital, 300 Longwood Avenue, Boston, MA 02115.
AJNR 13:1169-1177, Jui/Aug 1992 0195-6108/92/1304-1169 © American Society of Neuroradiology
phase) matrix requires nearly 9 minutes to com-plete. This long imaging time contributes to mo -tion artifact and patient discomfort. The long imaging time is especially problematic in pediatric neuroimaging because of the increased need for sedation. In addition, higher resolution studies using larger matrices have been impractical with CSE techniques because of time constraints. For example, a CSE study (2000/30, 80/2) would take more than 13 minutes for a 256 X 192 matrix and more than 18 minutes for a 256 X 256 matrix.
The potential benefits of faster sequences have stimulated research in the development of MR sequences that reduce acquisition times without sacrificing the image quality provided by CSE techniques. Several methods have been imple-mented (2, 3), but poor image quality has hind-ered widespread clinical use.
Fast Spin-echo (FSE) generates dual-echo im-ages in a fraction of the time required for CSE. FSE is based on the Rapid Acquisition with Re-laxation Enhancement (RARE) sequences de-scribed by Hennig and others (4-6) but modified with a specific phase encode-reordering algorithm
1170
to provide flexible T2 contrast manipulation (7). The algorithm is based on the principle that tagging early echoes with small phase-encoding gradients minimizes T2-weighting, while tagging late echoes with small phase-encoding gradients maximizes T2-weighting (6). Adjusting the echoes that are tagged with small phase-encode gra-dients is the means by which pseudo-echo times (pTEs) ranging from the earliest echo time to the last echo time within a given echo train can be chosen.
The purpose of our study was to evaluate the diagnostic reliability of the dual-echo FSE brain images in comparison to CSE images and to establish optimal scanning techniques for FSE neuroimaging in pediatric and adolescent pa-tients.
Materials and Methods
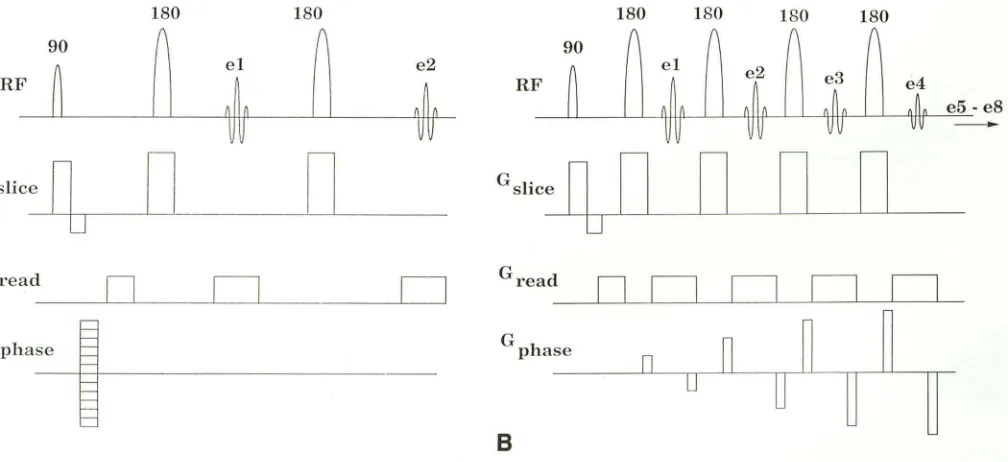
In the standard dual-echo CSE technique, a goo excita-tion radiofrequency (RF) pulse is followed by a 180° RF refocusing pulse with echo sampling between 15 and 30 msec to produce a proton density-weighted (PDW) image. Then, another 180° pulse, with echo sampling usually between 70 and 100 msec, is performed to acquire data for the more heavily T2-weighted (T2W) image. The CSE sequence is depicted in Fig. 1 A. Note that the sequence must be repeated for each individual phase-encoding step. In FSE, a goo pulse is followed by a series of 180° pulses that are closely spaced (15 msec in our study), resulting in the acquisition of eight echoes as opposed to the two
180 ISO
90
~
r
~
elRF
Jo
~~
Gslice
n
0
D
D
Gread
0
D
D
G phase
~
A
AJNR: 13, July/August 1gg2
echoes obtained with the CSE technique (Fig. 1 B). The first four echoes of the eight-echo train are used to collect four k-space (8) data lines for the PDW image, while the next four are used to gather four k-space data lines for the T2W image. Thus, FSE can theoretically reduce the time required to gather the full number of phase-encoding steps by a factor of four. Low phase-encoding gradient echoes give rise to the strongest signals and so dominate the contrast (6). Therefore, the extent of the T2-weighting for an FSE image is controlled by the choice of which echoes are encoded with the lowest phase-encoding gradients. This allows the operator to select an effective or pseudo-echo time (pTE), which is analogous to the echo time (TE) of CSE techniques (7).
FSE sequences were implemented on a 1.5-T Signa system (General Electric, Milwaukee, WI) equipped with actively shielded gradient coils. All studies were performed with the quadrature head coil designed to reduce RF power deposition and improve signal-to-noise ratio. The study was approved by the Committee on Clinical Investigation at the authors' institution.
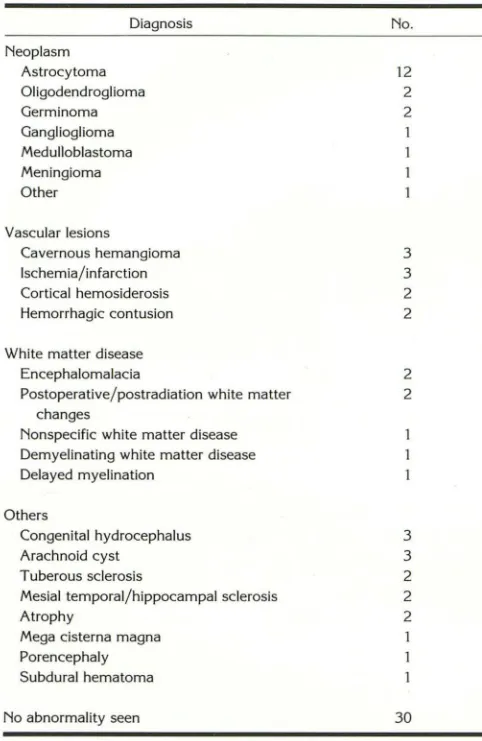
The FSE dual-echo brain images were acquired in ad-dition to conventional CSE images in 81 patients ranging in age from 1 week to 25 years. The composition of the study group is listed in Table 1. Two of the nonsedated patients had excessive motion artifact on initial T1-weighted sagittal CSE images. Only FSE axial images were obtained in these cases.
All CSE images were obtained in the axial plane with a TR of 2000 msec and TEs of 30 and 80 msec for PDW and T2W images, respectively. Other CSE imaging param-eters included a 256 X 128 matrix, 2 excitations, 5-mm slice thickness, 2.5-mm interslice gap, a 20-cm field of
180 ISO 180
e4
J
,
e5 -eS 011G slice
Gread
G
phase
8
0
on
D
D
D
Fig. 1. A, CSE pulse sequence; the top line indicates the RF transmit pulses and the acquired echoes. The next three lines indicate the application of slice, read, and phase encode gradients (e =echo sampling).
[image:2.612.60.564.469.700.2]AJNR: 13, July/ August 1992
TABLE 1: Composition of the study group (N
=
81)Diagnosis No.
Neoplasm
Astrocytoma 12
Oligodendroglioma 2
Germinoma 2
Ganglioglioma Medulloblastoma Meningioma
Other
Vascular lesions
Cavernous hemangioma 3
Ischemia/infarction 3
Cortical hemosiderosis 2
Hemorrhagic contusion 2
White matter disease
Encephalomalacia
Postoperative/postradiation white matter changes
Nonspecific white matter disease Demyelinating white matter disease
Delayed myelination
Others
Congenital hydrocephalus Arachnoid cyst
Tuberous sclerosis
Mesial temporal/hippocampal sclerosis Atrophy
Mega cisterna magna Porencephaly Subdural hematoma
No abnormality seen
2 2 3 3 2 2 2 30
view, and 18 slice locations. The acquisition time was 8:56 minutes.
The FSE images were also obtained with a TR of 2000 msec and 2 excitations. In the early phase of the study,
PDW and T2W images were obtained with pTEs of 30 and 75 msec in 24 and 10 patients, respectively. In the remain
-ing subjects, pTEs of 15 and 90 msec were used for PDW and T2W images. Matrix size was either 256 X 128 (35 patients), 256 X 192 ( 41 patients), or 256 X 256 (five
patients). Acquisition times were 2:08, 3:12, and 4:16 minutes, respectively. Slice thickness, interslice gap, and field of view were identical to those for the CSE sequences. However, because of the longer echo trains in FSE, only 14 slice locations were available using the TR of 2000 msec. FSE images were acquired in either the axial or coronal plane. Coronal images were often obtained to facilitate diagnosis or surgical planning.
The FSE images were compared with CSE images for lesion detectibility and characterization (ie, number, size, and signal behavior) by a group of three neuroradiologists in an unblinded fashion. In addition to the visual comparison of signal characteristics, signal intensities of white and gray matter, cerebrospinal fluid (CSF), and fat, as well as the
1171
background noise along the phase-encoding direction, were
measured in six selected sets of FSE and CSE images
utilizing region-of-interest (ROI) analyses by one of the
authors. For each ROI, absolute signal intensity measure -ment, which is independent of window level or width settings, was obtained from ROis containing between 1 00 and 300 pixels. The signal intensity measurements were
made from studies in which both FSE and CSE images
were obtained in the axial plane. Only the noise in the
direction of the phase-encoding gradient was measured since it is greater in magnitude than the noise in the readout direction (7) and is considered a more valid measurement when " ... assessing the impact of various techniques on image quality" (9). Contrast-to-noise ratios (CNR) were
calculated for gray matter versus white matter, CSF versus
white matter, CSF versus gray matter, and fat versus gray
matter using the equation
(A)
where S1 and S2 are the mean signal intensities of the ROis
within the two tissue types being compared and NP is the
signal intensity from an ROI along the phase-encoding
direction.
A phantom study was performed with a homogeneous
water phantom in order to demonstrate the effect of matrix
size on Gibbs artifact in FSE imaging.
Results
All the lesions detected on CSE images were seen on FSE images when pTEs of 15 and 90 msec were employed. Of the 24 patients whose FSE PDW images were obtained with pTEs of 30 msec, two findings (cystic ganglioglioma and mega cisterna magna) were inconspicuous on PDW images (although detected on the T2W images) because free water and CSF were nearly isointense to the adjacent gray matter (Fig. 2).
No additional lesions were demonstrated by FSE sequences. Measurements of the 111aximal dimensions of 10 randomly chosen lesions, rang-ing between 8 and 45 mm, revealed a strong correlation between FSE and CSE images (Fig.
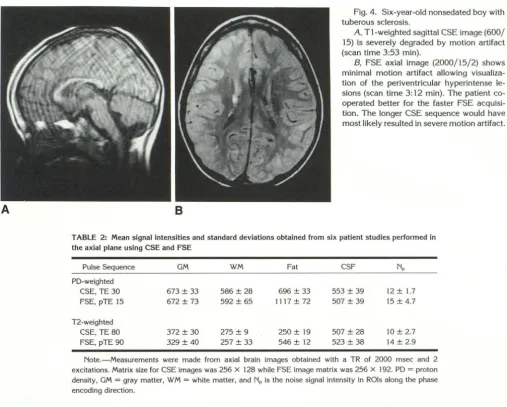
3). FSE images yielded diagnostic information in two patients whose CSE images were degraded by motion artifact. In two agitated patients, one with cavernous hemangiomata and the other with tuberous sclerosis, diagnostically useful images were obtained with only FSE images in the axial plane (Fig. 4).
The mean signal intensities reported in Table 2 compare the FSE sequence of choice (TR 2000/pTE 15, 90; 2 excitations, 256 X 192 matrix) with the standard CSE brain examination used in our series (TR 2000/TE 30, 80; 2 exci
[image:3.613.53.294.92.463.2]-1172
Fig. 2. Poor CSF /free water versus gray matter contrast in a FSE POW image using
a pTE of 30 msec; 7-year-old boy with a cystic ganglioglioma (scan time 3:12 min).
A, Axial CSE (2000/30) image
demon-strates a low-intensity mass in the right
pos-terior temporal lobe (scan time of 8:56 min). B, Axial FSE (2000/pTE 30) image
shows the lesion to be isointense and indis-tinguishable from adjacent gray matter, al-though the distinction was made on the T2W image (data not shown).
A
GO
f: E
0 Pr·olon Density
e 12-weiglrled
.
7
Q) ,, Vi
c
'2 ({) Q)
40
_ j 20
-/
/
.
.
•
/
J'
w tn
LL
_.
'"L
.
J
0
~
~
--
~
---
11
---
1
---4
0 20 ~0 60
S[ Lesion Size (rnm)
Fig. 3. CSE versus FSE correlation plot for lesion size. Open
circles are measurements on PDW images; Closed circles are
measurements on T2W images. The diagonal line closed by open
triangles represents a perfect correlation, while the two other lines
shown are linear fits for the POW and T2W data. The correlation coefficients are all above 0.99
ties for white and gray matter and CSF were comparable to those in the CSE technique on the PDW images. However, in the T2 FSE images, signal intensities from these tissues were slightly reduced compared to their CSE counterparts. Scalp fat signal was much higher with FSE on both PDW and T2W sequences than with CSE (Table 2). The CNR characteristics of FSE com-pared favorably with those of the CSE sequence, though fat versus gray matter CNRs were signif-icantly different (Table 3). Figure 5 presents ex-emplary FSE and CSE PDW and T2W images
filmed using the same window level and width to
illustrate the signal intensity behavior and the CNRs between the two techniques.
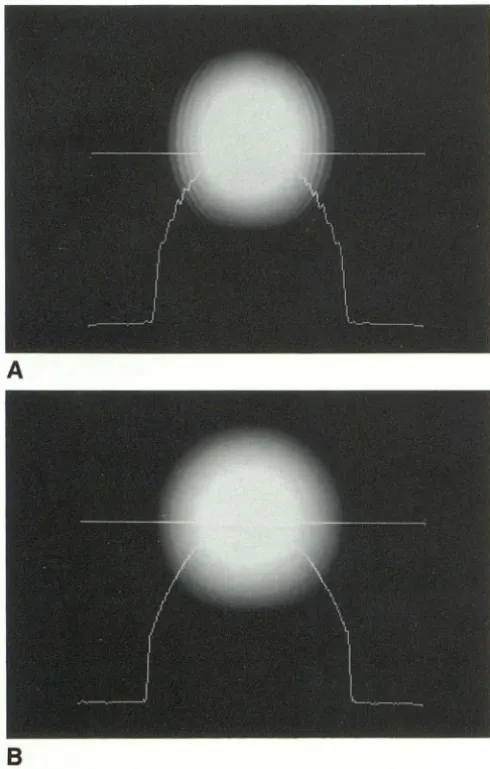
The phantom study demonstrated significant Gibbs artifact on the FSE image when 256 X 128
AJNR: 13, July/ August 1992
B
matrix was used. This artifact was reduced when matrix sizes of 256 X 192 or 256 X 256 were used (Fig. 6).
Discussion
The CSE technique has been the standard pulse sequence in neuroimaging since MR was introduced to diagnostic radiology. Newer MR pulse sequences that require shorter imaging times but retain time-tested spin-echo contrast would be desirable for clinical imaging.
FSE is a recently developed rapid MR pulse sequence that utilizes the Rapid Acquisition with Relaxation Enhancement (RARE) sequences de-scribed by Hennig and others (4-6), but modified with a specific phase encode-reordering algorithm
(7).
Our study shows that FSE images can provide rapid dual-echo long TR brain images, with image quality matching that of CSE images. Lesion conspicuity and characterization on FSE images in 51 patients with intracranial abnormalities cor-related well with the CSE sequence in our series.
[image:4.612.116.552.76.454.2] [image:4.612.236.561.79.291.2]Alter-AJNR: 13, July/ August 1992
A B
1173
Fig. 4. Six-year-old nonsedated boy with tuberous sclerosis.
A, T1-weighted sagittal CSE image (600/
15) is severely degraded by motion artifact (scan time 3:53 min).
B, FSE axial image (2000/15/2) shows
minimal motion artifact allowing visualiza
-tion of the periventricular hyperintense le -sions (scan time 3:12 min). The patient co
-operated better for the faster FSE acquisi
-tion. The longer CSE sequence would have
most likely resulted in severe motion artifact.
TABLE 2: Mean signal intensities and standard deviations obtained from six patient studies performed in the axial plane using CSE and FSE
Pulse Sequence GM WM Fat CSF NP
PO-weighted
CSE, TE 30 673 ± 33 586 ± 28 696 ± 33 553 ± 39 12 ± 1.7
FSE, pTE 15 672 ± 73 592 ± 65 1117 ± 72 507 ± 39 15 ± 4.7
T2-weighted
CSE, TE 80 372 ± 30 275 ± 9 250 ± 19 507 ± 28 10 ± 2.7
FSE, pTE 90 329 ± 40 257 ± 33 546 ± 12 523 ± 38 14 ± 2.9 Note.-Measurements were made from axial brain images obtained with a TR of 2000 msec and 2 excitations. Matrix size for CSE images was 256 X 128 while FSE image matrix was 256 X 192. PD = proton
density, GM = gray matter, WM = white matter, and NP is the noise signal intensity in ROis along the phase encoding direction.
TABLE 3: Contrast-to-noise ratios of conventional spin-echo and Fast Spine-echo images as obtained from the data in Table 2
GM-WM CSF-GM CSF-WM Fat-GM Pulse Sequence
PD-weighted
CSE, TE 30 7.3 (6.0) -10.0 (- 8.2) -2.8 (-2.3) 1.9 (1.6)
FSE, pTE 15 5.3 -11.0 - 5.7 29.7
T2-weighted
CSE, TE 80 9.7 (7.9) 13.5 (11.0) 23.2 (18.9) -12.2 (-11.4)
FSE, pTE 90 5.1 13.9 19.0 15.5
Note.- Numbers in parentheses are the CNRs anticipated if the CSE
sequences had been acquired with the same matrix size (256 X 192) as
the FSE sequences. The correction factor is (128/192)" (see Ref. 9). For abbreviations, see Table 2.
natively, one may acquire additional imaging se-quences or planes without significantly prolong-ing examination times. Nongap thin-slice imagprolong-ing of the entire brain is also possible with FSE in
less time than with CSE.
In general, FSE images obtained with pTEs of
15 and 90 msec produced tissue contrast similar
to that of the 30- and 80-msec CSE images,
respectively (Table 3). Fat tissues remain bright
on FSE T2W images as opposed to the signal
loss seen with T2W CSE images (Table 2). This
effect is believed to be due to the lengthening of
T2 that occurs with short echo spacings, leading
to decreased contributions from lipid protons to
the T2 decay process due to spin-spin splittings
(7, 1 0). Although no diagnostic problem was
encountered in our series, difficulty may arise,
for example, in differentiating extracellular met
-hemoglobin from fat Standard fat suppression
schemes can be applied to FSE and the method
even allows a novel fat-suppression method that
can be implemented without decreasing the num
-ber of slices available for each TR (11). A pTE of
30 msec tended to produce PDW images with
too much T2-weighting, resulting in unacceptably
poor contrast between CSF and gray matter with
the 2000-msec TR. This explains why two find
[image:5.617.54.562.76.483.2]gangli-1174 AJNR: 13, July/ August 1992
A B
c
Fig. 5. Comparison of FSE and CSE images; 14-year-old girl with a tecta! glioma and obstructive hydrocephalus. All the images were obtained with 5-mm slice thickness and
2 excitations and filmed with the same window width and level.
A, CSE POW image (2000/30/2, 256 X 128 matrix, scan time 8:56 min).
8, Corresponding FSE POW image (2000/15/2, 256 X 192, scan time 3:12 min).
C, CSE T2W image (2000/80, 256 X 128) obtained 2 em superior to the images A
and B.
D, Corresponding FSE T2W image (2000/pTE 90, 256 X 192). Note the bright intensity of the subcutaneous fat.
oglioma, were not visualized on FSE with a pTE of 30 msec (Fig. 2), although both pathologies were well demonstrated on the late pTE FSE images. The main disadvantage of the 15-msec pTE FSE images is increased blurring of images compared to 30-msec pTE images. The blurring effect at the shorter pTE is due to using later, more T2-attenuated, echoes to obtain high-fre-quency phase-encoding information (4, 6, 7).
The Gibbs or truncation artifact is a well-known effect causing concentric or curvilinear lines ad
-jacent to edges (12). This artifact is increased with FSE sequences and is related to T2 decay and concomitant discontinuities in the k-space trajectories encountered during a full FSE acqui-sition (7, 13). The authors preferred increasing matrix size from 256 X 128 to 256 X 192 for brain FSE imaging. This not only allowed better
D
spatial resolution but also reduced Gibbs artifact (Fig. 6). The dual-echo FSE acquisition time with a 256 X 192 matrix is roughly 1/3 the time required for the CSE sequence obtained with a 256 X 128 matrix (3:12 min vs 8:56 min).
AJNR: 13, July/August 1992
A
8
Fig. 6. Phantom study; a homogeneous water phantom was
imaged with the FSE sequence (2000/90/2) with a 256 X 128 (A) and a 256 X 192 matrix (B). The profile line at the bottom corresponds to signal intensities along the horizontal line through the center of the phantom parallel to phase-encoding axis. The Gibbs artifact is significantly reduced with a 256 X 192 matrix.
There was further reduction of the Gibbs artifact when a matrix of 256 X 256 was used (data not shown).
given TR without increased scan time. For ex-ample, if the echo train is shortened to a 12-msec spacing as opposed to a 15-msec used in this study, the number of slices increases from 14 to 18. However, the decreased echo spacing requires smaller echo-acquisition windows, with subse-quent increased bandwidth and decreased signal-to-noise ratio. Another method of obtaining more slice locations is to increase TR. A TR of 2500 msec will allow 18 slice locations with an eight-echo FSE. Even though this strategy increases the scan time by 25% over that obtained with a TR of 2000 msec, it further reduces the T1
1175
influence, which may be a desirable feature. How-ever, increased TR also results in decreased CNRs for CSF versus gray matter contrast on PDW images, which may pose a diagnostic problem.
The FSE sequence with a TR of 2500 msec was not evaluated in this study. A third method for increasing the number of slices without increasing TR is to use a six-echo FSE sequence that utilizes the first three echoes for the PDW image and the last three for the T2W image. The number of available slices in a 2000-msec TR becomes 18,
but the matrix size is restricted to 256 X 192,
and the scan time becomes 4:12 minutes (2000/ pTE 15, 80/2 excitations). We are currently
eval-uating this sequence.
The use of many closely spaced refocusing pulses can also lead to an effective lengthening of T2 that reduces magnetic-susceptibility con-tributions to signal loss (7, 14). In fact, the re-duced susceptibility effect was helpful in dem-onstrating a region of the brain distorted by a metallic artifact from dental braces, not an un-common situation in pediatric patients (Fig. 7). Reduced susceptibility effects may also result in sharper delineation of the interfaces between air and soft tissues or bone and soft tissues on FSE images, although this was not evaluated in our study. The susceptibility signal Joss associated with products of hemorrhage is reduced with FSE (Fig. 8), although not significantly (15).
The number of excitations and interslice gaps were arbitrarily chosen to be 2 and 50%, respec-tively, for FSE imaging in order to be comparable to the CSE image techniques employed at the authors' institution. These parameters can be varied in FSE sequence with similar changes in signal-to-noise ratios as in CSE sequence. Like-wise, there is no limitation in choice of TR, pTE,
slice thickness, or slice planes (including oblique) with FSE. While flow compensation techniques have been available for CSE, similar methods are not currently available for FSE. Although not a major problem at present, flow artifacts have been observed with FSE. We have not quantita-tively evaluated their contribution to image deg-radation in this study.
Increased RF power deposition is a feature of FSE. In the brain MR studies performed with the CSE, estimated specific absorption rates (SARs)
ranged from 0.01 to 0.1 W /kg. In general, the SAR values for FSE are increased by a factor of 3 to 4 as compared to CSE because of the
[image:7.618.53.298.79.464.2]1176
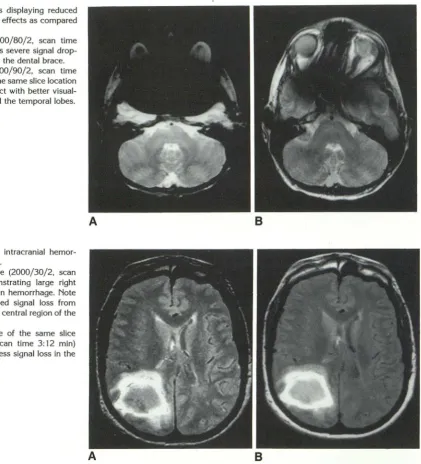
Fig. 7. FSE images displaying reduced
magnetic-susceptibility effects as compared
with CSE images.
A, CSE image (2000/80/2, scan time
8:56 min) demonstrates severe signal drop
-out and distortion from the dental brace.
8, FSE image (2000/90/2, scan time
3:12 min) acquired at the same slice location
shows much less artifact with better visual-ization of the orbits and the temporal lobes.
Fig. 8. Example of intracranial hemo
r-rhage on CSE and FSE.
A, CSE PDW image (2000/30/2, scan
time 8:56 min) demonstrating large right
parieto-occipital junction hemorrhage. Note
the susceptibility-induced signal loss from
blood byproducts in the central region of the
lesion.
8, FSE PDW image of the same slice
location (2000/15/2, scan time 3:12 min)
demonstrating slightly less signal loss in the
same region.
A
A
This implies that for the head studies reported here, SAR values were under the 0.4 W /kg limit espoused by both the United States and Great Britain and well under the 1 W /kg limit suggested by the Federal Republic of Germany (16).
In conclusion, we have demonstrated that di-agnostically reliable dual-echo long TR brain MR images can be obtained in a pediatric population using a newly developed FSE sequence in ap-proximately % to V3 of the CSE acquisition time employing comparable TR and number of exci-tations without compromising lesion detectabil-ity. Pseudo-TEs of 15 and 90 msec appear to provide PDW and T2W signal contrasts very similar to those of CSE. FSE proved helpful in
AJNR: 13, July/August 1992
B
B
reducing motion artifact, especially in marginally cooperative patients and patients of borderline age for sedation. Fat remains bright on T2W FSE images, but can be suppressed. A matrix size of 256 X 192 or larger reduces Gibbs artifact inher-ent in FSE to an acceptable level. Susceptibility effects were slightly reduced with FSE, but did not pose a diagnostic problem in our series.
References
1. Edelman RR, Kleefield J, Wentz KU, Atkinson DJ. Basic principles of
magnetic resonance imaging. In: Edelman RR, Hesselink JR, eds. Clinical magnetic resonance imaging. Philadelphia: Saunders,
1990:23-25
[image:8.615.143.564.75.539.2]AJNR: 13, July/ August 1992
AJR 1990;155:951-964
3. Cohen MS, Weisskoff RM. Ultra-fast imaging. Magn Reson Imaging
1991;9:1-37
4. Hennig J, Naureth A, Friedburg H. RARE imaging: a fast imaging method for clinical MR. Magn Reson Med 1986;3:823-833
5. Henning J, Friedburg H. Clinical applications and methodological
developments of the RARE technique. Magn Reson Imaging
1988;6:391-395
6. Mulkern RV, Wong STS, Winalski C, Jolesz FA. Contrast manipul
a-tion and artifact assessment of 2D and 3D RARE sequences. Magn
Reson Imaging 1990;8:557-566
7. Melki PS, Mulkern RV, Panych LP, Jolesz FA. Comparing the FAlSE method with conventional dual echo sequences. J Magn Reson Imaging 1991; 1:319-326
8. Twieg DB. The k-space trajectory formulation of the NMR imaging
process with applications in analysis and synthesis of imaging meth
-ods. Med Phys 1983;10:610-621
9. Kaufman L, Kramer DM, Crooks LE, Ortendahl DA. Measuring signa
l-to-noise ratios in MR imaging. Radiology 1989; 173:265-267
1177
10. Allerhand A. Analysis of Carr-Purcell spin-echo NMR experiments on
multiple-spin systems. I. The effect of homonuclear coupling. J Chern
Phys 1966;44:1-9
11. Higuchi N, Hiramatsu K, Mulkern RV. A novel "powerless" method
for fat suppression in RARE sequences. Book of Abstracts. Annual Meeting of the Society of Magnetic Resonance in Medicine, 1991. San Francisco: SMRM
12. Wood ML, Henkelman RM. Truncation artifacts in magnetic
reso-nance imaging. Magn Reson Med 1985;2:517-526
13. Mulkern RV, Melki PS, Jakab P, Higuchi N, Jolesz FA. Phase encode
order and its effect on contrast and artifact in single-shot RARE sequences. Med Phys 1991; 18:1032-1037
14. Bendel P. Spin-echo attenuation by diffusion in non-uniform field
gradients. J Magn Reson 1990;86:509-515
15. Jones KM, Mulkern RV, Mantello MT, et al. Evaluation of brain hemorrhage: comparison of Fast Spin-echo and conventional dual
spin-echo images. Radiology 1992; 182:53-58
16. Persson BR, Stahlberg F. Health and safety of clinical NMR