Spanning 5 Decades of Life
Duane D. Blatter, Erin D. Bigler, Shawn D. Gale, Sterling C. Johnson, Carol V. Anderson, Bruce M. Burnett, Natalie Parker, Shanna Kurth, and Susan D. Horn
PURPOSE: To present a normative volumetric database, spanning 5 decades of life, of cerebro-spinal fluid, subarachnoid cerebrocerebro-spinal fluid, total brain volume, total ventricular volume (com-ponent ventricular volumes of lateral, temporal horn, and third and fourth ventricles) and estimates of white and gray matter, based on a multispectral segmentation of brain MR. This database is presented as a reference for future studies comparing pathologic states. METHOD: One hundred ninety-four healthy subjects, ranging in age from 16 to 65 years, received standard axial interme-diate- and T2-weighted spin-echo MR images. Multispectral segmentation and volume analysis were performed using ANALYZE. RESULTS: Normative volumetric estimates, both uncorrected and corrected for differences in total intracranial volume, were obtained for all subjects and presented by decade and sex. Age-related cerebrospinal fluid changes were evident for both male and female subjects. Most gender differences were eliminated by correction for differences in total intracranial volume. Standard and fast spin-echo acquisition methods gave comparable volume estimates. Total brain volume measurements from MR compare favorably with data from large autopsy series. CONCLUSION: Although there may be limitations to generalizations, these nor-mative data tables can provide a comparison index for contrasting pathologic groups with a normative sample.
Index terms: Brain, magnetic resonance; Brain, volume
AJNR Am J Neuroradiol16:241–251, February 1995
Modern imaging techniques, including com-puted tomography (1– 6) and more recently magnetic resonance (MR) imaging (7–20) have provided the opportunity for noninvasive ante-mortem volumetric quantification of intracranial structures. Methods for volumetric quantifica-tion based on MR have typically used
segmen-tation based on either single-dimensional
thresholding, typically from highly T1-weighted images (7–9), or multispectral segmentation based on two or more spatially registered im-ages (10).
We report herein the results of a volumetric analysis of 194 healthy volunteers including both female and male subjects and spanning 5 decades of adult life, from 16 to 65 years. Using a multispectral segmentation algorithm, mea-surements of ventricular (including lateral, third, and fourth, as well as temporal horns), subarachnoid space, and total brain volumes are reported. We include an analysis of in-trarater and interrater reliability and a compar-ison of our observations with previous large au-topsy series (21, 22).
Methods
Subjects
One hundred ninety-four healthy volunteers (105 fe-male and 89 fe-male) from age 16 to 65 years were exam-ined. Table 3 provides the sample size and age break-down for the 5 decades studied. Volunteers were recruited by advertising in the hospital and included both employees and their families and friends. We at-tempted to recruit equal numbers of male and female
Received November 16, 1993; accepted after revision July 27, 1994. Supported by grants from the Deseret Foundation and General Electric Medical Systems.
From the Department of Radiology (D.D.B., S.D.G., B.M.B., N.P.) and the Statistical Data Center (S.D.H.), LDS Hospital, Salt Lake City, and the Department of Psychology, Brigham Young University, Provo (E.D.B., S.D.G., S.C.J., C.V.A., S.K.), Utah.
Address reprint requests to Duane D. Blatter, MD, Department of Radiology, LDS Hospital, 8th Ave and C St, Salt Lake City, UT 84103. AJNR 16:241–251, Feb 1995 0195-6108/95/1602–0241
qAmerican Society of Neuroradiology
subjects in each decade from 16 through 65 years of age. Although the volunteer group included ethnic mi-norities, the numbers in each group were too small to allow a comparative analysis.
Although there were no formal neurologic or neuropsy-chiatric examinations, all subjects answered a question-naire and were excluded if there was a history of any of the following: (a) previous head injury causing loss of con-sciousness; (b) any disease affecting the nervous system, including dementia or psychiatric illness; and (c) alcohol or drug abuse. Based on an assessment of 12 motor functions, 95% of the volunteers were considered left-hemisphere dominant. The mean educational level of the healthy population was 15.5 years, with a standard deviation of 2.7 years.
The images and subsequent analyses were performed in compliance with an institutional review board– approved protocol. All volunteers gave informed consent.
Imaging
MR images were acquired with a 1.5-T GE Signa MR scanner, operating on the 5.x software platform. The sys-tem operates with an actively shielded gradient syssys-tem with linear rise time of 0.1 mT/cm. A quadriture head coil was used. The main magnetic field (B0) is shimmed (su-perconducting and resistive shims) to 0.1 ppm over a 25-cm-diameter sphere. Routine quality control includes monitoring of B0 homogenicity, gradient linearity, and measurement of signal-to-noise ratio.
The subjects were imaged in the supine position using our routine clinical protocol. Sagittal T1-weighted (500/ 11/2 [repetition time/echo time/excitations]) images were acquired and used for location. Axial intermediate and T2-weighted (3000/31, 90/1) spin-echo images were then acquired with a section thickness of 5 mm and an in-terspace gap of 2 mm from foramen magnum to vertex. A 22-cm field of view was used with a 2563192 acquisition matrix. Flow compensation, an inferior saturation pulse, and variable bandwidth were used.
Fast spin-echo sequences became widely used after beginning this study. In order to evaluate for possible dif-ferences in volume estimates obtained with standard ver-sus fast spin-echo acquisition sequences, 15 volunteers underwent imaging with both sequences. The axial fast spin-echo images (4000/17, 104/1) were acquired during the same imaging session with identical section thickness, intersection gap, section positioning, and field of view as the standard spin-echo sequence. The echo train length was 8. A 256 3 256 acquisition matrix was used. Flow compensation was not an available option. Inferior satura-tion and variable bandwidth were used.
Volumetric Image Analysis
The axial intermediate and T2-weighted spin-echo im-ages were processed using ANALYZE (Biomedical Imag-ing Resource, Mayo Foundation, Rochester, Minn) (23) running on SPARC 10 workstations (SUN Microsystems,
Mountain View, Calif). Because ANALYZE can perform the multispectral segmentation only with 8-bit images, the original 16-bit images were converted by linear interpola-tion to 8-bit images using the load command. The images were then archived permanently onto an optical disk using a lossless compression algorithm. A multistep volume analysis was then performed using several image process-ing tools available in ANALYZE, includprocess-ing multispectral tissue segmentation, interactive image editing, and region-of-interest pixel counting. The multispectral tissue seg-mentation was performed in a manner similar to that de-scribed in a previous report (11). Regions of cerebrospinal fluid (CSF), white matter, and gray matter were defined by the user and plotted in a two-dimensional feature space in which the pixel signal intensity in the T2-weighted se-quence is represented on the x-axis, and the pixel signal intensity in the intermediate-weighted image is repre-sented on the y-axis (Fig 1). A k-nearest-neighbor multi-spectral algorithm (24, 25) was then applied to the pixels of the entire section. Because of inhomogeneity in the sensitivity of the radio frequency coil, the same feature-space map could not be successfully applied to all the images of the study, particularly the more inferior sections, in which the sensitivity of the radio frequency coil was slightly decreased. For these sections, separate feature-space maps were generated.
The classified images were edited using a manual trace tool to remove pixels representing the calvarium and ex-tracranial soft tissues. The inner table of the skull was used as the landmark for separation of intracranial versus extracra-nial compartments. All the pixels assigned to each seg-mented category (gray matter, white matter, CSF) were then summed over all of the classified, edited images from fora-men magnum to vertex. In a second editing step, subregions that included the lateral ventricles, the temporal horns of the lateral ventricles, the third ventricle, and the fourth ventricle were traced manually. Because the segmentation step of the process had already identified the interface between CSF and brain, precise tracing was not necessary as long as all of the desired CSF-containing structure was included with some surrounding brain parenchyma. The pixels assigned to CSF in these subregions were summed again.
The total brain volume was determined by summing the white and gray matter pixels and then multiplying by the voxel dimension (4.801 3 1023 cm3). Total ventricular volume was obtained by summing the measurements of the lateral ventricles and the third and fourth ventricles. The subarachnoid CSF volume was obtained by taking the difference of total CSF and total ventricle. The total intra-cranial volume (TICV) was obtained by summing the total brain and total CSF volumes. The ventricle-to-brain ratio was calculated by dividing the total ventricle volume by total brain volume and multiplying by 100.
Reliability
The images of five healthy volunteers were selected ran-domly to serve as training cases. Volumetric analysis using these cases was performed repetitively until interrater reli-ability between the neuroradiologist and expert rater could be established to exceed 0.9 for all measures, except for gray and white matter volumes. When this level of proficiency was reached, a separate randomly selected group of 15 scans was used to determine intrarater and interrater variability. These were analyzed at two separate times by the expert in order to determine the intrarater reliability. Four additional raters were then trained by the expert using the initial five training studies. Each additional rater then analyzed the sub-sequent 15 scans in order to determine the interrater reliabil-ity. To assess test-retest reliability, eight subjects were im-aged a second time on a different day.
Statistical Analysis
Descriptive statistics, including mean and standard de-viations, were calculated for each age and sex group.
Age-and sex-related effects were evaluated with Pearson cor-relations, pairedttests, and analysis of variance.
Results
Reliability
The results of the analysis of intrarater and interrater reliability are given in Table 1. Com-paring the first and second analyses performed by the expert rater, there were no statistically significant differences in any of the volume measurements based on pairedttests. With the exception of gray matter, white matter, and fourth ventricle, all correlation coefficients, as shown in Table 1, were greater than .94. Reli-able separation of gray and white matter com-partments of the total brain measurement was more difficult than any of the other
measure-Fig 1. Multispectral segmentation of
MR images. A, Intermediate- and B,
T2-weighted spin-echo images at the level of the body of the lateral ventricles. Operator-identified regions of interest are indicated: CSF, in the left atrium (blue); right perisyl-vian gray matter (yellow); and left frontal white matter (khaki).
C, Plot of two-dimensional feature space in which each pixel is plotted with the signal intensity on the T2-weighted im-age as the x-axis and the signal intensity on the intermediate-weighted image as the y-axis. The location in feature space of the pixels obtained in the user-identified re-gions are shown in their respective colors.
D,Two-dimensional feature space after
application of the k-nearest-neighbor seg-mentation algorithm demonstrates the re-gions assigned to each segmented tissue type.
E, Application of the segmentation to
[image:3.612.70.557.100.275.2]ments. The intrarater correlation coefficients for these measures were .763 and .842, respec-tively.
Intratechnique (test-retest) reliability was as-sessed by repeating MR examinations on eight subjects on different days. No statistically sig-nificant differences in any of the volume mea-surements were observed between the first and second studies.
In the determination of interrater reliability, there were no statistically significant
differ-ences, based on paired t tests, between any
volume measurements obtained by any of the raters and those obtained by the expert. Corre-lation coefficients obtained by each of the raters compared with those obtained by expert are shown in Table 1. Again, with the exception of separation between gray and white matter com-partments of the brain, a high degree of corre-lation was observed consistently for all of the volumetric measurements.
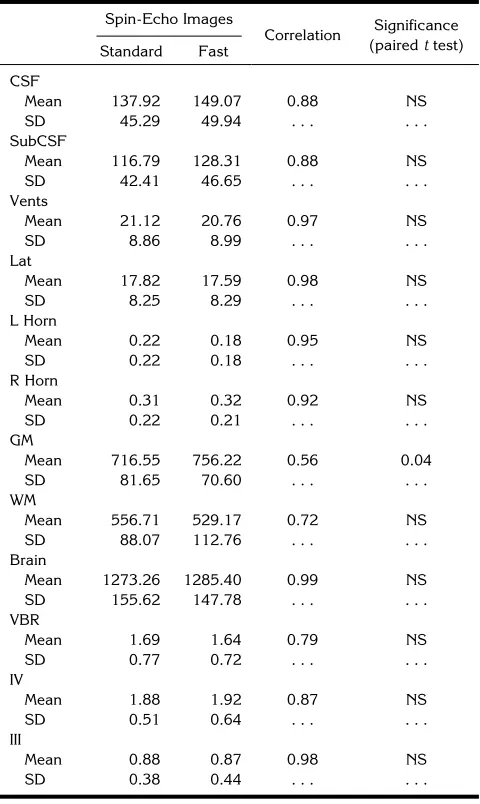
A comparison of the results of standard spin-echo with fast spin-spin-echo sequences is shown in Table 2. There were no statistically significant differences between the measurements of total brain volume or any CSF structures obtained with the two techniques. The volume of gray matter was significantly higher (717 cm3versus 756 cm3; P 5 .04) with the fast spin-echo im-ages. All of the intertechnique correlation coef-ficients were highly significant.
Volume Measurements
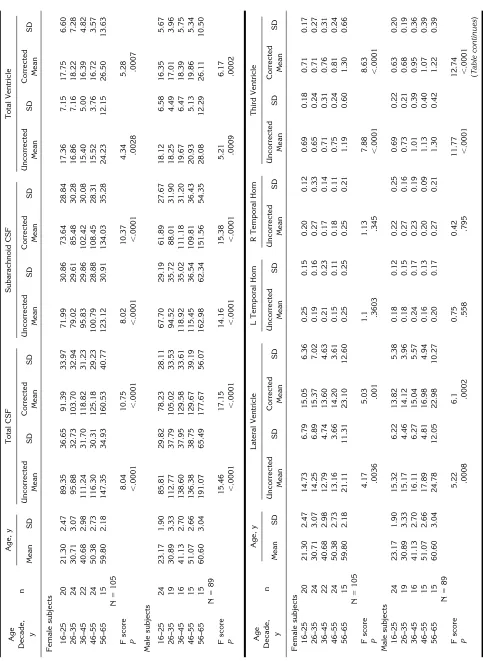
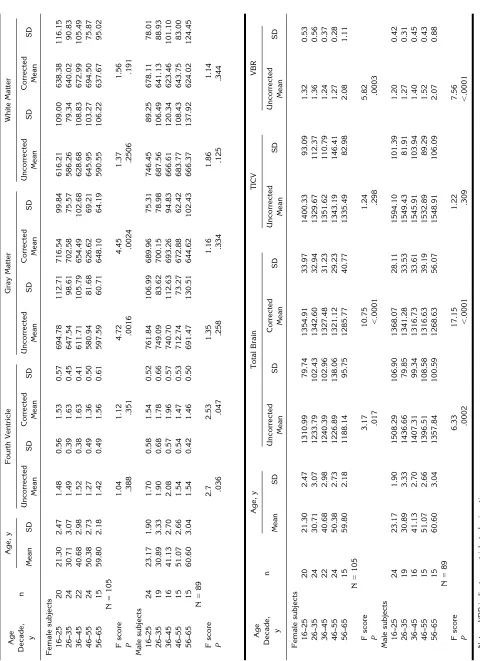
[image:4.612.59.555.115.228.2]Descriptive statistics for volume measure-ments of the selected intracranial structures are given in Table 3 by age and sex, along with an analysis of variance for each volume measure by age. In Table 4, Pearson correlations are given for each volume measure with age.
TABLE 1: Intrarater and interrater correlations of volumetric analyses in 15 randomly selected studies
CSF SubCSF Vents Lat L Horn R Horn GM WM Brain VBR IV III
Intrarater
Expert .959 .955 .994 .994 .975 .975 .763 .842 .974 .992 .859 .940
Interrater reliability with Expert
Rater 2 .963 .959 .994 .997 .974 .963 .621 .682 .976 .992 .932 .934
Rater 3 .935 .934 .985 .990 .917 .957 .545 .594 .967 .979 .849 .772
Rater 4 .938 .933 .986 .990 .959 .918 .480 .552 .946 .978 .881 .833
Rater 5 .969 .973 .990 .992 .974 .962 .715 .567 .901 .984 .950 .880
Mean rater correlations .951 .950 .989 .992 .956 .950 .590 .599 .948 .983 .903 .855
[image:4.612.315.555.296.698.2]Note.—CSF indicates cerebrospinal fluid; SubCSF, subarachnoid CSF; Vents, total ventricle; Lat, lateral ventricle; VBR, ventricle-to-brain ratio; III, third ventricle; IV, fourth ventricle; GM, gray matter; WM, white matter; L Horn, left temporal horn; and R Horn, right temporal horn.
TABLE 2: Comparison of standard and fast spin-echo images: descriptive and correlative statistics
Spin-Echo Images
Correlation Significance
(pairedttest)
Standard Fast
CSF
Mean 137.92 149.07 0.88 NS
SD 45.29 49.94 . . . .
SubCSF
Mean 116.79 128.31 0.88 NS
SD 42.41 46.65 . . . .
Vents
Mean 21.12 20.76 0.97 NS
SD 8.86 8.99 . . . .
Lat
Mean 17.82 17.59 0.98 NS
SD 8.25 8.29 . . . .
L Horn
Mean 0.22 0.18 0.95 NS
SD 0.22 0.18 . . . .
R Horn
Mean 0.31 0.32 0.92 NS
SD 0.22 0.21 . . . .
GM
Mean 716.55 756.22 0.56 0.04
SD 81.65 70.60 . . . .
WM
Mean 556.71 529.17 0.72 NS
SD 88.07 112.76 . . . .
Brain
Mean 1273.26 1285.40 0.99 NS
SD 155.62 147.78 . . . .
VBR
Mean 1.69 1.64 0.79 NS
SD 0.77 0.72 . . . .
IV
Mean 1.88 1.92 0.87 NS
SD 0.51 0.64 . . . .
III
Mean 0.88 0.87 0.98 NS
SD 0.38 0.44 . . . .
Notes.—Mean values are volumes given in cubic centimeters. NS
indicates nonsignificant at theP,.05 level; SubCSF, subarachnoid
For the female subjects, the TICV was not correlated with age (r5 2.147,P5.135). Sim-ilarly, an analysis of variance was nonsignificant (F(4, 105)51.24,P5.29). For male subjects, there was a trend toward lower TICV with in-creasing age; however, the correlation did not achieve statistical significance (r5 2.190,P 5 .074). The analysis of variance was also non-significant (F(4, 89)51.22,P 5.309).
A significant difference in the TICV was ob-served between male (1558 cm3697 cm3) and
female (1352 cm3 6 115 cm3) (t (192) 5
11.86, P , .001) subjects. For both male and
female subjects there was a statistically signifi-cant correlation between TICV and each of the other volume measures, except the volume of the temporal horns.
To correct for population variation and sex differences in head size, a correction was made based on the TICV for each of the other volumes except the temporal horns. This correction was performed by multiplying each measured vol-ume by a ratio of the mean TICV for the entire sample population (1446 cm3) divided by the observed TICV for each individual subject. Ta-ble 3 gives values for both the corrected and uncorrected volumes by decade and sex.
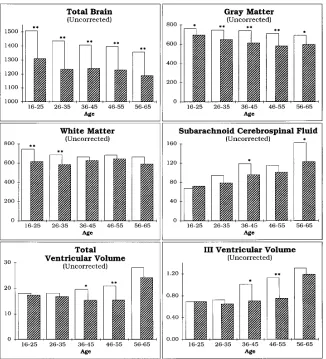
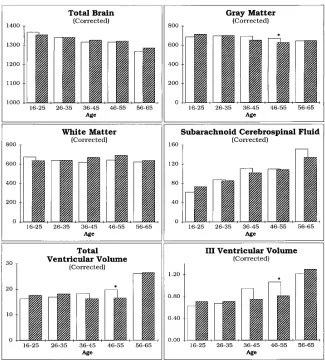
In Figure 2, bar graphs illustrate age and sex differences in uncorrected and corrected mea-surements by decade. Uncorrected measure-ments for total brain volumes for male subjects were larger than for female subjects in all age groups. After correction for TICV, there were no differences in this measure. No sex differences in either temporal horn or fourth ventricle vol-umes were observed for any of the decades studied. In the later decades studied, the uncor-rected measures showed significantly larger to-tal CSF, subarachnoid CSF, and toto-tal, lateral, and third ventricle volumes for male subjects than for females. After correction, the trend for larger CSF spaces in male than female subjects was still present; however, statistically signifi-cant differences were present only for the third ventricle and total ventricular volume in the age 46 to 55 decade.
Highly significant age-related changes are observed (Tables 3 and 4) for both male and female subjects. A decreasing total brain vol-ume and increasing subarachnoid CSF volvol-ume were the changes most highly correlated with advancing age. These changes were greater and more highly correlated with age for male than female subjects. Increases in the third and
lateral ventricle volumes were seen for both male and female subjects; again, the differences were greater and seen at an earlier age for the male subjects. The volume of the third ventricle in male subjects showed the highest correlation with age of any ventricular volume.
To assess the accuracy of the database, we compared the total brain volume obtained by analysis of the MR with autopsy reports (21, 22). The comparison is somewhat limited be-cause autopsy data report only total brain weight, and conversion to units of volumes is necessary. Despite this limitation, the compar-ison can provide a good indication of the overall accuracy of the technique.
In Table 5, the average brain weight, given by decade from the report of Ho et al (21), is com-pared with the volume measurements from the current data (average total brain volumes, com-bined for male and female subjects) (see Table 3). The weights reported in the autopsy data have been converted to volume by subtracting the reported average weight for the dura and then multiplying by 1.019, an estimate of the gravimetric density of brain based on computed tomography data (26). Excellent agreement between the autopsy and the MR volume
mea-surement is shown. Two sample t tests
per-formed for each decade show no significant dif-ferences between the autopsy and MR volume estimates.
Discussion
A variety of techniques have been reported for quantitative volumetric analysis based on brain MR. These reports have focused on a de-scription of methods and have included small numbers of healthy control subjects (7–9, 11– 14). Subsequent studies, which have success-fully applied these techniques to the study of various pathologic states, have typically com-pared the results obtained in patients with those of age-matched healthy control subjects (15– 20).
TABLE 4: Correlations between brain structures and age: uncorrected and corrected for total intracranial volume
Male subjects (n589) Female subjects (n5105) All Subjects
(n5194)
Uncorrected Corrected Uncorrected Corrected Corrected
r P r P r P r P r P
CSF .650 .000 .675 .000 .477 .000 .539 .000 .608 .000
Subarachnoid CSF .633 .000 .653 .000 .490 .000 .545 .000 .599 .000
Total ventricles .412 .000 .458 .000 .171 .081 .220 .024 .324 .000
Lateral ventricles .401 .000 .444 .000 .172 .080 .218 .026 .318 .000
L temporal horn .030 .777 . . . 2.043 .667 . . . .
R temporal horn .040 .701 . . . 2.004 .970 . . . .
Third ventricle .617 .000 .634 .000 .376 .000 .406 .000 .508 .000
Fourth ventricle 2.126 .239 2.076 .476 2.125 .204 2.081 .413 2.080 .265
Gray matter 2.257 .015 2.200 .059 2.391 .000 2.372 .000 2.294 .000
White matter 2.239 .024 2.179 .092 .050 .611 .126 .199 2.014 .850
Total brain 2.485 .000 2.675 .000 2.310 .001 2.539 .000 2.608 .000
TICV 2.190 .074 . . . 2.147 .135 . . . .
Ventricle-to-brain ratio .498 .000 . . . .248 .011 . . . .
Fig 2A. Comparison of selected intra-cranial volume estimates by age and sex. Graphs for volume data both before (A) and after (B) correction (see next page) for
differences in TICV. Eachbarindicates the
mean volume for the decade shown below. Crosshatched barsare female values; non-crosshatched barsare male values.
Aster-iskindicates a significant (P,.05)
[image:8.612.224.550.384.743.2]3 months through 30 years of age, providing data on the developing brain that is not included in the present study. Seventy-three healthy male volunteers, ages 21 to 70 years, formed the second study group. No female subjects were included in the older group.
To be broadly applicable, we have attempted to use methods that are both widely available and accepted as state-of-the-art. The method
is readily reproducible and has a well-defined interrater reliability. Nevertheless, there are significant factors that may limit the ability to generalize this data. First, we did not compare images obtained from a number of different scanners, particularly scanners of different manufacture and field strengths. Sophisticated brain phantoms, if developed, could be helpful in assessing the magnitude of possible differ-Fig 2B. Comparison of selected intra-cranial volume estimates by age and sex. Graphs for volume data both before (A) (see previous page) and after (B)
correc-tion for differences in TICV. Eachbar
indi-cates the mean volume for the decade
shown below. Crosshatched bars are
fe-male values; noncrosshatched bars are
male values. Asterisk indicates a
signifi-cant (P , .05) difference between male
[image:9.612.58.383.99.460.2]and female subjects.
TABLE 5: Comparison of brain weight by autopsy and brain volume by MR imaging
Autopsy*
Calculated Volume, cc†
MR Age, y
Average Brain Age, y Measured
Average Range Weight6SD, gm Average Range Volume6SD, cc‡
30 25–34 13496131 1342 31 26–35 13236137
40 35–44 13136151 1305 41 36–45 13116130
50 45–64 12906154 1281 51 46–55 12926151
60 55–64 13076159 1299 60 56–65 12736129
* See reference 21.
† Based on gravimetric value of 1.019 g/cm3and subtracting the reported weight of the dura matter.
[image:9.612.57.556.619.715.2]ences in measurements made using different scanners. Such phantoms could be used for both calibration of different instruments and routine quality control.
In addition, potential biases may exist in our population of healthy volunteers. The average educational level of the volunteers was 15.5 years, with a standard deviation of 2.7 years, compared to a 13.5-year average reported for the state of Utah based on the national census data (28). Although a correlation of brain size with educational level has not been reported, brain size and IQ have been shown to be corre-lated (29, 30). Although the differences are small, this may introduce a bias in these data toward larger brain size. Other potentially sig-nificant factors were not evaluated, such as pre-vious nonneurologic medical history (hyperten-sion, cardiac disease, etc). Ethnic differences were neither controlled nor analyzed in this study. These and other as yet unrecognized po-tential sources of population bias should be considered before generalizing these results to any patient population. Despite these potential sources of bias, the results obtained do corre-late well with previously reported total brain vol-umes from large autopsy studies (21, 22).
Although not a specific study of aging effects or sex-based differences, changes with age and sex differences observed in these data are con-sistent with what has been known previously. Brain weight and volume decrease with age, a trend that begins earlier and results in a larger total brain loss in men than in women. For both male and female subjects, the subarachnoid CSF volume was a strong indicator of brain loss and correlated more highly with age than any other measure. In male subjects, brain loss with aging was also reflected by ventricular expan-sion, with third ventricular volume correlating most highly. In comparison, for female subjects, increases in the volume of the lateral ventricles and third ventricle were delayed, reaching sta-tistical significance only in the age 56 to 65 decade.
Consistent with previous reports from au-topsy data (21, 22), we observed a significantly greater TICV and total brain volume for male than for female subjects in all age groups. The sex difference in total brain volume narrowed with the greater age-related brain loss in male subjects. The TICV was not significantly corre-lated with age in either male or female subjects,
a finding consistent with previous autopsy re-ports (31).
Population variation in head size has been correlated with a number of factors including body height, weight, and gender. Authors working with both autopsy (32) and MR (8, 14) data have noted that a significant reduction in the population variation of brain structure volumes can be achieved by normalizing for TICV. We observed a statistically significant correlation between TICV and all of the measured structures except the tem-poral horns. The sex difference in total brain vol-ume was eliminated when the measurements were corrected for intracranial volume. Further-more, within a given age and sex group, the stan-dard deviation of nearly all of the measurements was reduced by this correction.
In summary, the current results present a nor-mative database spanning 5 decades that pro-vides volumetric estimates of total brain and selected intracranial CSF-containing structures. This investigation demonstrates the usefulness of a rapidly automated method for segmenting images that provides an accurate volume esti-mate of selected clinically relevant neural struc-tures. The volumetric estimation can be used in a comparative fashion to determine significant deviation from normal structure values in other normative studies or in actual clinical cases.
References
1. Meese W, Kluge W, Grumme T, Hopenmuller W. CT evaluation of the
CSF spaces of healthy persons.Neuroradiology1980;19:131–136
2. Laffey PA, Peyster RG, Nathan R, Haskin ME, McGinley JA. Com-puted tomography and aging: results in a normal elderly
popula-tion.Neuroradiology1984;26:273–278
3. Kohlmeyer K, Shamena AR. CT Assessment of CSF spaces in the brain of demented and non-demented patients over 60 years of age.AJNR Am J Neuroradiol1983;4:706 –707
4. Gado M, Hughes CP, Danziger W, Chi D. Aging, dementia, and
brain atrophy: a longitudinal computed tomographic study.AJNR
Am J Neuroradiol1983;4:699 –702
5. Bird JM, Levy R, Jacoby RJ. Computed tomography in the elderly:
changes over time in a normal population.Br J Psychiatry1986;
148:80 – 85
6. Sullivan EV, Shear PK, Mathalon DH, et al. Greater abnormalities of brain cerebrospinal fluid volumes in younger than in older
patients with Alzheimer’s disease.Arch Neuro1993;50:359 –373
7. DeCarli C, Maisog J, Murphy DGM, Tiechberg D, Rapoport SI, Horwitz B. Method for quantification of brain, ventricular, and
subarachnoid CSF volumes from MR images.J Comput Assist
Tomogr1992;16:274 –284
8. Murphy DGM, DeCarli C, Schapiro MB, Rapoport SI, Horowitz B. Age-related differences in volumes of subcortical nuclei, brain matter, and cerebrospinal fluid in healthy men as measured with
9. Andreasen NC, Cizadlo T, Harris G, et al. Voxel processing tech-niques for the antemortem study of neuroanatomy using magnetic
resonance imaging.J Neuropsychiatry Clin Neurosc1993;5:121–
130
10. Vannier MW, Butterfield RL, Jordan D, Murphy WA, Levitt RG, Gado M. Technical developments and instrumentation:
multi-spectral analysis of magnetic resonance images.Radiology1985;
154:221–224
11. Cline HE, Lorensen WE, Kikinis R, Jolesz F. Three-dimensional segmentation of MR images of the head using probability and
connectivity.J Comput Assist Tomogr1990;14:1037–1045
12. Kohn MI, Tanna NK, Herman GT, et al. Analysis of brain and cerebrospinal fluid volumes with MR imaging, I: methods,
reliabil-ity, and validation.Radiology1991;178:115–122
13. Jernigan TL, Press GA, Hesselink JR. Methods for measuring brain morphologic features on magnetic resonance images:
vali-dation and normal aging.Arch Neurol1990;47:27–32
14. Jernigan TL, Archibald SL, Berhow MT, Sowell ER, Foster DS, Hesselink JR. Cerebral structure on MRI, I: localization of
age-related changes.Biol Psychiatry1991;29:59 – 67
15. Rusinek H, de Leon MJ, George AE, et al. Alzheimer disease:
measuring loss of cerebral gray matter with MR imaging.
Radiol-ogy1991;178:109 –114
16. Tanna NK, Kohn MI, Horwich DN, et al. Analysis of brain and cerebrospinal fluid volumes with MR imaging: impact on PET data
correction for atrophy, II: aging and Alzheimer dementia.
Radiol-ogy1991;178:123–130
17. Shenton ME, Kikinis R, Jolesz FA, et al. Abnormalities of the left temporal lobe and thought disorder in schizophrenia: a
quantita-tive magnetic resonance imaging study.N Engl J Med1992;327:
604 –12
18. Riess AL, Faruque F, Naidu S, et al. Neuroanatomuy of Rett
syndrome: a volumetric imaging study.Ann Neurol1993;34:227–
234
19. Peterson B, Riddle MA, Cohen DJ, et al. Reduced basal ganglia volumes in Tourette’s syndrome using three-dimensional
recon-struction techniques from magnetic resonance images.Neurology
1993;43:941–949
20. Salerno JA, Murphy DGM, Horwitz B, et al. Brain atrophy in hypertension: a volumetric magnetic resonance imaging study. Hypertension1992;20:340 –348
21. Ho K, Roessmann U, Strumfjord JV, Monroe G. Analysis of brain
weight: adult brain weight in relation to sex, race and age.Arch
Pathol Lab Med1980;104:635– 639
22. Dekaban AS, Sadowsky D. Changes in brain weight during the span of human life: relation of brain weights to body heights and
body weights.Ann Neurol1978;4:345–356
23. Robb RA. A software system for interactive and quantitative anal-ysis for biomedical images. In: Hohne KH, Fuchs H, Pizer SM, eds. 3D Imaging in Medicine, NATO ASI Series.1990;F60:333–361
24. Dudu RO, Hart PE. Pattern Classification and Scene Analysis.
New York: John Wiley & Sons, 1973
25. Clarke LP, Velthuizen RP, Phuphanich S, Schellenberg JD, Arrington JA, Silberger M. MRI: stability of three supervised
seg-mentation techniques.Magn Reson Imaging1993;11:95–106
26. Schwartz M, Creasen H, Grady CL, et al. Computed tomographic analysis of brain morphometrics in 30 healthy men, aged 21 to 81
years.Ann Neurol1985;17:146 –157
27. Pffefferbaum A, Mathalon DH, Sullivan EV, Rawles JM, Zipursky RB, Lim KO. A quantitative MRI study of changes in brain
mor-phology from infancy to late adulthood.Arch Neurol(in press)
1993
28. Nelson DE.A Utah Perspective on the National Education Goals.
Salt Lake City: Utah State Office of Education, 1993
29. Willerman L, Schultz R, Rutledge JN, Bigler ED. Brain size and
intelligence.Intelligence1991;15:223–228
30. Andreasen NC, Flaum M, Swayze II V, et al. Intelligence and brain
structure in normal individuals.Am J Psychiatry1993;150:130 –
134
31. Davis PJM, Wright EA. A new method for measuring cranial cavity volume and its application to the assessment of cerebral atrophy
at autopsy.Neuropath Appl Neurobiol1977;3:341–358
32. Hubbard BM, Anderson JM. A quantitative study of cerebral
atro-phy in old age and senile dementia.J Neurol Sci1981;50:135–