David
J
. Mikulis 1
Roland Chisin
1
Gary L. Wismer1
Richard B. Buxton 1
Alfred L. Weber2
Kenneth R
.
Davis 1
Bruce Rosen 1
Received September 23, 1987; accepted after revision May 11, 1988.
Presented at the annual meeting of the American Society of Neuroradiology, New York City, May 1987.
This work was supported in part by National Institutes of Health grant CA 40303.
1 Department of Radiology, Massachusetts Gen-eral Hospital and Harvard Medical School, Boston, MA 02114. Address reprint requests to D. J. Mik-ulis.
2 Department of Radiology, Massachusetts Eye & Ear Infirmary, Harvard Medical School, Boston, MA 02114.
AJNR 10:157-164, January/February 1989 0195-6108/89/1001-0157
© American Society of Neuroradiology
Phase-Contrast
Imaging of
the
Parotid Region
157
Standard T1- and T2-weighted spin-echo acquisitions were compared with T1- and T2-weighted phase-contrast techniques in a series of 10 consecutive patients with parotid masses to assess the role of phase-contrast methods in the evaluation of lesions in the parotid fossa. Greater tissue-lesion contrast was obtained with phase-contrast methods in nine of 10 cases, allowing improved lesion visualization; however, an increase in lesion detectability was not observed in this series. Standard MR imaging methods are sufficient for imaging the parotid region in most cases, but can be quite time-consuming.
Recommended screening of the parotid fossa that optimizes tissue-lesion contrast, lesion detectability, and imaging time is performed by combining a standard T1-weighted acquisition with a T1- or T2-weighted phase-contrast acquisition. Selection of a T1- or T2-weighted phase-contrast acquisition is determined by the T1 characteristics of the lesion.
CT
is
the established method for cross-sectional imaging of the parotid region
.
However, MR
of this area is currently under
investigation by several groups who
are employing
standard
inversion-recovery
and spin-echo pulse sequences. Early
findings
suggest
that MR
imaging is at
least equivalent and perhaps superior to
CT in detecting lesions and
in
distinguishing
parotid
masses from
adjacent
struc-tures [1-3]. Because the
parotid gland contains
a mixture of
aliphatic and water
protons
,
MR phase-contrast imaging should provide an additional advantage over
standard MR methods, as indicated in recent investigations of other lipid-
containing
tissues
such
as the liver and bone marrow [4-8]. We report our initial experience
in
comparing
standard spin-echo imaging with phase-contrast methods,
which
employed partial-saturation techniques with the MR signal read as a
"gradient
echo
"
as well as Dixon's method of chemical-shift imaging.
Phase-Contrast Imaging
A complete description of these techniques is beyond the scope of this report.
A
comprehensive
analysis can be found in the publications of Wismer et al. [7],
Dixon [9], Brady et al. [10]
, and Buxton et al. [11]. The fundamental principle on
which these methods is based consists of generating a refocused echo at a time
when the transverse magnetization vectors of aliphatic and water protons are 180
0out of
phase. When this is true, cancellation of the fat and water magnetization
vectors occurs
. The signal generated is proportional
to the
absolute value of
the
signal difference between the two populations of protons. Because most disease
processes
result
in replacement of normal parotid tissue with a predominance of
water protons, a region of high signal intenSity
representing the
lesion
will
be
superimposed
on a background
of low signal
intensity
representing normal
Chemical-Shift Imaging
The Dixon chemical-shift method uses a standard spin-echo se-quence with an alteration in the timing of the 1800 pulse with respect
to the space-encoding gradients. If V, - V2 is the resonant frequency
difference between water and lipid protons, then the earliest time (T) at which they become 1800 out of phase is
T
=
V2 (1/[V1 -v&
For a magnet operating at 0.6 T, T is 5.3 msec. The 1800
pulse is applied T/2 or 2.66 msec earlier with respect to the read gradient. As a result, the fat and water signals are 1800 out of phase during
data collection.
The signal generated in a standard spin echo, SSE, from a voxel containing both fat and water is the sum of the fat (SF) and water (Sw) signals:
With the Dixon method, lipid and water proton signals are subtracted in the phase-contrast image,
SOlxon
=
Sw - SF,where the absolute value is a result of the usual practice of using magnitude reconstructed images. The T1 and T2 relaxation effects are identical in the standard and Dixon sequences.
Gradient-Echo Imaging
In gradient-echo imaging there is no 1800 pulse to refocus the
effects of differences in resonant frequency due to chemical shift, magnetic susceptibility differences, or Bo (main magnetic field) inho-mogeneities. As a result, the phase difference between the fat and water components of the signal will change with time [12]. Tissues such as the parotid with a significant fat fraction will exhibit a cyclic pattern of signal modulation as the TE is changed and fat and water come in and out of phase at the peak of the echo (Fig. 1). For the simple case of two Lorentzian lines (representing the signal profiles obtained at resonance from fat protons, F, and water protons, W) separated by a chemical shift {) (the difference in resonant frequency between fat and water protons), the magnitude of the gradient-echo signal (SGd as a function of TE is
.jS~
+
S~+ 2SWSF cos (2
1l'voOTE) Sow(TR,T1w,a) e-TE/T'2w SoF (TR, Th, a) e-TE/T2~,where Sow and SoF are the intrinsic water and fat signal intensities that depend on the TR, the respective T1, and the pulse angle a, and
Vo is the operating frequency of the system. TE thus affects the signal in two ways: (1) decreased signal as TE increases (T2 has been replaced with T2* to indicate the additional effects of Bo i nhomogene-ities and magnetic susceptibility variations) and (2) a periodic modu-lation of the signal between Sw
+
SF and Sw - SF as the phase difference between fat and water evolves. As the field strength increases the signal varies more rapidly with changes in TE. The curve shown in Figure 1 was calculated by fitting this equation to image intensity measurements on the parotid of a normal volunteer (TR = 100 msec and four averages). From this data the fat fraction in the normal parotid parenchyma was 23%. The best-fit curve from the least-squares method yielded a T2* for water of 18 msec, a T2* for fat of 16 msec, and a chemical shift between fat and water resonance of {) = 3.44 ppm.1000
600
;g
600 ~ !l.::
OJ 400
~
..
en 200 + 00 10 20 30 40 50 60
TE (msee)
Fig. 1. -Gradient-echo signal intensity vs echo delay (TE). Signal inten-sity of parotid gland was measured in normal volunteer for various TEs, demonstrating cyclic cancellation of water and fat components by using gradient-echo method with 100-msec TR and four averages. Measured image intensities (+) for TEs between 16 and 52 msec were fit with a simple model line shape consisting of two Lorentzian lines (one for lipid and one for water), with time constants T2-weighted for water (W) and fat (F), separated by a chemical shift (~). Least-squares fitting produced the best-fit curve shown with the following parameter values: parotid fat fraction
=
23%, T2;'=
18 msec, T2~=
16 msec, and ~=
3.44 ppm.(I)
c
G)..
c
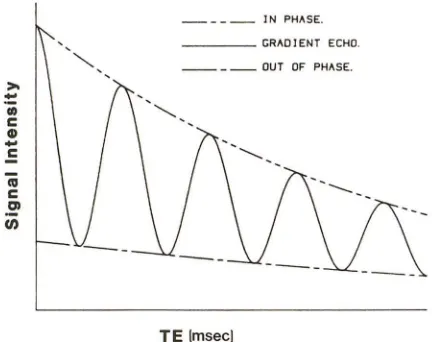
_ _ _ _ IN PHASE. _ __ _ GRADlENT ECHO.
_ _ _ _ OUT OF PHASE.
TE {msecl
Fig. 2.-Standard and phase-contrast signal intensities vs echo delay (TE). Out of phase represents Dixon spin-echo method of chemical-shift imaging, which is independent of TE. This theoretical construct indicates how gradient-echo signal varies as sinusoidal function of TE.
Figure 2 illustrates the standard spin-echo, Dixon spin-echo, and gradient-echo signal intensities as a function of TE. Imaging with either the Dixon or gradient-echo technique becomes arbitrary as long as TE is an integral multiple of time, since both methods will provide similar chemical-shift information (see Discussion).
Subjects and Methods
[image:2.612.319.562.78.254.2] [image:2.612.332.548.370.541.2]AJNR:1 D, January/February 1989 PHASE-CONTRAST IMAGING OF PAROTID 159
48,96/2-4 (TR/first-echo TE, second-echo TE/excitations); and a single-slice partial-saturation gradient-echo series with four acquisi-tions: 100/16/4 (90° flip angle), 100/30/4 (20-30° flip angle), 100/ 50/4 (20-30° flip angle), and 120/100/4 (20-30° flip angle). Altered RF pulse angles were used for the gradient-echo images to either enhance (large flip angles) or suppress (small flip angles) the T1 sensitivity of the pulse sequence [13]. Data in almost all cases were
collected on a 256 x 128 matrix. The Dixon sequence was performed
with a 2.66-msec shift of the 1800 RF pulse. Imaging times were
2.9-5.1 min for the single-slice Dixon sequence, 2.5-9.6 min for the
standard multislice T1-weighted spin-echo sequence, 8.5-21.0 min for the standard multislice T2-weighted spin-echo sequence, and
0.9-1.5 min for each single-slice gradient-echo acquisition.
An estimate of tissue-lesion contrast was performed by comparing region-of-interest signal intensity from normal parotid tissue (P), ad-jacent parotid lesion (L), and background noise (N) measured from a region of interest outside the patient (all regions of measurement
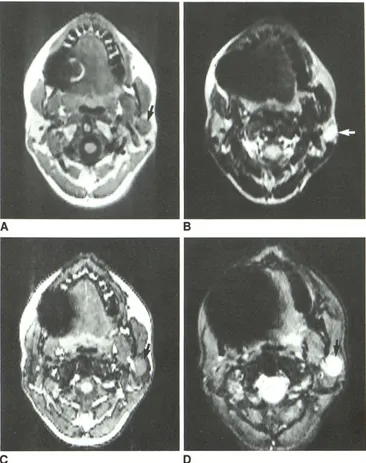
Fig. 3.-Phase cancellation in nor-mal parotid.
A, Standard T1-weighted spin-echo image, 300/25/4.
B, Dixon T1-weighted spin-echo im-age, 300/25/4. Small peri parotid lymph node (arrow) is not seen on standard sequence.
C, Standard T2-weighted spin-echo image, 2000/96/2.
D, T2-weighted gradient-echo im-age, 100/30/4.
A
c
greater than 50 voxels). Motion artifact, which in certain instances
extended through the parotid into the region outside the patient, was
included in the noise measurement. No attempt was made to scale
noise for the number of excitations. Tissue-lesion contrast (TLC) was
established as
TLC = IP - LI/N.
This represents a semiquantitative expression of tissue-lesion
con-trast since comparison is made between standard and phase-contrast
methods with similar but not identical imaging parameters such as
TR, TE, slice thickness, and number of excitations.
Results
In-phase and out-of-phase acquisitions (Fig. 3) demonstrate the typical phase cancellation that occurs in normal parotid
B
[image:3.612.199.560.283.735.2]parenchyma with T1- and T2-weighted sequences
.
A similar
reduction
in
signal occurs at interfaces between
subcuta-neous fat and those structures with a predominance of water
protons; that is
,
muscle or, more precisely, muscle fascia.
This
"
edge enhancement
"
is thought to be the result of signal
cancellation occurring between aliphatic and water protons
,
which are separated by a boundary that transects a single
voxel.
Table 1 summarizes the imaging characteristics of the 10
patients in this series. MR was positive in 10 of 10 cases and
CT was positive in eight
of
nine cases (CT was not performed
in case 3). Contrast-enhanced CT was completely normal in
one patient with a palpable mass (case 5). All
lesions
were
detected with standard T1-weighted spin-echo acquisitions,
although two lesions (cases 1 and 9) were almost isointense
relative to parotid parenchyma
.
Phase-contrast methods
de-tected nine of 10 lesions
,
but completely missed the Warthin
tumor in case 5
.
Nevertheless, superior tissue-lesion contrast
was obtained in nine of 10 patients with phase-contrast
imaging
.
Lesions in seven
of
10 patients demonstrated both
long
T1
and long T2. In six of these seven patients
,
the T2-weighted
phase-contrast acquisition provided superior tissue
-
lesion
contrast (a T2-weighted phase-contrast acquisition was not
performed in the other patient). Two patients had short T1
lesions. In both cases the T1-weighted phase-contrast
acqui-sition provided superior tissue-lesion contrast.
In view of these findings it
can be
seen that selection
of
the
phase-contrast method that will provide optimal tissue-lesion
contrast
can be predicted
from the T1
characteristics of
the
lesion
in question
.
Representative Case Reports
Case 4
This patient had a long T1/long T2 mixed tumor that was well
outlined on the standard T1-weighted spin-echo image (Fig. 4A). The
lesion was hyperintense on the standard T2-weighted spin-echo
image (Fig. 4B). The T1-weighted phase-contrast acquisition reduced
tissue-lesion contrast since the low (long T1) signal generated by the
lesion was contrasted against the low signal generated by the
phase-cancelled parotid parenchyma (Fig. 4C). The T2-weighted
phase-contrast acquisition (Fig. 4D) provided optimal tissue-lesion contrast,
confirming the generalization that lesions with long T1 demonstrate
superior contrast on T2-weighted phase-contrast acquisitions.
Allow-ing for slight differences in the plane of section, the T2-weighted
gradient-echo image was virtually identical to the T2-weighted
spin-echo image in appearance and tissue-lesion contrast (14.4 vs 13.5).
The main advantage of the T2-weighted gradient-echo image in this
instance was speed-1 vs 17 min.
Case 1
A branchial cleft cyst with short T1 and long T2 was T1 isointense and slightly T2 hyperintense relative to normal parotid parenchyma
TABLE 1: Comparison of Standard Spin-Echo and Phase-Contrast Imaging in Parotid Lesions
Tissue-Lesion Contrast" (Sequence Measured) Case
Age Gender Diagnosis CT T1 T2 Standard Spin Echo Phase Contrast
No.
T1-Weighted T2-Weighted T1-Weightedb T2-WeightedC
60 F Branchial cleft cyst
+
Short Long 0.1 7.3 13.3 9.6(300/25/4) (2000/96/2) (300/25/4) (100/30/4)
2 23 F Mixed tumor
+
Long Long 4.7 3.6 1.7 6.1(500/21/6) (2000/96/2) (300/25/4) (100/50/4)
3 46 F Sjogren disease; ND Long Long 7.8 ND 6.1 8.7
cysts (300/30/4) (300/25/4) (100/30/4)
4 36 F Mixed tumor
+
d
Long Long 3.4 13.5 3.8 14.4(400/21/6) (2000/96/4) (300/25/4) (120/100/4)
5 55 M Warthin tumor Long Short 3.0 4.5 0.0 0.0
(300/25/4) (2000/48/2) (300/25/4) (100/30/4)
6 27 F Branchial cleft cyst
+d
Short Long 3.1 2.4 9.9 2.5(300/25/4) (2000/96/2) (300/25/4) (100/30/4)
7 67 M Mucoepidermoid
+
Long Long 9.1 0.9 3.3 9.4carcinoma (300/25/4) (2000/96/2) (300/25/4) (100/30/4)
8 13 M Mixed tumor
+
Long Long 5.7 5.2 3.2 10.9(500/21/6) (2000/96/4) (300/25/4) (100/50/4)
9 56 M Warthin tumor
+
Long Long 0.6 8.2 9.2 ND(500/20/6) (2000/96/4) (300/25/6)
10 32 F Mixed tumor
+
Long Long 3.9 3.7 3.5 6.3(500/21/4) (2000/96/4) (300/25/4) (100/30/4)
ND = not done.
B Tissue-lesion contrast = IP - LI/N, where P = parotid signal intensity, L = lesion signal intensity, and N = system noise.
b Dixon technique.
C Gradient-echo technique.
[image:4.612.62.562.435.681.2]AJNR:10, January/February 1989
PHASE-CONTRAST IMAGING OF PAROTID
161
Fig. 4.-Case 4: mixed tumor. A, Standard T1-weighted spin-echo image, 400/21/6.
B, Standard T2-weighted spin-echo image, 2000/96/4.
C, Dixon T1-weighted spin-echo im -age, 300/25/4.
0, T2-weighted gradient-echo
im-age, 100/30/4. Lesion (arrows).
A
c
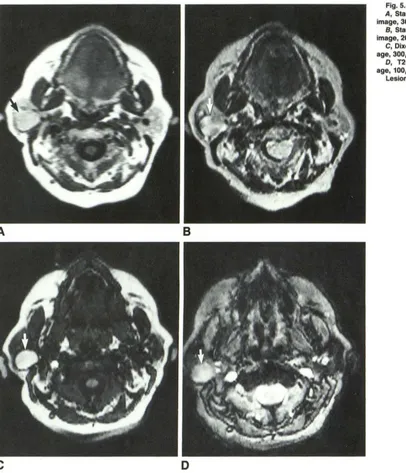
on standard T1- and T2-weighted spin-echo sequences (Figs. 5A and 58). As expected, the T1-weighted phase-contrast acquisition pro-vided superior tissue-lesion contrast (Fig. 5C). 8ecause the cyst demonstrated long T2 signal, the T2-weighted phase-contrast acqui-sition provided good tissue-lesion contrast as well (Fig. 5D).
Case 5
This patient had a Warthin tumor that was missed on
contrast-enhanced CT because of dental artifact. Standard T1- and T2-weighted spin-echo acquisitions (Figs. 6A and 68) demonstrated
rather unusual signal characteristics with long T1 and short T2. Therefore, the lesion was expected to be difficult to visualize with
phase-contrast techniques due to signal loss in the adjacent parotid
B
D
parenchyma. As predicted, the lesion was invisible on T1- and
T2-weighted phase-contrast acquisitions (Figs. 6C and 6D).
Discussion
[image:5.612.189.555.89.552.2]A
B
c
o
in seven cases, was equal to CT in six
,
and was inferior to
CT in one (due to motion artifact). Teresi et al. [2] were able
to distinguish the facial nerve in relation to parotid lesions in
nine of 16 patients in whom the nerve was not replaced by
tumor. Phase-contrast imaging techniques have been applied
to bone marrow [7] and to tumors in the body [8] with obvious
benefits in lesion detectability and characterization.
In our series
,
MR was successful in detecting all parotid
lesions and CT was normal in one patient
,
thus confirming
the clinical utility of MR imaging in the parotid region
.
Fur-thermore
,
MR phase-contrast methods offered improved
tis-sue-lesion contrast over standard acquisitions in nine of 10
cases
.
T
he single failure occurred as a result of a lesion with
Fig. 5.-Case 1: branchial cleft cyst. A, Standard T1-weighted spin-echo image, 300/25/4.
B, Standard T2-weighted spin-echo
image, 2000/96/2.
C, Dixon T1-weighted spin-echo im-age, 300/25/4.
D, T2-weighted gradient-echo im-age, 100/30/4.
Lesion (arrows).
long T1 and short T2, a rarely seen combination of relaxation
parameters that matched the phase cancellation in the
adja-cent normal parotid parenchyma, reducing tissue-lesion
con-trast to zero
.
Choosing between gradient echo and Dixon spin echo to
obtain phase-contrast information is influenced by time, line
width effects (line broadening), and scanner flexibility. The
gradient echo is faster than the spin echo, but the spin echo
offers higher signal to noise since it is not susceptible to T2
·
[image:6.615.58.464.82.555.2]appli-AJNR:10, January/February 1989
PHASE-CONTRAST IMAGING OF PAROTID
163
Fig. S.-Case 5: Warthin tumor. A, Standard T1-weighted spin-echo
image, 300/25/4.
S, Standard T2-weighted spin-echo image, 2000/48/2.
C, Dixon T1-weighted spin-echo im-age, 300/25/4.
D, T2-weighted gradient-echo im-age, 100/50/4.
Lesion (arrows).
A
c
cation of the spin-echo 180
0pulse and application of the
gradients in the gradient echo will result in echoes occurring
at a time when fat and water protons are not exactly 180
0out of phase. The gradient echo is more sensitive to
this
effect than the spin echo
,
since the phase error accumulates
over a time (T) equal to the TE
,
whereas the
time
of
accu-mulation of the phase error with the spin echo is equal to 5
.
3
msec (T =
5.3 msec at 0.6 T). Phase errors can be eliminated
with the gradient-echo method by obtaining empirical data of
signal intensity vs TE, as we did in Figure
1 to
determine
the
TEs that result in maximum signal cancellation
.
Finally
,
scan-ner characteristics may impose limitations on whether a
gra-dient echo or spin echo can be obtained with chemical-shift
B
D
information because
hardware and
software
features
mayor
may not allow the necessary pulse sequence modifications.
With regard
to
imaging parameters,
the
following values
were
found
to be most useful
:
(1)
standard and Dixon
T1-weighted spin echo,
400/20/4,
and
(2)
standard
T2-weighted
spin
echo
,
2000/48
,
96/4
.
For gradient-echo imaging,
chemi-cal-shift information
is dependent only on
TE
and is
independ-ent of
flip
angle
.
From
Figure 1, maximal chemical-shift
infor-mation
will be
present at TEs
of
18
,
29
,
and
41 msec
,
etc
.
Gradient-echo T1 and
T2 weighting
is
dependent on
both
TE
and flip
angle.
T1 weighting is
obtained
with short TEs and
large flip angles, whereas
the
opposite
is true for T2
[image:7.613.193.560.87.554.2]pro-TABLE 2: Phase-Contrast Selection Criteria for Parotid Tumors
T1 Signal of Parotid Lesion
Long Isointense Short
Phase-Contrast Acquisition
T2-weighted
T1-± T2-weighted
T1-weighted
vide the desired results at 0
.
6 T: (1) T1-weighted gradient
echo
,
100/18/4 (90
0flip angle), and (2) T2-weighted gradient
echo
,
100/29/4 (30
0flip angle).
The goals of MR imaging of the parotid fossa are (1) lesion
detection
,
(2) optimization of tissue-lesion contrast
,
and (3)
reduction of overall imaging time
.
Lesion detection is
maxi-mized through use of both standard and phase
-
contrast
techniques since the latter can discriminate lesions that are
isointense relative to normal parotid parenchyma on standard
imaging
.
Optimal tissue-lesion contrast is usually
,
but not
exclusively, obtained with phase-contrast acquisitions
.
Re-duction of imaging time is achieved through the use of
T2-weighted gradient-echo acquisitions, which can reduce T2
imaging times by approximately 90%
.
We recommend the following imaging strategy to achieve
these goals. The parotid should be screened initially with a
standard T1-weighted spin-echo sequence since lesion
de-tectability and tissue-lesion contrast are usually good. If
op-timization of tissue-lesion contrast is desired, then selection
of the phase-contrast acquisition that will provide this result
can be based on the T1 signal characteristics of the lesion as
seen on the initial T1-weighted screening acquisition,
accord-ing to Table 2
.
If the lesion demonstrates a long T1
,
then a
T2-weighted phase-contrast acquisition will optimize
tissue-lesion contrast. For short T1 tissue-lesions
,
T1
-
weighted
phase-contrast acquisitions will provide superior tissue-lesion
con-trast. If no lesion is detected on the screening sequence (i.e
.,
the lesion is isointense)
,
then a T1
-
weighted phase-contrast
acquisition should provide optimal tissue-lesion contrast.
T2-weighted phase-contrast sequences can be performed as
needed to obtain T2-weighted information in place of standard
T2
-
weighted spin-echo acquisitions
.
Our preliminary experience indicates that phase-contrast
imaging of the parotid region can optimize tissue-lesion
con-trast in the majority of parotid lesions and therefore serves
as a useful adjunct to standard spin-echo imaging.
Further-more
,
the time required to obtain T2-weighted information
can be sharply reduced with the gradient-echo method.
ACKNOWLEDGMENTS
We thank Richard Fabian and Michael Joseph for patient referral,
Darlene Flemming for technical assistance with fat and water
frac-tionation methods, and Paul Beaulieu, for patient imaging.
REFERENCES
1. Schaefer SD, Maravilla KR, Close LG, Burns DK, Merkel MA, Suss RA.
Evaluation of NMR versus CT for parotid masses: a preliminary report. Laryngoscope 1985;95: 945-950
2. Teresi LM, Lufkin RB, Wortham DG, Abemayor E, Hanafee WN. Parotid masses: MR imaging. Radiology 1987;163:405-409
3. Mandelblatt SM, Braun IF, Davis PC, Fry SM, Jacobs LH, Hoffman JC.
Parotid masses: MR imaging. Radiology 1987;163:411-414
4. Lee JKT, Heiken JP, Dixon WT. Hepatic metastases studied with MR and CT. Radiology 1985;156:423-427
5. Lee JKT, Heiken JP, Dixon WT. Detection of hepatic metastases by proton spectroscopic imaging. Radiology 1985;156:429-433
6. Stark DD, Wittenberg J, Middleton MS, Ferrucci JT Jr. Liver metastasis: detection by phase-contrast MR imaging. Radiology 1986;158:327-332 7. Wismer GL, Rosen BR, Buxton R, Stark DD, Brady TJ. Chemical shift
imaging of bone marrow: preliminary experience. AJR 1985;145: 1031-1037
8. Paling MR, Brookeman JR, Mugler JP. Tumor detection with phase-contrast imaging: an evaluation of clinical potential. Radiology 1987;162: 199-203
9. Dixon WT. Simple proton spectroscopic imaging. Radiology 1984; 153: 189-194
10. Brady TJ, Wismer GL, Buxton RB, Stark DD, Rosen BR. Magnetic reso-nance chemical shift imaging. In: Dressel HY, ed. Magnetic Resonance Annual. New York: Raven Press, 1986;55-80
11. Buxton RB, Wismer GL, Brady TF, Rosen BA. Quantitative proton chemical shift imaging. Magn Reson Med 1986;3:881-900
12. Wehrli FW, Perkins TG, Shimakawa A, Roberts F. Chemical shift-induced amplitude modulations in images obtained with gradient refocusing. Magn Reson Imaging 1987;5:157-158
[image:8.612.57.298.103.161.2]