Scott W. Atlas1 Robert I. Grossman David B. Hackney Herbert I. Goldberg Larissa T. Bilaniuk Robert A. Zimmerman
This article appears in the September/Octo-ber 1988 issue of AJNR and the November 1988 issue of AJR.
Received September 16, 1987; accepted after revision February 18, 1988.
Presented at the annual meeting of the American Society of Neuroradiology, New York City, May 1987.
1 All authors: Department of Radiology, Hospital of the University of Pennsylvania, 3400 Spruce St., Philadelphia, PA 19104. Address reprint requests to S. W. Atlas.
AJNR 9:969-974, September/October 1988 0195-6108/88/0905-0969
© American Society of Neuroradiology
969
STIR MR Im
ag
ing of the Orbit
Fifteen patients with CT-documented orbital lesions were evaluated with MR imaging at 1.5 T with both conventional spin-echo (SE) and short inversion time inversion recovery (STIR) sequences. Fat signal was reliably nulled at inversion times of approximately 120-200 msec in all cases, thereby allowing clear detection of all retrobulbar lesions and normal structures on STIR images as markedly hyperintense relative to fat. All lesions were also clearly depicted on SE images; in fact, short repetition time/short echo time SE sequences were at least as useful as STIR images for illustrating anatomic structures and mass lesions, and in a much shorter scanning time. Separation of optic nerve from perioptic subarachnoid space was clear on SE images, but often difficult or impossible on STIR images owing to the relatively high intensity of normal optic nerves on STIR images. The synergism of relaxation prolongation with STIR actually resulted in loss of information, as any ability to separate the effects of T1 from T2 on signal intensity was impossible when STIR was the sole pulse sequence.
We believe that more information is obtained with standard SE sequences than with STIR sequences, and therefore SE remains the method of choice for orbital MR imaging.
Orbital lesions have been evaluated by many investigators with spin-echo (SE) MR imaging (1-9]; and with the more recent implementation of high-resolution surface-coil techniques [10, 11], significant advances have been made in MR imaging of the orbit. The orbit is somewhat unique in neuroradiology, in that the background stroma in this area is composed mainly of fat, which has a characteristic appearance on SE images. It has been proposed that short inversion time inversion recovery (STIR) would be useful in evaluating orbital disease [12, 13], since one can selectively suppress signal from a tissue (such as fat) based on its T1 by choosing the appropriate inversion time (TI) with this inversion recovery (IR) technique [14] and thereby highlight retrobulbar lesions, the vast majority of which are mainly water-containing. Furthermore, prolongation of T1 and T2, relaxation behavior characteristic of most diseases, is synergistic with STIR. These relaxation characteristics oppose each other in their contribution to signal intensity in SE imaging [15]. We evaluated the usefulness of STIR MR in depicting orbital disease in 15 patients and compared these images with SE images in these cases.
Subjects and Methods
Fifteen patients, ranging in age from 11 weeks to 66 years, with orbital lesions documented by CT were evaluated with MR imaging on a 1.5-T system: All patients underwent both SE and STIR imaging, and images were obtained in the same plane in each patient with these techniques. SE sequences were performed with both short repetition time (TR)/short echo time (TE) sequences, 600/20/1 (TRITE/excitations), and long TR/multiecho TE sequences, 2500/20-30,80/2. STIR sequences used TRs of 800-2500 msec and Tis of 120-200 msec. The Tis were selected for the purpose of suppressing signal from fat (13). All images were displayed with magnitude reconstruction. The appearance of lesions, as well as normal retrobulbar structures, was compared by using these two techniques.
970
ATLAS ET AL. AJNR:9, September/October 1988The signal intensity (SI) within a pixel acquired with IR can be determined from the equation [15],
SI = k x N (H) (e-TE{T2)[1 - 2 (e-T1{T')
+
e-TR{T'], (1)where k = a constant expressing system gain, N(H) is the mobile proton density, and T1 and T2 are the longitudinal and transverse relaxation times, respectively. The TI at the "null point" (i.e., the value of TI for which SI equals zero for the tissue with a specific T1) is given by the equation [15],
Tlnu" = -T1 x In['h(1 + e-TR{T')]. (2)
For TR » T1 , Tlnu" is given by the approximation [13],
Tlnu" = T1 x In 2. (3)
With magnitude image reconstruction techniques (when TI is se-lected for the purpose of nulling signal from fat), tissues that have recovered longitudinal magnetization either more or less than fat will have a positive signal intensity (and fat will demonstrate very low signal). The Tlnu" for fat was determined either from approximation
from equation 2, based on a T1 of 200-250 msec for orbital fat [16] or from direct observation of fat signal peak nulling on the signal profile obtained during the pres can with changes in TI [17].
Short TR scans were acquired in 2 min 51 sec. Long TR scans were obtained in 10 min 30 sec. STIR scans were obtained in times ranging from 3 min 40 sec to 10 min 30 sec, depending on the TR.
Results
All lesions were clearly delineated by both SE and STIR techniques. Short TRITE SE images demonstrated all lesions,
as well as normal retrobulbar anatomy, clearly depicting them
A
Fig. 1.-lntraconal cavernous hemangioma. A, Coronal SE image, 600/20.
B, Coronal SE image, 2500/80. C, Coronal STIR image, 2500/140/20.
B
against a high-intensity background of retrobulbar fat (Figs.
1-3). Clear definition of perioptic CSF separate from the optic nerve was usually possible with both short TRfTE and long
TRITE scans (Figs. 1, 2, and 4). On Long TRITE images,
lesions were portrayed against the background of low-inten-sity orbital fat (Figs. 1-4). Normal extraocular muscles were only minimally hyperintense or isointense relative to fat on this sequence. On SE sequences, the well-known misregis
-tration bands of high intensity and low intensity at fat-water
interfaces [18] were noted along the frequency-encoding axis (Fig. 1). These artifacts, although often fairly prominent on SE images, were not problematic in any case.
Fat signal was consistently suppressed on STIR imaging at Tis of 120-200 msec in these 15 patients, thereby depicting all other normal retrobulbar structures as relatively hyperin-tense. Changes in TR alter signal intensities in STIR, since
Tlnu " is different if TR is not sufficiently long (equation 2).
Increased TR also increases overall signal. Varying TE also changes signal intensities somewhat, since a longer TE adds contrast on the basis of T2 differences (i.e., lesions with long T2 will have a higher signal intensity with a long TE). Relatively small changes in TI resulted in markedly different contrast relationships (Fig. 5). Therefore, on STIR images, extraocular muscles and optic nerves were markedly hyperintense relative
to fat. It was usually difficult and often virtually impossible to separate optic nerve from surrounding CSF because of the high intensity of normal optic nerve (Figs. 1-4). The high-intensity band at one edge of fat-water interfaces from chem-ical-shift misregistration [18] was eliminated when signal from fat was nulled (Fig. 1). A region of signal void was identifiable on STIR images at all fat-water interfaces (Figs. 3C, 4B, and
c
[image:2.612.57.560.453.675.2]AJNR:9, September/October 1988 STIR IMAGING OF THE ORBIT 971
Fig. 2.-lntraconal, partially thrombosed cav-ernous hemangioma.
A, Axial SE image, 600/20. B, Coronal SE image, 600/20. C, Coronal SE image, 2500/80. D, Coronal STIR image, 2500/200/25. Marked inhomogeneity in mass (1) on all se-quences is consistent with partial thrombosis of cavernous hemangioma, which deviates optic nerve medially. Note clear separation of optic nerve from peri optic CSF on short TR/TE images (A and B) but not on STIR image (D). In this case, long TR/TE image (C) does not clearly distin-guish optic nerve from peri optic CSF.
A
c
5) [19]. All lesions were markedly hyperintense relative to fat on STIR sequences (Figs. 1-4).
Intralesional heterogeneity was depicted on all SE se-quences as well as on STIR when present in any sequence (Fig. 2).
Discussion
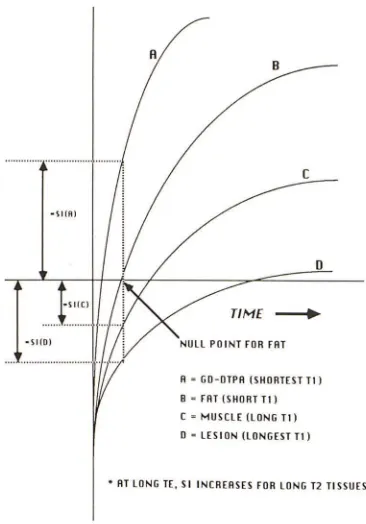
IR imaging has been applied to various areas of the body for obtaining images with high contrast, the degree of which is mainly dependent on the TI and its relationship to the T1 of the tissue of interest [14, 15]. A unique characteristic of IR sequences is the phenomenon of signal nulling. This phenom-enon is due to partial recovery of longitudinal magnetization after the initial 180· RF inverting pulse just to the "crossover"
pOint [15], so that the subsequent 90· pulse eliminates all magnetization in the transverse plane just before signal de-tection. This results in the depiction of all tissue with that particular T1 as very low signal [14, 15]. The null-pont TI
(TlnulI) is based on the T1 of the tissue from which one is
B
o
interested in nulling the signal (Fig. 6). Tlnull can be determined
from the signal-intensity equation (equation 1) for IR [15]. If
one considers situations in which TR is
»
T1 than theequation simplifies to equation 3.
Therefore, one can approximate Tlnull by multiplying 0.69
x
T1. (Note that the Tlnull will vary with applied field strength,
since T1 changes with field-strength changes.) A more accu
-rate and individualized assessment of Tlnull can also be
ob-tained by direct observation of the signal profile obob-tained from
prescanning, whereby the (major) fat peak is separable from
the water peak (due to the 3.5-ppm difference in resonant frequencies of fat and water protons) [18, 20]. By varying TI, one can visualize suppression of the fat peak, thereby obtain-ing the Tlnull for each patient individually [17]. This method of
prescanning can be performed in about 2 min. STIR
se-quences theoretically can be used to highlight all lesions
residing in a tissue with a T1 significantly different from the
T1 of those lesions simply by selecting TI to concur with the
[image:3.612.196.554.83.499.2]972
A
B
Fig. 3.-lnflammatory orbital pseudotumor.
A, Coronal SE image, 600/20.
8, Coronal SE image, 2500/80.
C, Coronal STIR image, 2500/200/20.
ATLAS ET AL. AJNR:9, September/October 1988
c
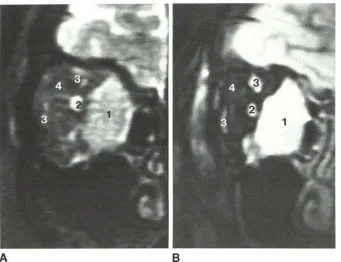
Large retrobulbar mass (1) is isointense relative to fat on long TR/long TE image (8), characteristic of benign inflammatory pseudotumor as opposed to malignant lesions. STIR image (C) depicts mass, however, as markedly hyperintense, indistinguishable from malignant lesions such as lymphoma. Also note again hyperintense optic nerve (2) and extraocular muscles (3) on STIR image (C). Boundary artifact of hypointensity is located at all fat-water interfaces on STIR image.
A
B
Fig. 4.-0rbitallymphoma.
A, Coronal SE image, 2500/80.
8, Coronal STIR image, 2500/150/20.
Large mass (1) in medial aspect of orbit is
hyperintense on both long TR/TE SE (A) and
STIR (8) sequences. Note marked contrast be-tween hyperintense optic nerve (2) and hyper-intense extraocular muscles (3) vs markedly
[image:4.612.57.558.81.333.2] [image:4.612.52.393.469.731.2]AJNR:9, September/October 1988 STIR IMAGING OF THE ORBIT 973
A
Fig. 5.-Effect on contrast of changes in TI.
A, Axial STIR image, 2500/200/20.
B, Axial STIR image, 2500/250/20.
8
Note total inversion of contrast relationships in retrobulbar structures between fat (1) and water'containing structures with 50-msec change in TI. When TI is selected so that signal from fat is nulled (A), all retrobulbar structures, including optic nerve (2) and extraocular muscles (3), are markedly hyperintense. It is impossible to separate perioptic CSF from optic nerve on this image. Also note marked hypointensity (boundary artifact) at all fat-water interfaces on both STIR sequences.
-SI(R)
-51(0)
A
B
c
o
Tli'1E
--+-A • GO-OTPA (SHOATEST TI) B • FAT (SHORT T1) C • HUSCLE (LONG T1) O· LESION (LONGEST T1)
• AT LONG TE. SI INCRERSES FOR LONG T2 TISSUES
Fig. S.-Signal intensity (Sl) vs T1 at null point for fat. Note that rate of
recovery of longitudinal magnetization (i.e., Tl), relative to TI, determines signal intensity as compared with nulled tissue (fat). In addition, as TE is increased, tissues with longer T2 will have higher signal intensity. There-fore, lesions with long Tl and long T2 will have increased intensity because of both these factors.
lesions [14]. It has been suggested that STIR might be very useful in the orbits [12, 13], since most of the retrobulbar compartment is occupied by fat, which has a T1 significantly different from the T1 of other (water-containing) orbital struc-tures and from the expected T1 of the vast majority of (water-containing) orbital lesions. Furthermore, a relatively long TE can also be selected with STIR, so that prolongation of T1 and prolongation of T2 both cause an increase in signal intensity. This synergistic effect of T1 and T2 prolongation is
opposite to the effect on signal intensity of increased T1 and T2 in SE sequences; that is, an increase in T1 reduces signal intenSity and an increase in T2 increases signal intensity on SE imaging [15]. Since the great majority of lesions exhibit long T1 and long T2, theoretically STIR would be more sensitive to subtle changes in relaxation parameters, which,
at least in theory, might not be detected easily on SE images.
Increases in spin density further augment signal intenSity in both STIR and SE imaging.
In our series, STIR sequences did indeed depict lesions with marked conspicuity against a background of very-Iow
-intenSity orbital fat (Figs. 1-4). In fact, all retrobulbar struc
-tures, including extraocular muscles and the optic nerve/ sheath complex, were markedly hyperintense on STIR im-ages. This allowed superb delineation of anatomic relation-ships behind the globe, and when comparing the long TR/ long TE SE image with the STIR image (on both images, fat is low-intensity), there was no question that STIR depicted extraocular muscles and optic nerves with greater contrast than did the long TRfTE SE images (Figs. 1-4). However,
short TRfTE SE images also allowed superb anatomic delin-eation of retrobulbar structures, differing from STIR only in that the fat background was of high rather than low intensity.
Furthermore, separation of optic nerve from the surrounding CSF was usually accomplished easily with both short and long TRfTE SE images (Figs. 1, 2, and 4). In our experience, this separation was difficult on STIR images, since the normal optic nerve is relatively hyperintense (Figs. 1-5) when fat signal is suppressed.
All lesions were markedly hyperintense on STIR sequences.
Although in theory the synergism of prolonged T1 and T2 might be beneficial for detecting subtle retrobulbar changes,
no lesion in our series seen on STIR was not detectable on short TRfTE, long TR/short TE, or long TR/long TE SE images. Other authors, however, have noted the usefulness
of STIR for documenting optic neuritis [13]. In addition, se p-aration of intrinsic relaxation behavior characteristics, attain
[image:5.612.57.555.84.229.2] [image:5.612.83.266.297.559.2]974
ATLAS ET AL. AJNR:9, September/October 1988since prolonged T1, prolonged T2, and increased spin density
all increase signal intensity on STIR. This is particularly
dis-turbing in the evaluation of orbital pseudotumor, which has been reported to demonstrate relatively characteristic signal-intensity patterns on SE images [21], probably related to the
highly fibrous nature of this entity. These lesions are usually
isointense or only minimally hyperintense relative to fat on
long TRllong TE SE images (Fig. 3), in contrast to the
ap-pearance of clinically similar but more ominous diseases, such
as retrobulbar malignancies (Fig. 4), which are usually
mark-edly hyperintense on long TRllong TE SE images [21]. STIR depicts both types of disease as markedly hyperintense, reducing any potential specificity for MR imaging in distin-guishing these lesions. Furthermore, contrast relationships that use STIR sequences are highly dependent on accurate flip angles, since errors in flip angle would alter the null point
and would dramatically change relative signal intensities.
One side benefit to suppressing signal from orbital fat is
the elimination of the high-intensity band perpendicular to the
frequency-encoding axis seen on SE images at fat-water
interfaces due to misregistration (Fig. 1) [18]. Practically speaking, however, this chemical-shift misregistration artifact is now well known to all those who interpret SE images and
is rarely a problem in diagnosis. Other, more rapid methods
have been proposed to eliminate possible confusion from this
artifact in orbital imaging [22, 23]. In fact, another artifact is
present on STIR images at fat-water interfaces, consisting of
a rim of signal void (Figs. 3C, 48, and 5). This can be ascribed
to intravoxel signal cancellation when longitudinal
magneti-zation of different materials are approximately equal in
mag-nitude but opposite in direction (i.e., they are 180· out of
phase). In this case, voxels that derive signal contributions
equally from fat and water protons (such as the situation at fat-water interfaces) have a recovered longitudinal
magneti-zation that averages to zero. This situation, in fact, is the same as if the T1 of the voxel corresponded to the null point.
This has been termed the "opposed magnetization artifact,"
which depends on the difference in T1 s between tissues rather than on relative chemical-shift differences [19].
In conclusion, STIR imaging can be performed to
success-fully suppress signal intensity from orbital fat and thereby provide high-contrast images of the orbit. These images allow excellent anatomic delineation of normal structures as well as
retrobulbar mass lesions. All lesions in our series were
de-picted as markedly hyperintense on STIR images. However,
short TRITE SE sequences were equally useful in illustrating
anatomic structures and mass lesions, and in a much shorter
scanning time. This decrease in scanning time allows
high-resolution surface-coil imaging to be performed with less
interference from motion artifacts, a frequent problem in
or-bital MR imaging. Furthermore, separation of optic nerve from
perioptic subarachnoid CSF was clear on SE images, but often difficult or impossible when STIR was the sole pulse
sequence. Although the high intensity of chemical-shift
arti-facts was virtually eliminated with STIR, these artifacts are
well known and easily recognizable on SE images. Therefore,
despite the high-contrast images of the orbit produced by
STIR, which allows excellent anatomic delineation of normal
structures and mass lesions, we believe that more information
is obtained with standard SE sequences, and therefore SE remains the method of choice for orbital MR imaging.
ACKNOWLEDGMENT
We thank Kara R. Reynolds for assistance in manuscript prepara-tion.
REFERENCES
1. Hawkes RC, Holland GN, Moore WS, Rizk S, Worthington BS, Kean M.
NMR imaging in the evaluation of orbital tumors. AJNR 1983;4:254-256
2. Edwards JH, Hyman RA, Vacirca SJ, et al. 0.6 T magnetic resonance imaging of the orbit. AJNR 1985;6:253-258
3. Daniels DL, Herfkens RJ, Gager WE, et al. MagnetiC resonance imaging
of the optic nerves and chiasm. Radiology 1984;152:79-83
4. Hans JS, Benson JE, Bonstelle CT, Alfidi RJ, Kaufman B, Levin M.
MagnetiC resonance imaging of the orbit: a preliminary experience. Ra-diology 1984;150:755-759
5. Bilaniuk LT, Schenck JF, Zimmerman RA, et al. Ocular and orbital lesions:
surface coil MR imaging. Radiology 1985;156:669-674
6. Sobel DR, Kelly WM, Kjos BO, Char 0, Brandt-Zawadzki M, Norman D.
MR imaging of orbital and ocular disease. AJNR 1985;6:259-264
7. Sullivan JA, Harms SE. Surface-coil MR imaging of orbital neoplasms.
AJNR 1986;7:29-34
8. Mafee MF, Peyman GA, Grisolano JM, et al. Malignant uveal melanoma
and simulating lesions: MR imaging evaluation. Radiology 1986;160:
773-780
9. Atlas SW, Bilaniuk L T, Zimmerman RA, Hackney DB, Goldberg HI, Gross-man RI. Orbit: initial experience with surface coil spin-echo MR imaging at
1.5 T. Radiology 1987;164:501-509
10. Schenck JF, Hart HR Jr, Foster TH, et al. Improved MR imaging of the orbit at 1.5Twith surface coils. AJNR 1985;6:193-196
11. Schenck JF, Hart HR, Foster TH, Edelstein WA, Hussain MA. High reso
-lution magnetic resonance imaging using surface coils. In: Kressel HY, ed.
Magnetic resonance annual 1986. New York: Raven, 1986:123-160
12. Smith FW, Parek HS, Forrester J, Redpath TW. MR imaging of the orbit and eye using inversion recovery sequences. Radiology 1986;161(p):286 13. Johnson G, Miller OM, MacManus 0, et al. STIR sequences in NMR
imaging of the optic nerve. Neuroradio/ogy 1987;29:238-245
14. Bydder GM, Young IR. MR imaging: clinical use of the inversion recovery
sequence. J Gomput Assist Tomogr 1985;8:585-587
15. Wehrli FW, MacFall JR, Glover GH, et al. Dependence of nuclear magnetic
resonance (NMR) image contrast on intrinsic and pulse sequence timing parameters. Radiology 1985;157:573
16. Bottomley PA. Foster TH, Arsinger RE, pfeifer LM. A review of normal
tissue hydrogen NMR relaxation times and relaxation mechanisms from 1
-100 MHz: dependence on tissue type, NMR frequency, temperature,
species, excision, and age. Med Phys 1984;11 :425-448
17. Newman R. Operator's pulse sequence data notes. Milwaukee: General
Electric, 1987
18. Babcock EE, Brateman L, Weinreb JC, Horner SO, Nunnally RL. Edge
artifacts in MR images: chemical shift effect. J Gomput Assist Tomogr
1985;9: 252-257
19. Hearshen DO, Ellis JH, Carson PL, Shreve P, Aisen AM. Boundary effects from opposed magnetization artifact in IR images. Radiology
1986; 160: 543-547
20. Dixon WT. Simple proton spectroscopic imaging. Radiology
1984;153: 189-194
21. Atlas SW, Grossman RI, Savino PJ, et al. Surface coil MR of orbital
pseudotumor. AJNR 1987;8:141-146
22. Daniels DL, Kneeland JB, Shimakawa A, et al. MR imaging of the optiC
nerve and sheath: correcting the chemical shift misregistration effect. AJNR
1986;7:249-253
23. Atlas SW, Grossman RI, Axel L, et al. Orbital lesions: proton spectroscopic