K
ith 7 figuresinted in Great Britain
ION AND WATER TRANSPORT IN LOCUST
ALIMENTARY CANAL: EVIDENCE FROM IN VIVO
ELECTROCHEMICAL GRADIENTS
BY JULIAN A. T. DOW
Department of Zoology, Downing Street, Cambridge
(Received 9 October 1980)
SUMMARY
1. Sodium occurs at a much lower electrochemical potential in all gut regions than in the blood. The observed gradients do not decrease with time; the maintenance of the high blood sodium levels therefore requires active uptake against an electrochemical gradient.
2. Potassium occurs at a much higher electrochemical potential in all gut regions than in the blood. The observed gradients do not decrease with time; the maintenance of the low blood potassium therefore requires active excre-tion against an electrochemical gradient. The highest luminal concentraexcre-tion is observed in the posterior midgut.
3. Chloride appears to be passively distributed across the gut. As with potassium, the highest luminal activity is observed in the posterior midgut. 4. Calcium and magnesium are similarly distributed. They both occur at a fairly high level in the blood, crop, caeca and anterior midgut, and at a much lower level in the rest of the gut.
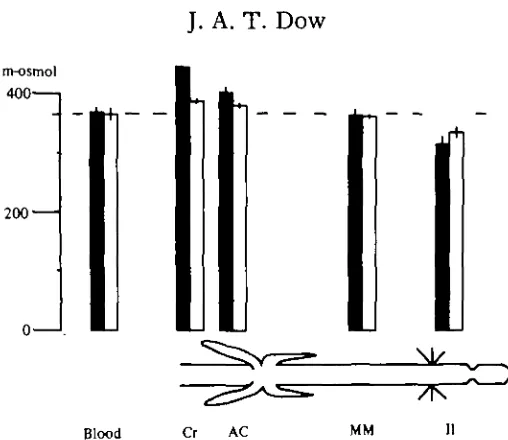
5. The crop and caecal fluids become markedly hyperosmotic to the blood in freshly-fed locusts, but the midgut fluid is isosmotic at all times. The fluid in the ileum is significantly hyposmotic; the shortfall in osmolality, compared with the fluid in the posterior midgut, corresponds to the observed drop in KC1 level.
6. The anterior caeca are the only parts of the alimentary canal to possess a lumen-negative transepithelial potential difference. They differ significantly from the other regions studied, notably the posterior caeca, in this respect.
INTRODUCTION
The water and ion transporting properties of insect midguts are poorly charac-terized, despite the clear importance of these properties for an understanding of nutrient absorption and gut function. The models of Treherne (1967) and Berridge (1970) for nutrient absorption clearly predict a functional localization of transporting ability within certain midgut regions. Although extensive data are now available on the ion-transporting properties of the midgut of Hyalophora cecropia (Harvey & Neder-gaard, 1964; Harvey & Zerahn, 1971; Wood & Harvey, 1976; Wood, Jungreis & Harvey, 1975), and some information is available on Periplaneta americana (O'Riordan,
not yet been attempted. This paper is the first in a series aiming to localize arfl characterize sites of water and ion movements in the locust midgut, and to assess their importance in the context of models of nutrient uptake.
Much information on the probable ion and water transporting abilities of an epithelium can be gained by measuring the in vivo transmembrane distributions of permeable molecules (Mauro, 1954; Harvey et al. 1975; Prusch, 1978; Giordana & Sacchi, 1978). The examination of orthopteran guts is complicated by the inter-mittent nature of the feeding process, so that it cannot be assumed that the ionic composition of the gut contents is constant, and by the diversity of gut structure, which renders it necessary to examine each gut region separately.
Before it can be asserted that a non-zero electrochemical potential difference across an epithelium is evidence for active transport, it must be shown that the tissue is permeable to the substance concerned. Fortunately, it is known that the insect midgut is permeable to ions (O'Riordan, 1969; Harvey et al. 1975; Dow, 1981a), water and nutrients (Treherne 1957, 1958, 1959). The ileum and rectum, and their cuticular linings, are also permeable to many ionic and organic species of low molecular weight (Balshin & Phillips, 1971; Maddrell & Gardiner, 1980). It follows that non-equilibrium distributions across the midgut and, to some extent, the ileum and rectum are likely to reflect active transport processes. No such transport is likely in the crop, which has been shown to be highly impermeable (Maddrell & Gardiner, 1980), even to water (de Boissezon, 1930).
It is also necessary to establish, particularly in the case of an animal that feeds intermittently, that any transepithelial gradients observed do not decrease with time. This can be established by sampling the regions under study at different times from feeding. Care must be taken not to presume that a steady non-zero electrochemical gradient across a gut section is a direct result of an active transport at that site. Although this is a reasonable hypothesis if supporting data are available, such a gradient might also result from active transport at a remote site, or from a secondary effect of active transport of another ion. However, it is reasonable to assert that a steady, non-zero electrochemical p.d. across a permeable tissue requires metabolic energy for its maintenance.
In the experiments described in this paper, in vivo measurement was undertaken of the sodium, potassium, calcium, magnesium and chloride levels in the blood and alimentary tract of the locust, the osmotic pressure of the fluids, and the in situ transmembrane potential difference across the various gut regions. Two classes of animal were used; freshly fed, and starved.
MATERIALS AND METHODS Choice of experimental animal
Locust gut gradients
I Hindgut | Midgut | Foregut I
Fig. 1. The gut regions of the locust, Schittocerca gregaria. Abbreviations: BC, buccal cavity; SD, salivary duct; Cr, crop; AC, anterior caecal lobes (6); PC, posterior caecal lobes (6); Mi, midgut: MT, Malpighian tubules (about 240); II, ileum; Co, colon; Re, rectum.
only immature adult females of 5-10 days since the last moult. Two feeding states were characterized; in one, digestion and assimilation were assumed to be near maximal, at 3 h from a standard meal. This is based on the data of Mordue (1969), who showed that Malpighian tubules are maximally active 2-4 h after feeding, and of Baines, Bernays & Leather (1973), who showed that the whole gut was filled with food material at this time. The other state, of low activity, was taken as 24 h from feeding. It is known that all solid food material is excreted from the gut within 5-6 h of feeding (Baines et al. 1973), and that longer periods of starvation can lead to pathological changes in gut structure (Khan, 1963), so this interval seemed appro-priate.
The following procedure was adopted: locusts were taken from the laboratory culture, and transferred to individual plastic mesh cages, measuring about 150 sq cm in floor area, and 10 cm in height. They were kept for 1 day without food and water at a temperature of 29 °C (day) and 20 °C (night), at ambient humidity, on a 16:8 h light:dark cycle. The animals were then presented a meal of 0-3 g fresh wheat shoots, which was usually eaten within 3 h. The few animals which failed to start to feed within 30 min were excluded from the subsequent experiments. The animals were then starved for a further 24 h, at which time they were considered adequately syn-chronized in their feeding cycle. Animals were then defined as 'fed-24 h', and used for sampling. Other animals were given a meal of 0-2 g, which was eaten completely within 30 min. The time from the onset of feeding was measured, and an animal sampled 3 h later was classed 'fed-3 h*.
Sampling procedure
Fig. 2. Schematic diagram of the apparatus used to measure chloride activity in a small drop (0-5-500 fi\) of fluid. Samples were placed on a wax sheet, and a glass Ag/AgCl micro-electrode and Ag/AgCl wire immersed in the droplet. The immersed length of micro-electrodes was not critical, provided that no significant current passed through the circuit. The bare wire was earthed to reduce instability in the measurement apparatus. The electrodes were connected to an operational amplifier of unit gain, and input impedance at least 100 times greater than that of the electrodes. The glass electrode was filled with 100 mM KC1, although this is not critical, and the wide end sealed with silicone rubber to prevent evaporation of the filling solution.
anterior caeca, posterior caeca, midgut and ileum. These regions are shown in Fig. 1. If any blood was drawn into the micropipette on contact with the gut, before the tissue was punctured, the gut was deemed to have been blotted insufficiently, and the preparation was rejected. By observing the meniscus in the tip of the pipette, it was possible to detect any blood contaminations of over 0-05 /i\. Thus any contamination would not have exceeded 3% for a typical sample size of 2 fil. Such an error is small, compared with the accuracy of subsequent assays, or with the individual variation observed.
Measurement of ionic levels
Cation concentrations were measured by emission flame photometry using a Pye SP90A spectrophotometer. Samples of 2 fi\ (or less, depending on the amount which could be obtained) were diluted immediately after collection in 2 ml of distilled water, and measured against 100 JIM standards. The interference of sodium on the potassium value was calculated.
generally obtained within 1 min, allowing the assay for all samples obtained from a locust to be made within 10 min. The electrode was calibrated before and after each set of assays with standard solutions of NaCl/NaAc by the reciprocal dilution method (Thomas, 1978). Drift was not found to be significant, and the slope was always in the range 55-60 mV per decade, and linear, over the range 1-200 raM. Control experi-ments indicated that the evaporative loss from the smallest droplets used, about 1 fi\, would produce a 1 mV error (about 3%), only after 2 min, and so such effects were not serious.
To prevent the depression of blood chloride readings through haemocyte 'capping' of microelectrode tips (Lettau et al. 1977), the blood samples were diluted 1 :i with distilled water, lysing many haemocytes through osmotic shock. The original chloride activity of the blood was then extrapolated, assuming that the blood approximated to a solution of sodium chloride. If each microlitre of blood contains 6-8000 haemocytes (Mathur & Soni, 1937; Lee, 1961), and the maximum diameter of a haemocyte is 20 /im (Hoffmann, 1969), then the blood haematocrit cannot exceed 3%, and so errors induced by haemocytes lysing, releasing chloride into solution, would be less than 3%, for haemocyte chloride values in the range 0-120 mM. Although there does not seem to be data available on haemocyte chloride, it is likely to be well within this range, and so not a significant source of error.
Measurement of osmotic pressure
Osmotic pressure was measured cryoscopically, using apparatus modified from that of Unwin & Willmer (1978). Samples were stored in glass micropipettes under paraffin for up to 5 h before use; after this interval, erratic values were obtained, particularly for blood. Samples were introduced directly into holes in a small silver disc in the osmometer, pre-cooled to well below the freezing-point of a 1 osmol solu-tion. The samples (of around o-i /A) generally froze immediately upon contact with the disc. Once the disc was loaded, the temperature of the copper block was allowed to rise. Once the samples had begun to melt, the temperature was held steady for one min, at successive intervals of 10 m-osmol. The melting point was taken as the temperature at which the last crystal in a drop melted. Calibration was against dis-tilled water and a 400 m-osmol. solution of sodium chloride; there was always one drop of each fluid present on each disc.
Measurement of transepithelial potential
Fig. 3. Experimental arrangement for the measurement of TEPs in situ. The locust was immobilized with straps of plasticine over the legs, the abdomen and thorax opened dorsally and pinned open. A wall of silicone grease was built around the abdomen, to allow the cavity to be flooded with saline. The body cavity was earthed with a bright platinum wire.
monosodium glutamate 5, valine 5 and serine 5 mM. Glucose was added at 10 mM, as an energy source, and sucrose used as an osmotic effector, to produce an osmolality of 370m-osmol. The solution was buffered to pH 6 8 - 7 0 with the addition of PIPES (Good et at. 1966) at 10 mM. The saline was known to be capable of sustaining water and ion transport rates in internally perfuaed gut sections in vitro for at least 2 h (Dow, 1981 a), and so was considered suitable. Animals so treated would live for many hours, and would often feed and move normally for at least a day upon release. The experimental arrangement described is shown in Fig. 3.
173
M/
Na Blood
B
ci
Mg
[image:7.451.111.342.43.415.2]Ca
Fig. 4. Sodium, potassium, chloride, magnesium and calcium levels, in mix, of the blood and various gut regions of the locust. The shaded bars represent data from freshly fed animals ('fed-3 h'), and the empty bars data from starved animals ('fed-24 h'). The error bars denote 1 standard error (n = 4). (Due to sampling problems, a complete range of sampling sites was not always obtained.) Abbreviations as in Fig. 1 (AM, MM, PM: anterior, middle and posterior midgut, respectively).
and at the end of the experiment, the potential null of the electrodes was measured with both in the blood, to ensure that there had been no drift.
RESULTS
Ionic levels
m-osmol 400
2 0 0
-0 '.
[image:8.451.94.348.43.263.2]Blood Cr AC MM II
Fig. 5. The osmotic concentrations, in m-osmol, of the blood and various body compartments of fed and unfed locusts. The shaded bars represent data from freshly fed animals ('fed-3 h'); the empty bars, data from starved animals (' fed-24 h'). The error bars denote 1 standard error (n = 4). Abbreviations as in Fig. 4.
20—1
0 —
-20—1
rU
Cr AC PC AM MM PM II Re
Fig. 6. The transepithelial potential, in mV, across variout regions of the gut, measured relative to the blood. The error bars denote ± 1 standard error (n = 6). (The data for the rectum is taken from Phillips (19646), and is intended for comparison.) Abbreviations as in Fig-
7l\
I i
AC PC AM MM PM II Re
Na
Cl
Mg
Ca
mV
+50
+50
[image:9.451.128.316.53.433.2]0
Fig. 7. Transepithelial electrochemical potential differences, in mV (blood relative to lumen), for sodium, potassium, chloride, magnesium and calcium. The shaded bars represent data from freshly fed animals ('fed-3 h'); the empty bars, data from starved animals ('fed-24 h'). The error ban denote 1 standard error (n = 4). Abbreviations as in Fig. 4.
posterior lobes of the caeca; the possible significance of this difference will be dis-cussed later. When studying the distribution of ions across a membrane, it is essential to calculate the electrochemical potential difference across the membrane. This value represents the work done in moving a unit quantity of a particular charged particle from one side of the membrane to the other. Thus, if the luminal electrochemical potential is lower than that in the blood, we can conclude that work must be done to effect a net transport of a species from the lumen to the blood-side, as passive move-ment is always from a point of higher potential to one at a lower potential (Moore, 1972). The electrochemical potential difference at a point B, relative to a point A, is given by
Present paper (results) Duchateau & Florkin (1953) Treheme (I9S9) Phillips
(1964 a, b) Bernays &
Chapman (1974) Samaranayaka
(i97S)
J. A. T. Dow,
B. L. Gupta & T. A. Hall
Adult (5-10 day) females Schistocerca gregaria Nymphs Schistocerca gregaria Adult females Schistocerca gregaria
Adult (4 week) males Schistocerca gregaria Nymphs Locusta migratoria Adults Schistocerca gregaria
Adult (5-10 day) females Schistocerca gregaria (In preparation.) 81 108 55 9 0 60-99 IO 120 5 11 115 5 11 98 7-10 69-98
Table 1. Locust blood composition; sodium, potassium, chloride, magnesium
and calcium levels, in JMM, and osmotic pressure, in m-osmol
Source Description Na/mM K/mM Cl/mM Mg/mM Ca/mM O.P./m-osmol
10 10 350
35 18 410 410 9 35° 420 15-30 10
where aA is the activity of an ion at point A, aB is the activity at point B, (iA is the standard state chemical potential for the ionic species at point A, /iB° is the standard state chemical potential for the ionic 9pecies at point B, z is the ionic charge, <t>A is the Galvani potential at point A, and 0B is the Galvani potential at point B.
In biological systems, it is widely assumed that the two standard-state chemical potentials are the same, and that the difference between the two Galvani potentials reflects the difference in electrical potential measured across an epithelium. Thus the equation reduces to
XjiBA = RT In (aB/aA) + zFEBA,
where EBA is the electrical potential of point B, relative to point A. It is further assumed here that the activity coefficients of an ionic species on either side of the gut are the same, and so concentrations may be used, instead of activities. The trans-epithelial potential difference represents the minimum amount of work required to transfer one mole of a species from point A to B. For biological systems, it is con-ventional to express this quantity in millivolts, rather than joules per mole (equivalent to dividing the equation above by zF). The values calculated for each ion are shown in Fig. 7.
DISCUSSION
pluring starvation. It thus seems that sodium concentration varies widely in locust blood. In contrast, potassium (5-10 HIM) and chloride (100-120 HIM) are found at similar levels by many workers. There are few comparative data available for calcium and magnesium, but values for concentration of 10-20 mM seem reasonable, although of course their activities may be much lower.
The relatively high blood concentration of sodium must be actively maintained (except in the impermeable crop), as there is an adverse electrochemical gradient across the length of the gut, and this gradient is maintained, or even increased, during the 21 h between observations.
The relatively low blood concentration of potassium must also be actively main-tained, as the electrochemical gradient throughout the gut tends to drive this rela-tively permeable cation into the blood, and yet these gradients are maintained, or even increased, during the 21 h between observations. The only exception to this is observed in the anterior caeca, for which the TEECP (trans-epithelial electrochemical potential difference) does not differ significantly from zero. The possibility that a water uptake from the anterior caeca is partly driven by a passive equilibration of the high potassium levels observed in gut fluid, will be discussed in more detail in a subsequent paper (Dow, 1981a).
The distributions of calcium and magnesium are similar to each other: the electro-chemical potential in the anterior caeca is positive, or near zero, whereas that in the posterior lobes, anterior and middle midgut is substantially negative. The TEECPs in the posterior midgut are very close to zero, and become slightly positive in the ileum. There are no data available for starved animals, and so it is not possible to determine the stability of these gradients with time. The electrochemical potential difference for chloride is more or less constant throughout the gut, and does not appear to differ very much from zero.
The only midgut region with a hyperosmotic lumen in vivo is the gastric caecum. In these experiments, insufficient fluid was collected from the posterior lobes of the caeca to measure the osmotic pressure, so it was not possible to decide whether the two regions differ in this respect, as they do in transepithelial potential, and gross morphology (Bernays, 1980). As the caecal osmotic pressure is intermediate between that of the crop contents and the blood, it is quite possible that hyperosmotic fluid passing back from the crop is equilibrated within the caeca, so that the fluid reaching the midgut is isosmotic. A tissue which allows a passive uptake of sugars and amino-acids, as suggested by Treherne (1958, 1959), would have to be very permeable indeed, and so an active maintenance of an osmotic gradient in the caeca would require a prohibitively high expenditure of energy. The lumen of the ileum is significantly hyposmotic. As the possible fluids from which this solution could be derived are all iso- or hyper-osmotic (midgut fluid, Malpighian tubule secretion, or rectal fluid), this supports the suggestion of Maddrell & Gardiner (1980) that the ileum is a site of active resorption of solutes. From these data, it seems as if the osmotic deficit of ileum fluid, relative to the midgut fluid, could be achieved through resorption of potassium chloride, although the changes observed are small.
of body fluid sampling allows us to examine indirectly the counterflow model nutrient and water uptake (Berridge, 1970). This suggests that fluid secreted in the posterior midgut moves forward, through a matrix of solid food, sweeping digested nutrients into a specialized site of uptake in the anterior midgut, perhaps the midgut caeca. The principal prediction of this model is that there will exist a standing gradient of solutes along the midgut. At the anterior end of the midgut, the fluid will resemble crop fluid, rich in nutrients, with elevated levels of those solutes which do not permeate through the caeca. Further down the midgut, the fluid will increasingly resemble that of the posterior midgut, rich in potassium and chloride, and low in calcium, magnesium, sodium and nutrients. In particular, 'marker' solutes, which are present in crop fluid, but not in the posterior midgut fluid, will be retained at the front of the midgut, and will not occur further back. From the present data, it seems as if chloride, calcium and magnesium are such markers, occurring at a high level in the crop, caeca and anterior midgut, and a lower level in the posterior midgut. This is also the case with the brown phenolic compounds noted in crop fluid (Treherne, 1957); the colouring of fluid along the midgut becomes progressively paler, until at the junction of the midgut and ileum, it is almost colourless. This will be considered further in a subsequent paper (Dow, 19816).
This work was supported by an SRC research grant. I would like to thank Miss G. L. Lloyd and Mr B. A. Trimmer for their helpful discussions, Dr B. L. Gupta and Dr T. A. Hall for assistance with biological microprobe analyses, and Dr S. H. P. Maddrell, Dr J. H. Spring and Professor J. E. Phillips for reading the drafts of the manuscript. I would like to thank Dr Roger Thomas for his expert tuition at an EMBO course on ion-sensitive micro-electrodes.
REFERENCES
DE BoiSSEON, P. (1930). Histophyaiology of Culex gut. Arch. Zool. 70, 281-431.
BAINES, D. M., BERNAYS, E. A. & LEATHER, E. M. (1973). Movement of food through the gut of fifth instar males of Loctuta migratoria migratorioida (R. & F.). Acrida a, 310-332.
BALSHIN, M. & PHILLIPS, J. E. (1971). Active absorption of amino-acids in the rectum of the desert locust, Schiitocerca gregaria. Nature New Biology 333, 53-55.
BERNAYS, E. A. (1980). A specialised region of the gastric caeca in the locust, Schiitocerca gregaria.
Pkytiol. Ent. 6, 1-6.
BERNAYS, E. A. & CHAPMAN, R. F. (1974). Changes in haemolymph osmotic pressure in Locusta
migratoria L. larvae in relation to feeding. J. Entomol. (A) 48, 149-155.
BERRIDCE, M. J. (1970). A structural analysis of intestinal absorption. Symp. Roy. Ent. toe. Land. 5,
i35-i5°-DAVEY, P. M. (1954). Quantities of food eaten by the Desert locust, Schistocerca gregaria (Forsk.), in relation to growth. Bull. Ent. Res. 45, 530-551.
Dow, J. A. T. (1981a). Localisation and characterisation of water uptake from the midgut of the locust, Schistocerca gregaria. 93, 269-281.
Dow, J. A. T. (19816). Countercurrent flows, water movements and nutrient absorption in locust midgut. J. Insect Physiol. (In the Press.)
DUCHATEAU, G. & FLORKIN, M. (1953). A survey of aminoacidemias with special reference to the high concentration of free amino acids in insect haemolymph. Arch. Int. Physiol. 66, 573-591.
GIORDANA, B. & SACCHI, F. (1978). Cellular ionic concentrations in the midgut of two larval lepidoptera
in vivo and in vitro. Comp. Biochem. Physiol. 59A, 17-20.
GOOD, N. E. et al. (1966). Hydrogen ion buffers for biological research. Biochemistry 5, 467-477. HARVEY, W. R. & NEDEROAARD, S. (1964). Sodium-independent active transport of potassium in thjg
•ARVEY, W. R., WOOD, J. L., QUATRALE, R. P. & JUNCREIS, A. M. (1975). Cation distributions across the larval and pupal midgut of the lepidopteran Hyaiophora eecropia, invivo.J. exp. Biol. 63, 321-330. HARVEY, W. R. & ZERAHN, K. (1971). Active transport of sodium by the isolated midgut of Hyaiophora
eecropia. J. exp. Biol. 54, 269-274.
HOFFMAN, J. A. (1969). Etude de la recuperation himocytaire apres hemorragies experimentales chez l'orthoptere, Locutta migratoria. J. Insect Pkyriol. 15, 1375-1384.
KHAN, M. A. (1963). Histological changes related to the secretion of digestive enrymes in the midgut and caeca of Locusta migratoria. Proc. R. ent. Soc. Land. (A) 39, 118-124.
LEE, R. M. (1961). The variation of blood volume with age in the desert locust, Schittocerca gregaria Forsk. J. Insect Physiol. 6, 36-31.
LETTAU, J., FOSTER, W. A., HARKER, J. E. & TREHERNE, J. E. (1977). Diel changes in potassium activity in the haemolymph of the cockroach Leucophaea maderae. J. exp. Biol. 71, 171—186.
MADDRELL, S. H. P. & GARDINER, B. O. C. (1980). The permeability of the cuticular lining of the insect alimentary canal. J. exp. Biol. 85, 227-239.
MATHUR, C. B. & SONI, B. N. (1937). Studies on Schistocerca gregaria Forskal. IX. Indian J. Agr. Sci. 7. 317-325.
MAURO, A. (1954). Electrochemical potential difference of chloride ion in the giant squid axon-sea water system. Fedn. Proc. Fedn. Socs. exp. Biol. 13, 96.
MOORE, D . F. (1972). Physical chemistry. Fifth ed. London: Longman Press.
MORDUE, A. J. & HILL, L. (1970). The utilisation of food by the adult female desert locust, Schistocerca
gregaria. Ent. Exp. Appl. 13, 352-358.
MORDUE, W. (1969). Hormonal control of Malpighian tubule and rectal function in the desert locust,
Schistocerca gregaria. J. Insect Physiol. 15, 273-285.
O'RIORDAN, A. M. (1969). Electrolyte movement in the isolated midgut of the cockroach, Periplaneta
americana. J. exp. Biol. 51, 699-714.
PHILLIPS, J. E. (1964a). Rectal absorption in the desert locust Schistocerca gregaria Forskal. I. Water. J. exp. Biol. 41, 15-38.
PHILLIPS, J. E. (19646). Rectal absorption in the desert locust Schistocerca gregaria Forskal. II. Sodium, potassium and chloride. J. exp. Biol. 41, 39-67.
PRUSCH, R. D . (1978). Active N a+ uptake in the isolated midgut of larval Sarcophaga bullata. J. Insect
Physiol. 34, 81-85.
SAMARANAYAKA, A. U. M. D. (1975). Effect of insecticides on Schistocerca gregaria. Ph.D. thesis, Cambridge University.
THOMAS, R. C. (1978). Ion-sensitive intracellular microelectrodei. London: Academic Press. TRBHERNE, J. (1957). The absorption of glucose from the alimentary tract of the locust, Schistocerca
gregaria Forsk. J. exp. Biol. 35, 297-306.
TRKHBRNE, J. (1958). The absorption and metabolism of some sugars in the locust, Schistocerca gregaria Forsk. J. exp. Biol. 35, 611-625.
TREHraNEi J- (i959). Amino acid absorption in the locust, Schistocerca gregaria Forsk. J'. exp. Biol. 36,
553-545-TREHERNE, J. (1967). Gut absorption. Am. Rev. Ent. 13, 45-58.
UNWIN, D . M. & WILLMER, P. G. (1978). A simple field cryoscope-osmometer for freezing-point determination with small fluid samples. Physiol. Ent. 3, 341-345.
WOOD, J. L. & HARVEY, W. R. (1976). Active transport of calcium across the isolated midgut of
Hyalophora eecropia. J. exp. Biol. 65, 347-360.