Developing a framework of inventory management
practices for the logistics centralization plan of five
departments in UMC St. Radboud
Master Thesis
Business Administration
Track: International Management
School of Management and Governance University of Twente
P.O. Box 217 7500 AE Enschede The Netherlands
Author: Ileana Pinto
Supervisory committee:
Dr. Peter Schuur, University of Twente Ir. Henk Kroon, University of Twente MSc. Justin Bitter, RUNMC
Preface
Graduating from my master program in The Netherlands means a very rich experience for me. It is the achievement of one of my main goals with one extra ingredient. It is that I obtained it in a foreign country with a so different culture. I feel that I am not only graduating from my master program but also from an important part of life. So many situations overcame thanks in grand part to the support of many beautiful people that appeared on my way.
In one side my supervisors. My first supervisor Peter Schuur appeared in the moment I needed to get a master project. Since the very first instant we had a great connection, we started to build not only a student and professor relationship, but also a friendship in which Peter played a very important role during my life in the University. His relaxed, open and great personality drove us to have long conversations and unique times. Thank you for enriching my Dutch life and making my stay in the Netherlands more memorable.
I want to thank also my second supervisor, Mr. Henk Kroon, that even when we worked for little time together, I could understand why he and Peter are not only good colleagues, but also good friends. Thank you for being willing to mentor me in the last moment I was asking for S.O.S.!
Of course I cannot forget my supervisors from Radboud Hospital, where I performed my master project: Justin Bitter and Jan Vink. Thank you for giving me the chance to make my master assignment at Radboud hospital. It was a great, enriching and interesting experience. It helped me not only to reach the end of my program but also to get more involved with the Netherland culture. I met nice persons that I always will keep in my heart and memories, including you both.
In the other side, my friends, with an amazing range of nationalities: Olga from Russia, Alex from Indonesia, Tristan and Lionel from France, Daniela from Portugal, Majid from Iran, Chie Chie and Yuchuan from Taiwan, Kelvin from Netherlands, Chie May from Curacao, Juliana from Germany. I was blessed with their friendship and support in the very right moments, and of course we spent so beautiful and fun moments together that I will never forget, particularly in the kitchen of Matenweg 73. And my Salvadoran friends that were online cheering me all the time: Roberto, Noris and Claudia.
I dedicate the happiness of meeting this important goal especially to my parents and family. I know that I always count with their unconditional love and support. But over everything, I am thankful with God, because he allowed me to be finally in this point in my life, after spending so much time just imagining it in my small in size but big in heart country, El Salvador.
Management Summary
Inventory management nowadays is becoming an important part of the operational areas in the world of companies. The reason is that a good inventory management can bring to the company an increase in operational and cost efficiency.
In this thesis we focus our attention on improving the inventory management of five departments at Radboud hospital. These departments are involved in a new project that consists in centralizing their inventory management. The main objective of this research is to define a framework of inventory practices as well as to identify an inventory control system for the new centralized situation that improves cost-efficiency without compromising the health of patients.
To address our study we first examine literature and guided by that, we perform a series of pilot experiments.
When managing inventory the theory suggests that a continuous review system is advantageous in the sense that it helps to keep a closer and tighter control of items, since a continuous track of movements is performed. Furthermore this system requires lower safety stocks which results in less cost. Conversely a periodic review system is more advantageous in detecting problems like spoilage and theft, since it is more effective in tracking real quantities. Moreover, in this kind of system many orders are placed at the same time, which can be beneficial for the company regarding the efficiency on labor force when ordering, unpacking and placing the new replenishments.
The experiments executed in this research consist on applying the continuous review system and the periodic review system and comparing results with the current situation on inventory management at the five departments. We based our results and comparisons on the parameters that involve each of the systems and on some Key Performance Indicators. The systems’ parameters are: the expected demand during replenishment cycle, the standard deviation of the demand during replenishment cycle, the safety stock, the reorder point for the continuous review approach and the order-up-to-level for the periodic approach. The KPIs are: the customer service level, and the holding costs. In fact, we compare various target customer service levels on the basis of their associated holding costs. The holding costs –also called carrying costs- include aspects related to housing, material handling, labor used on receiving and warehousing inventories, investment, and spoilage and obsolescence. Our experiments confirm to some level the advantages of the continuous review system.
Summary of results from analysis of first study
Here we found that, when comparing the holding costs of the three approaches, basically the continuous approach at the 95% customer service level is giving the best results.
The second pilot study was executed to compare a decentralized and a centralized situation, also applying the continuous and periodic review systems. In this study we always could observe that a continuous review approach gives the best results on each of the key performance indicators. In other words, we obtained more advantageous carrying costs at higher target service levels. Furthermore, when trying to compare a separate situation with a joint situation, we found the results of the following table:
From the figures presented we clearly observe the benefits of a centralized situation on inventory control management. First we can see how risk pooling reduces the safety stock with 12.5% at the 0.99 service level and with 17% at the 0.95 service level. And the carrying costs are affected by a reduction of 34% and 40% respectively.
Therefore, these experiments suggest that the choice of best option for the new centralized inventory management of the five departments involved in this project at Radboud hospital, is applying a continuous review system with a fixed reorder quantity each time that the inventory position reaches a certain level. This certain inventory level is determined by the target service level that the hospital or the logistics manager wants to achieve. Based upon our experiments savings would range from approximately 30% to 40% in holding costs. Here, we have to take into account that holding costs include savings in various respects such as labor force, material handling, storage space, spoilage, and further. The execution of risk pooling when joining the inventory management of all the five departments will lead to further cost savings for the hospital.
We have to add that this continuous review system is more feasible in practice when it is handled by a computerized system. In this case, the logistics manager of these five departments at Radboud expects to computerize the entire inventory management about the end of 2011 or beginning of 2012. A system of bar codes will be placed. However, in the new computerized system, the logistics manager has to take into account that a big effort should be done to introduce all the complete data, since no proper data at the beginning of the entire process can result in no proper data for appropriate management purposes.
Furthermore, we believe that a combination of the continuous review and the periodic review systems can be performed. Mainly using a continuous review system for monitoring of movement purposes. And executing periodic reviews –in which the logistics manager is free to choose the review period- for avoiding problems such as the ones previously expressed, these are spoilage and theft –of which there is always a certain probability-.
To make the above concrete, we recommend the following steps:
1. Standardize and update the various operation protocols 2. Use uniform terminology for the various inventory resources 3. Complete the introduction of the barcode system
4. Computerize the administration of the inventory
5. Keep track of the usage of all materials in the new data-system
Contents
Management Summary ... 1
1. Introduction ... 7
1.1. Background ... 7
1.2. Objective ... 7
1.3. Research question ... 8
1.3.1. Sub-questions ... 8
1.4. Research Strategy ... 8
2. Methodology ... 10
3. Literature Review ... 11
3.1. Health Care Supply Chain ... 11
3.2. Inventory Management ... 12
3.2.1. Classification Systems ... 13
3.2.2. Inventory Accounting Systems ... 13
3.2.3. Inventory Policies ... 14
3.2.4. Cost and Service Objective. Determining the Safety Stock ... 15
4. Building up the Research Framework ... 16
4.1. Inventory control systems to be applied in this research ... 16
4.2. Choosing an appropriate Inventory Control System. The Key Performance Indicators (KPIs) ... 18
4.3. Summarizing the parameters of our research ... 19
5. Current Inventory Practices at Radboud ... 21
5.1. Current organization ... 21
5.2. Current supply process ... 22
5.3. Current shared logistics practices ... 23
6. Current Problems and Consequences ... 25
6.1. Problems ... 25
6.3. Limitations ... 26
7. Options for a joint Inventory policy for all five departments. Analysis of data 28 Our study at Radboud ... 28
7.1. First sample: The Sectio Tray ... 29
7.1.1. Analysis of data ... 30
7.2. Second Sample: The Universeelset XL ... 33
7.2.1. Analysis of data ... 33
8. Findings and Choice of best option ... 38
9. Conclusions and Recommendations ... 40
References ... 42
1. Introduction
In the framework of completing my Master studies in International Management at the University of Twente, I performed a Master research into the Radboud University Nijmegen Medical Centre. The project consists in supporting the Logistics Management through building a framework of inventory management practices for the logistics centralization plan of five departments of the hospital. These departments will be relocated into a new facility in which their operating rooms will be supplied from a central warehouse. Our main goal is to develop a framework of practices on the inventory control area that supports the new centralized logistics plan of RUNMC through improving cost efficiency without compromising health of patients.
1.1. Background
Healthcare operations management can be defined as “a discipline that integrates scientific principles of management to determine the most efficient and optimal methods to support patient care delivery” (Langabeer II, James R., 2008, pp. 3).
In other words, operations management combines processes and decisions with the main goal of addressing costs, process, technology and productivity.
In this study we will focus on one of the main activities related to the operation management in the healthcare industry, which is the improvement of inventory management.
In this sense we will focus our research on a case study: this is The Radboud University Nijmegen Medical Centre, a hospital associated with the Radboud University from Nijmegen in Netherlands.
The Radboud University Nijmegen Medical Centre (RUNMC) was formed in 1999 by a merger of The Academic Hospital of Nijmegen and the medical faculty of the Radboud University Nijmegen, creating an academic health science centre. Thus, it is a semi-independent medical university and hospital, which is not directly linked to the Radboud University.
It is one of the largest and leading hospitals of The Netherlands, providing supraregional tertiary care for residents of a large part of the eastern section of The Netherlands.
The medical center employs 8840 employees, and offers educational services to 1925 medical students, 505 medical bioscience students, and 447 dentistry students. The medical center has 953 beds (http://www.umcn.nl/Pages/default.aspx).
1.2. Objective
Neuro-Plastic surgery and KNO & MKA surgery (which is the department of throat, nose, laryngology and mouth and maxillofacial surgery).
The logistics of these departments will be controlled by one logistics management, which means that they will share the same warehouse, the same supply flow process and the same inventory control system.
The main objective of this research is to define a framework of inventory practices as well as identify an inventory control system for the new centralized situation that improves cost-efficiency without compromising the health of patients.
In this new centralized inventory control system it is necessary to take into account the variety of materials that are used by the different departments which in total include approximately 4,850 items. It is also needed to consider that some departments share necessities in terms of a number of materials, such that inventory should be processed according to the needs of those departments in combination.
1.3. Research question
What would be an appropriate framework of inventory management practices to be applied in the RUNMC in a centralized logistics situation for the five departments involved: COK, Orthopedics, Cardio-Thoracic surgery, Neuro-Plastic surgery and KNO & MKA surgery?
1.3.1. Sub-questions
1. How is inventory management currently organized in RUNMC? 2. What inventory practices are currently being executed?
3. What are relevant Key Performance Indicators to measure these practices?
4. What best practices can be identified on the basis of estimating the scores to these KPIs?
5. What alternatives do exist to integrate the best practices in the new situation of RUNMC?
6. What are the pros and contras of these alternatives?
7. What is the final proposal for the new centralized inventory management in RUNMC?
1.4. Research Strategy
This project is a case study where the basic idea is to improve the inventory control system for the five units involved on the centralized logistics plan at RUNMC. In this sense our aim is to build a framework of inventory practices that improves the cost efficiency of this centralized plan without compromising the health of patients.
2. Methodology
We used different methods in order to answer the raised questions.
In order to answer the questions: How is internal logistics currently organized in hospital RUNMC? And, what logistic practices are currently being executed?
We performed a logistic audit of the five departments in the RUNMC. This includes getting to know general inventory practices they currently perform and resources with they count on. For this aim, personal observation and consultation with several employees were used.
To respond to the questions: What are relevant Key Performance Indicators to measure these practices? What best practices can be identified on the basis of estimating the scores to these KPIs?
We obtained and analyze internal data and discuss these with the various stakeholders in the hospitals. In this sense the hospitals counts with internal computerized systems such as OKAPI and MATRIX. From OKAPI system we took the description of the items involved in this study, its price, codes and units per order. From MATRIX obtained the historical register of the replenishment orders made during the year 2010. The report shows relevant information related to each order such as: date, number of pieces required, department who executed and paid the order and other information. From this list we were able to count with the supply side of the item.
We counted with indirect support from IT department who provided a list of all the surgeries performed during 2010. This report contains same relevant information as the replenishment orders report. From this register we were able to count with the demand side of the item.
In order to perform this research other materials and actions were taken into account. Additional materials encompass protocols, catalogs, and other reports. Additional actions involved observation and checking inventory of the items in different random times.
The main sources of information were: literature, expert interviews with employees, internal data obtained from the IT-system, and observation.
Finally a comparison of appliance through small pilot studies of the main inventory control systems presented in this paper were performed and analyzed. Basically we focus on three approaches:
The current situation
Periodic Review approach
A Continuous Review approach
We based our results on the Key Performance Indicators.
3. Literature Review
The operations management in the health care industry involves constantly looking for the most efficient movement of resources. Its main goals are reducing costs, reducing variability and improving logistics flow, improving productivity, improving quality of customer service, and constantly improve business processes. (Langabeer II, et al. 2008).
Therefore, an operations manager is in charge of improving logistics by using rationalized processes to raise capacity, workflow and productivity and for the reduction of variability or inconsistency of inputs and outputs in order to reduce uncertainty, overstock or understock of resources, and inconsistent results.
In this review we firstly will make an overview of the different topics that are related to the inventory management on the health care field. Finally we will focus our attention on the inventory management activity which is the area of interest on our study.
3.1. Health Care Supply Chain
A supply chain is “a virtual network that facilitates the movement of product from its production, distribution, and consumption” (Ozcan, Yasar A., 2009, pp. 263).
In the healthcare industry, logistics managers are in charge of how much of each kind of materials, and when, it is necessary to purchase and keep in their warehouses in order to provide an efficient service to patients, as well as minimizing their costs related to supply management.
Medical supplies can be classified in three types: drugs and pharmaceuticals, medical-surgical supplies, and devices. The medical-medical-surgical supplies refer to items such as “injection syringes, blood and specimen collection kits, hospital laboratory products, wound management products, and intravenous solutions” (Ozcan, Yasar A., 2009, pp. 265). Medical devices include high technology and highly priced devices which are used for diagnosis and therapies, they encompass “surgical and medical instruments and apparatus, orthopedic, prosthetic and surgical appliances (for example, shoulder, knee, and hip replacements), X – ray apparatus, tubes, irradiation apparatus, electro-medical and electrotherapeutic devices” (Ozcan, Yasar A., 2009, pp. 265).
A good inventory management of these supplies is fundamental for the success of the operation in any hospital. An important reason is the proportion of money expenditure that they represent in the budget of hospitals, which typically ascends to 25 to 30% (Ozcan, Yasar A., 2009, pp. 268). This means that medical supplies may involve a significant quantity of a hospital’s assets, therefore reducing or optimizing its inventories can significantly increases its ROI (Return on Investment).
for instance transference of purchasing orders via computer, which at same time creates databases of usage, price, and other important information for future decision making. These inventory databases linked to other clinical and financial data systems allow to identify useful information such as: utilization patterns, resource allocation – which is useful to concentrate efforts-, conciliation of costs from different providers, identification of practice patterns that could cut costs, and others.
A good framework of best practices basically can include a computerized inventory management system through which a manager can avoid the traditional old practices and focus on material utilization review, and performing reviews of how personnel use supplies which contributes to reduce or even eliminate the usage of some items having always into account the maintenance of a certain level of quality. Of course, other practices should be included.
3.2. Inventory Management
Here we present an overview of the literature that Silver, Pyke & Peterson (1998) present on the topic of inventory management, related to an uncertain pattern. Such uncertain pattern on the demand is the general case at hospitals. This is mostly due to the difficulty in determining a high level of accuracy when talking about people that come to hospitals for the treatment of any health problem.
The primary purpose of Inventory Management is to match supply and demand of items. However, the difficulty on measuring uncertainty can drive the hospitals and companies in general to overstock and understock problems. This raises the importance given to the costs associated with these problems. For instance overstock problems at hospitals immediately raises the costs associated with keeping high values of inventories in storage which includes high costs on insurances, the use of more storage space, extra labor force, extra material handling, spoilage and expiration of items and others.
On the other hand, shortage costs in this case can involve:
- The cost of not performing a required operation, this is the price of a particular operation.
- The cost of compromising the health or causing the death of a patient, which is the opposite mission of a health care unit.
- The cost of compromising the hospital’s reputation due to the decrease on the degree of customer service.
- The costs of probable lawsuits, and others.
To deal with the possibility of shortages, particularly in the case of hospitals, it should be included a “Lsafety stock of items which is kept to meet unexpected fluctuations in demand” (Silver et al., 1998, pp. 232)
Therefore, it is important to choose an appropriate Inventory Control System that deals with all these aspects without compromising the health of patients.
• On hand stock, this is the stock that is kept on the departments storages in order to supply the demand of operations in the short run.
• Net stock, this is the on hand stock minus the backorders.
• Inventory position or available stock, this is equal to: On hand stock + On order – Backorders – Committed
Where: On order stock is the one that has been ordered to the supplier but not received yet. The Committed stock is the one that cannot be used in the short run and it is dedicated to other purposes.
• Safety stock, this is the average quantity of net stock in the instant just before a new order arrives. This quantity is defined by the consequences on the demand when the inventory incurs in a stockout.
There are three important questions that any Inventory Control System should solve when a demand presents a probabilistic pattern. They are: how often the inventory level should be reviewed, when a new order should be required, and the quantity of the replenishment order to be required. (Silver et al., 1998).
In order to determine these three aspects, it is essential to define the importance of the item, whether the stock status should be reviewed continuously or periodically, the kind of inventory policy to apply and the cost and service target to be set.
3.2.1. Classification Systems
It is essential to classify the items in stock according to their relative importance in regard to dollars invested, volume, usage and profit potential. The common classification system is the ABC approach, which categorizes items into three classes: “A” items are the most important, they embody the 20% of the total of items but represent 80% of dollar sales; “B” items are important since they include 30% of the items and represent 15% of dollar sales; and “C” items which encompass the 50% of items and only 5% of sales. (Silver et al.,1998).
3.2.2. Inventory Accounting Systems
The inventory accounting systems can be periodic or continuous. The review interval “R” is the time that elapses between two consecutive reviews. In a periodic system, the inventory is physically reviewed in a review interval “R” that can be one day, one week, one month, and so forth, with the purpose of deciding the quantity to order of each item. The advantages of this kind of system are: many orders occur at the same time which reduces the processing and shipping of orders, it is made a physical review each time which makes it more effective in detecting spoilage of slow-moving items and also more effective in detecting real quantities. Disadvantages are that there is a lot of uncertainty between each review which can bring shortages on stock, this makes imperative to carry with extra or safety stock; also physical and time limits often determine the review interval, which normally takes place ones per week.
computerized systems such as electronic scanners like for instance bar codes and others. Advantages are the strict control provided by continuous monitoring of extractions, and the fact that it requires less safety stock which means less carrying costs. Disadvantages are that this kind of system is generally more expensive regarding the reviewing costs and reviewing errors, for instance the scanning devices represent high costs, also this system is more tended to incur in spoilage, theft and other factors due to the lack of a constant physical review.
3.2.3. Inventory Policies
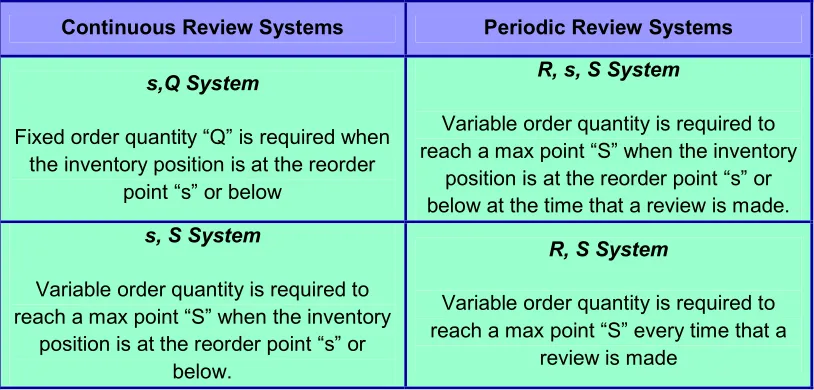
Here we will make a quick overview of the 4 types of control systems that continuous and periodic review systems have for us to determine the order point and the order quantity. The two types of continuous review systems are: the Order Point - Order Quantity System and the Order point - Order-Up-to-Level System. The periodic review systems encompass the (R,s,S) System and the Periodic Review – Order-Up-to-Level System.
• Order-Point, Order-Quantity System or (s,Q) System
This continuous review system (with R=0), implies a fixed order quantity “Q” that is required when the inventory position reaches the reorder point “s” or below. The inventory position includes the requisitions made before but not yet received, this way it is not placed an unnecessary order in case a previous order is about to be delivered. In this system the main disadvantage is that the order quantity is fixed, therefore if in some moment the demand achieves an unexpected level above the order quantity, the replenishment of size Q won’t even raise the inventory position above the reorder point.
• Order-Point, Order-Up-to-Level System or (s, S) System
In this system also a replenishment is made when the inventory position gets the point “s” or below. Here the reorder quantity is variable and it is such that it raises the inventory position to the order-up-to-level “S”. This system is generally called a min-max system since the inventory position always fluctuates between a minimum value of s and a maximum value of “S”.
• Periodic Review (R, s, S) System
On this system, every time we make a review where a time “R” elapses between reviews, we order a sufficient quantity to raise the inventory position to a level “S” only in the case that the inventory position is at or lower than a reorder point “s”. If the inventory position is above “s”, no orders are placed until the next review time.
• Periodic Review Order-Up-to-Level System or (R, S) System
several orders of items is a fact that can grant considerable savings, and this system also gives a constant opportunity to change the order-up-to-level point “S” according to the changes on the demand pattern. The principal disadvantage is that the carrying costs in this system are higher than in a continuous review system.
[image:16.612.103.510.196.391.2]Table 1 summarizes these inventory systems.
Table 1
Inventory Policies summary
Continuous Review Systems Periodic Review Systems
s,Q System
Fixed order quantity “Q” is required when the inventory position is at the reorder
point “s” or below
R, s, S System
Variable order quantity is required to reach a max point “S” when the inventory
position is at the reorder point “s” or below at the time that a review is made. s, S System
Variable order quantity is required to reach a max point “S” when the inventory
position is at the reorder point “s” or below.
R, S System
Variable order quantity is required to reach a max point “S” every time that a
review is made
3.2.4. Cost and Service Objective. Determining the Safety Stock
4. Building up the Research Framework
Based on our literature review we will develop in this section our research framework. We first describe the systems to be applied in our research, we continue later describing the criteria that we will use to measure the effectiveness of each system applied, and we finish this section summarizing the parameters of our research framework.
4.1. Inventory control systems to be applied in this research
Taking into account all the aspects already overviewed, this study builds on some of the existing inventory control models by performing small pilot studies on which we apply these models on the current situation at Radboud. The main aim is finding the most cost effective inventory control system that could be applied to the new centralized situation of the five departments.
The idea of our analysis is to obtain a rough picture of both kinds of systems: periodic and continuous. Besides we want to introduce both parameters: the fixed quantity and the order-up-to-level. Therefore we will apply one policy from each inventory control system type that fits with all our aims. Furthermore, throughout this report we assume probabilistic demand.
For the purposes of this study we will use the continuous review system: Order-Point, Order-Quantity System or (s,Q) System; and the periodic review system: Order-Up-to-Level System or (R, S) System.
• The continuous review Order-Point, Order-Quantity System
The continuous review Order-Point, Order-Quantity System or (s, Q) System is defined by different parameters:
D= Demand per year (in units)
d= Daily demand
k= order point safety factor (which determines the safety stock)
L= Replenishment lead time (in days)
Q= Order quantity
s= Order point
SS= Safety stock
E(DL)= Expected demand during a replenishment lead time
STD(DL) = Standard Deviation of demand during a replenishment lead time
These parameters are determined by the formulas:
E(DL)= (mean of daily demand) * L
STD(DL) =
√(L * variance of daily demand)
s = E(DL) + SS
SS= k * STD(DL)
k= we determine the order point safety factor k by requiring a sufficiently high service level, which is defined as the probability that the local warehouse won’t run out of stock in a replenishment cycle. If f is our target service level, then k is determined by the formula:
k = Ф-1 (f)
where Ф-1 is the inverse standard normal distribution function. This formula to find k is implemented in Microsoft Excel under the name NORMSINV(f).
Q= Can be determined in two ways. One way is using the Economic Order Quantity (EOQ) approach which defines Q by the formula:
Q = √[(2AE(D))/vr] (Silver et al.,1998)
where A is a fixed cost quantity in which the company incurs on each replenishment order delivered. E(D) is the expected yearly demand. v is the variable cost of the item in terms of its price and value after the replenishment process which in this case includes its correspondent material handling cost. And r is the carrying cost per each euro invested on the item kept on inventory.
Another more practical option to choose the fixed quantity Q is making an estimate based on historical data.
• The periodic review system: Order-Up-to-Level System (R,S)
The periodic review Order-Up-to-Level System or (R, S) System differs in some parameters from the continuous review system:
R= represents the review period or the period that constantly elapses between each review.
L= Lead time in days
k= order up to safety factor (which determines the safety stock)
D(L+R) = Demand during a replenishment cycle, in units
E(D(L+R)) = Expected demand during a replenishment cycle, in units
STD[D(L+R)] = Standard deviation of expected demand during a replenishment cycle.
E(D(L+R))= (mean of daily demand) * (L+R)
STD(D (L+R))=
√
[ (L+R) * variance of daily demand) ]S = E[D(L+R)] + k * SS
SS = k * STD[D(L+R)]
k= we determine the order up to safety factor k by requiring a sufficiently high service level, (recall, this is defined as the probability that the local warehouse won’t run out of stock in a replenishment cycle). As in the previous case, if f is our target service level, then k is determined by the formula:
k = Ф-1 (f)
where Ф-1 is the inverse standard normal distribution function. This formula to find k is implemented in Microsoft Excel under the name NORMSINV(f).
4.2. Choosing an appropriate Inventory Control System. The Key Performance Indicators (KPIs)
Once we delimited the inventory systems for developing our research, we should choose the one which is more appropriate for the company according with the targets set in regard to costs and service objectives. Therefore, these systems have to be evaluated in order to measure the quality of Inventory Management that they perform. This is the reason why we need to establish some KPIs.
Since the main purpose of our research is to identify an inventory control system for the new centralized situation at Radboud that improves cost-efficiency without compromising the health of patients, the KPIs to be established should be capable to measure the effectiveness of the inventory system in terms of costs and service level. We found that in the inventory management theory, the main tools that take into account the mentioned variables are:
- The holding or carrying costs - The service level
• The carrying costs
The carrying costs are the costs associated with holding a certain level of inventory over time. These costs include costs related to storage such as insurances, extra employees and interest payments, as well as obsolescence. According to Heizer & Render (2011, pp. 506), holding costs normally represent the aspects and figures below:
These costs usually represent an approximate of 6% of the inventory value, but they can range between 3-10%.
• Material handling costs. Include equipment payments (which can include lease), depreciation of equipment, power, and others related to this aspect. These costs range between 1 to 3.5% of the inventory value, but usually they represent a 3% of it.
• Labor cost. Involves labor force used on receiving and warehousing inventories, as well as security employees hired for keeping inventories safe. These costs generally represent an approximate of 3% of inventory value.
• Investment costs. They can include borrowing costs, taxes associated to the inventory value, and insurance on inventory. They can represent an approximate of 11% of inventory value (this figure can range from 6 to 24%).
• Spoilage and obsolescence. Mainly in health care services, spoilage of products is a common situation. This cost probably would represent about 3% of inventory value, but it can range from 2-5% approximately.
Extracting and adding all the costs above we can obtain an overall carrying cost of an annual approximate of 26% of the inventory value. This is an extra cost of the pure investment on the physic inventory kept on storage.
• The service level
This is the probability that all items that are demanded can be delivered within a replenishment cycle. In this case we set a target value for this service level. Then we calculate a corresponding safety stock.
4.3. Summarizing the parameters of our research
After having described our research framework and the criteria to measure the effectiveness of the systems to be applied in our study, we summarize here the parameters on which we will base our analysis and comparisons in next chapters.
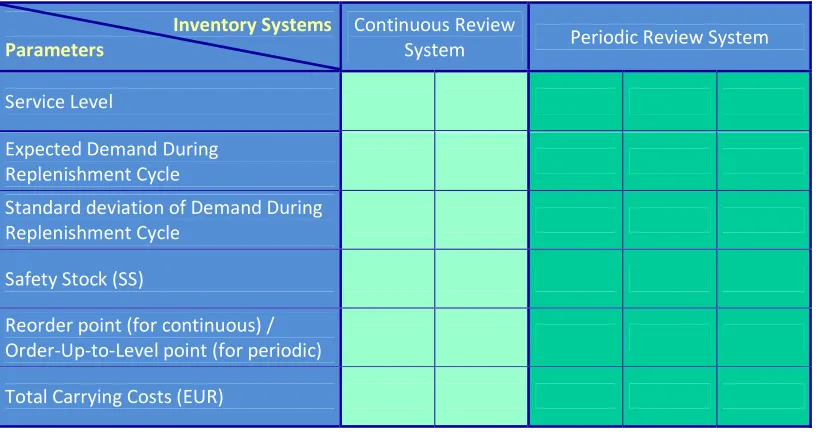
Basically we will use the table showed in Figure 1 which encompasses our research framework. It consists of:
- The Key Performance Indicators (KPIs) that will allow us to determine which system is the most cost-effective. These are also placed in the first column of our table. They are the service level and the carrying costs.
[image:21.612.106.515.188.404.2]
Figure 1
Table of parameters for analysis purposes in this research
Inventory Systems Parameters
Continuous Review
System Periodic Review System
Service Level
Expected Demand During Replenishment Cycle
Standard deviation of Demand During Replenishment Cycle
Safety Stock (SS)
Reorder point (for continuous) / Order-Up-to-Level point (for periodic)
5. Current Inventory Practices at Radboud
5.1. Current organization
As previously mentioned, the five departments involved in this project are:
• Central Surgery (COK), which includes the fields of general surgery, anesthesiology, urology, gynecology and emergencies.
• Cardio-Thoracic Surgery
• KNO & MKA surgery (Throat, nose, laryngology and mouth and maxillofacial surgery)
• Neuro-plastic surgery • Orthopedics
These departments are currently working under a decentralized structure in which each department represents a cost center. Each cost center is independently organized with its own structure and logistics organization. However their logistics activities are under the control of one only manager who is called the Logistics manager. On January 2012, these departments will migrate to a new building where all the supply management process and inventory management will be standardized and centralized under one unique big warehouse. This warehouse will constitute the only local spot for storage of the items that are utilized on surgeries and treatments by the five departments mentioned. We can see the planned structure for the new building on Figure 2.
[image:22.612.146.467.395.606.2]Figure 2
Planned structure for the new building for the 5 departments at Radboud
Figure provided by the Logistics Manager at Radboud.
The basic idea is that two persons will mainly manage the central storage. Each of them will hold the main contact with other two logistics employees that will be in charge of supplying with all the necessary materials to certain departments assigned.
5.2. Current supply process
More than 4,800 medical items are used among the five departments involved. Each department is currently in charge of placing, handling and storage its own replenishment orders of materials that are used in their surgeries and treatments. Therefore, each department counts with its own local storage cabinets for holding their inventories. When a new replenishment necessity appears in one department, there are two main sources of supply of materials:
• Hospital’s Internal Warehouse
• External Suppliers
The replenishment orders placed to both of these sources are made through a computerized system.
Figure 3
[image:23.612.109.524.318.558.2]Current supply process for the local storages of each of the five departments at Radboud
Figure provided by the Logistics Manager of the five departments involved at Radboud (in Dutch).
• Hospital’s Internal Warehouse
The RUNMC counts with a big internal warehouse that is managed independently. This means that the person in charge is responsible of replenishing it with all the materials needed by the entire hospital within a system of min and max quantities.
Big shipments arrive to this warehouse where the materials are split into sterilized and non sterilized materials. Sterilized materials are translated to the Sterilization
External Supplier
department which is located next to the main warehouse. Non sterilized materials are stored in the main warehouse.
The replenishments of approximately 800 items are picked up from this storage to the five departments involved, and the lead time that is taken to deliver these replenishment orders generally range from 15 minutes to one hour.
• External Suppliers
More than 4,000 items are ordered directly from the departments to external suppliers (others than the internal warehouse). The main reason of not leaving the handling of these items under the management of the internal warehouse is the high cost that each of these items represent. These materials are normally very specialized and essential for surgeries. The normal lead time for 95% of these items is about 24 to 48 hours; the remaining 5% is delivered in approximately one month. Until March 2011, seven external suppliers were replenishing the five departments, as from April 2011 these items will be bought to only one external supplier in order to get better bargaining advantages.
5.3. Current shared logistics practices
Part of the current logistics practices that are shared by all the five departments are:
• Each Cost Center is empowered to require for supplements when needed. Managers have the authority to make requisitions according to their own criteria.
• Each department counts with its own internal storage. The internal storages on the five departments encompass:
Cabinets: Closets where the items are storage on different basquets.
Catalogs: Lists that are placed at the end of each hall containing the location of all of the items in storage.
Protocols: Files of lists that contain all the materials that are needed for each kind of operation.
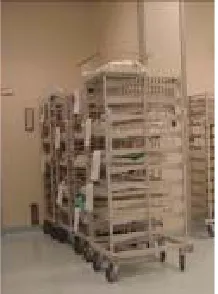
Figure 4
Carts for gathering items according to protocols
List of surgeries are provided by internal computer systems, ordered by date, surgery room, kind of surgeries, and other information. These lists are printed every day in order for the logistics employees to prepare the materials needed for each surgery -according to protocols - and take them from the local department’s storages to the surgery room.
Summary of the entire procedure:
Printing of the daily surgeries list at the end of the day Finding the protocols of those surgeries Gathering the materials according to protocols Delivering the car with materials to the surgery rooms in order to be prepared for next day.
• Inventory practices
As mentioned before, each department is organized differently since they are independent and autonomous cost centers. Therefore, each department has its own inventory practices. Some of these departments are better organized than others depending on the size of the department and its level of activities. In general, logistics employees order new supplies each Monday, the order quantities are based on old established max min quantities, but for instance, in one of the departments (COK) the order quantities are based on an established old list made by some employee. Therefore it is possible to say that they perform a kind of periodic review combined with a system of max min quantities.
6. Current Problems and Consequences
In general we could observe that the current situation presents many problems that don’t allow the manager and logistics employees to keep an appropriate control and monitoring of the inventory. This situation produces different kind of consequences that are prejudicial not only for the departments but also for the hospital. Therefore, in this section we summarize the main problems and consequences that affect the current inventory management situation.
6.1. Problems
Among the problems that the current inventory control situation presents are:
• There are no clear processes for replenishment of supplies. And there is no framework of ideal inventory practices that are shared by all the five departments.
• Protocols are not up to date.
• Locations of many items are unclear. This generates waste of time for the employees (particularly for new and relatively new employees) when gathering the materials.
• Low IT support. This involves:
Low tracking of the materials – real usage
Presence of many differences in codes and names of both items and operations between physic and system. This makes it difficult to find information in the system. For instance, when trying to find information about any item in the system, such as price, or code, etc. many times the physical code is different to the code in the system. Names also can be different
Ineffective computer control systems – No presence of electronic scanning devices in all the five departments.
No accurate physical track of items
No risk pooling. Each department counts with its own safety stock
Differences in Inventory Management among departments – some well organized, other ones not so well
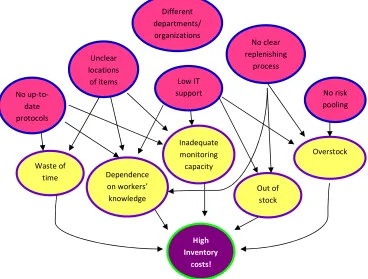
6.2. Consequences
The main consequences derived from the problems listed above are:
• Inventory overstock
• Strong dependence on the worker’s knowledge- Locations of the materials, codes of the operations in protocols, quantities on inventory, finding the appropriate protocols according to the operations (the name can appear differently on the title of the protocol), items missing on the protocols, and further.
• Search and cannot find-waste of time
• Inadequate monitoring capacity for the manager
• High inventory costs
• Overstock due to all the five safety stocks.
[image:27.612.120.488.294.573.2]All of these consequences drive the current situation to high costs.
Figure 5
Summary of problems and consequences on current situation at Radboud
6.3. Limitations
The problems previously presented imposed strong limitations to this research. For instance we had some limits to get information from the IT systems. Information that represents a big amount of data should be required to the hospital’s IT department, which takes one or two weeks in providing it. And sometimes the information could not be complete.
Low IT support Different departments/ organizations
High Inventory
costs! Inadequate monitoring capacity
No clear replenishing
process
No risk pooling
Out of stock
Overstock No
up-to-date protocols
Unclear locations
of items
Dependence on workers’
knowledge Waste of
The weak registration (or no registration at all) of the usage of the materials through a computerized system, imposed big boundaries to this research, since it is difficult to find out the real demand of the items. As a way to deal with this disadvantage, we tried to find out the demand of specific items through the number of operations in which are used particular items. However, most of the items are used in large numbers of operations and many times they are used in different quantities, making the fact of determining those items’ demands an impractical task. This is especially emphasized when it is imperative to find out the operations involved from a pool of thousands and thousands of them concerning to different departments.
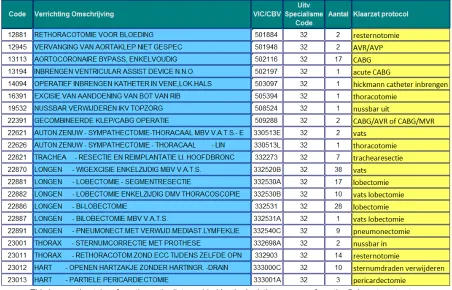
[image:28.612.85.537.384.674.2]Other big constraint we found is that there was some missing information that leaves big empties to persons that don’t have the appropriate knowledge. For instance the lists and reports that contain the name and quantities of surgeries don’t match with names in protocols since titles are filed by abbreviated names or codes. For example, the surgery name on the list is: “Cor. Arterien- A. Mammaria Implantatie – Meervoudig”, the protocol is filed as CABG. The new employee or the researcher should previously count with some prior relevant knowledge as well as with a lot of time and support from the logistics manager and employees, which most of the time is really restricted due to the large and constant activity at the hospital. For a snapshot of what might be confusing due to different names, see Figure 6.
Figure 6
Surgical procedures recorded in 2010 by executive department
7. Options for a joint Inventory policy for all five departments. Analysis of data
After having an overview of the current situation regarding the inventory control at the five departments at Radboud, we know that there are some problems that affect their performance. Therefore we need to apply a new inventory system that results in more cost-efficiency. I will use the research framework from chapter 4 in trying to solve some of the problems mentioned in chapter 6. At the same time this research framework will help us to meet the main objectives of this study. The framework includes the continuous review Point, Quantity System and the periodic review Order-Up-to-Level System. We will apply these systems in our analyses and we will develop the parameters previously introduced.
In order to be able to present the options for a joint inventory policy for the five departments, we present below the study that we performed at Radboud. From this study the options are derived.
Our study at Radboud
As we previously commented, in this research we will assume that the items used in the five departments at Radboud present a probabilistic demand; it means that their demand includes some degree of uncertainty given by the difficulty in determining a high level of accuracy in the hospital’s demand. In this sense and taking into account the advantages and disadvantages of each Inventory Control System, we decided to choose the continuous review system Order-Point, Order-Quantity System and the periodic review system: Order-Up-to-Level System.
Since the five departments: COK, Orthopedics, Cardio-Thoracic surgery, Neuro-Plastic surgery and KNO & MKA surgery manage a large range of items, in this case approximately 4,850 items, one advantage derived from the Periodic Review System is that many orders of items can occur at same time. Another advantage for items such the ones managed in a common hospital is that the periodic physical review can make more effective the detection of items spoiled or out of expiration date, it also can prevent theft –which is one of the common propensities in hospitals in general- and makes an effective real quantities inventory.
On the other hand a Continuous Review System can be more advantageous when the inventory control is entirely made through a computerized system. This computerized control system should register the replenishment orders placed, the delivered orders which is the equivalent to the entrance of materials to local storage, and usage of materials which is the equivalent to the register of what is going out from the local storage. Other relevant information is also needed to be registered in such computerized system, as for instance values, dates, inventory remaining, and further. Under these conditions, a continuous review system can save large quantities of money since it is kept a strict control of the inventory and therefore it is required less inventory on local storage and less safety stock.
but also high qualitative costs such the costs of health or life of a patient and reputation of the hospital. Therefore we need to find a solution that doesn’t compromise the health and life of patients that come to the Radboud Hospital.
7.1. First sample: The Sectio Tray
In this study we found out that the most problematic items are the ones that are requested to the external supplier. The reason is that they are the ones that involve higher costs –higher prices than the ones are requested to the internal warehouse of the hospital-. Also, these externally supplied items have a higher lead time –much larger than the ones requested to the internal warehouse. Items from external supplier represent normally 24 to 48 hours, and in 5% of the items lead time can take until two months. Conversely, lead time of items requested to internal warehouse varies from 1 hour to 15 minutes -. Therefore, we focused our attention to items provided by external supplier.
Due to the complexity that brings tracking the demand of a large range of items, and taking into account all the boundaries that this research implies, we decided to take a first sample of 1 item: the Sectio Tray, whose demand is known with total accuracy due to the fact that it is used in only one department on 6 type of operations named literally:
SECTIO CAESAREA- PRIMAIR - GEEN VOORBEHANDELING WEL KRAAM SECTIO CAESAREA- PRIMAIR - MET VOORBEHANDELING EN KRAAMBE SECTIO CAESAREA- SECUNDAIR - MET VOORBEHANDELING EN KRAAM SECTIO CAESAREA- SECUNDAIR-GEEN VOORBEHANDELING WEL KRAAM SECTIO CAESAREA (PRIMAIR)
SECTIO CAESAREA (SECUNDAIR)
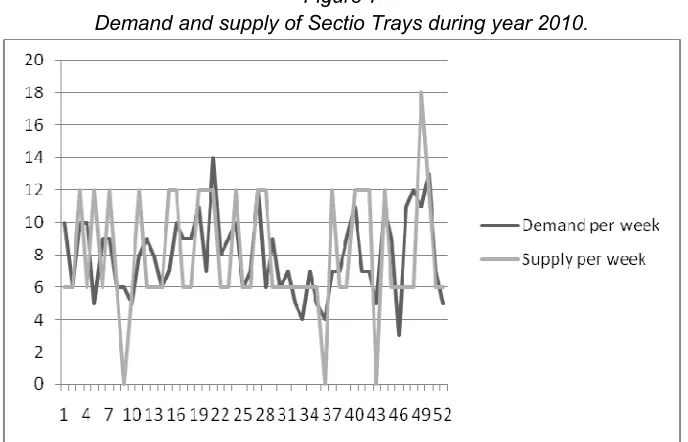
Figure 7
Demand and supply of Sectio Trays during year 2010.
Source: made by the author based on the demand of all the 6 kind of Sectio Caesarea operations in COK, Radboud hospital 2010.
Under the assumption that we didn’t count with any inventory at the beginning of the year, in the figure we can observe a lot of points that represent shortages quite often over the time. This doesn’t make so much sense since despite these supposed shortages, the operations were performed. Therefore, we made some logical assumptions later on our analysis.
We will classify our item as a fast mover class item based on the following reasons: we could observe that the number of all these 6 operations combined represent 414 in total in 2010. This represents one of the highest numbers among the total range of operations that are performed by the departments in study. The second reason is that the Sectio Tray is one of the most expensive items in this range; its cost represents EUR 79.58.
The lead time for the Sectio Tray is 48 hours. It is requested to one external supplier only.
7.1.1. Analysis of data
In order to be able to make a comparison between different alternatives, our first analysis is based on the current situation of Sectio Trays. Secondly we apply two alternatives namely continuous review Order-Point, Order-Quantity System and we continue later analyzing our data with the periodic review Order-Up-to-Level System.
• Analysis of current situation of Sectio Trays
we counted with the number of performed operations in which the Sectio Tray is used. Having this, we proceeded to find the physical daily inventory subtracting: supply-demand, taking into account the lead time (48 hours) to physically count with the replenishment orders.
Currently, the supply doesn’t present a clear policy, orders are placed in different cycle of times, there is no clear reorder point, but the only aspect that is clear is that every time they order 6 pieces of Sectio Trays, which gives us a first parameter that is a fixed quantity Q=6 according to this historical data.
As we could observe on Figure 7, we found a lot of negative numbers. On the other hand we had no information on the actual inventory of the end of 2009. Therefore we assumed an initial inventory (at the end of 2009) of 12 Sectio Trays by the beginning of 2010. Based on Figure 7, we assumed 12 initial Sectio Trays since this is the smallest number that changed all of our numbers into positives. Clearly, it is not possible from these data to give a reliable estimate of the service level.
As last step we proceeded to calculate the daily carrying costs taking into account the figure of 26% of the inventory value suggested by Heizer & Render (2011, pp. 506). In order to calculate the daily carrying cost we first calculated the daily inventory value by multiplying daily inventory*price (EUR 79.58). Secondly we divided the carrying cost factor 0.26/12 months. We obtained a total holding cost of Sectio Trays on 2010 of EUR 188.43.
Table 2 provides a summary of the figures from this analysis.
Table 2
Figures derived from analysis of current situation of Sectio Trays Total
Supply of Sectio
Trays
Total Demand of Sectio Trays
Daily Average Demand E(d)=Daily Expected
Demand
STD(d)
Total Carrying
Costs
414 414 1.15 1.06 188.43
Figures are based on reports from year 2010.
• Continuous review system analysis
In this analysis we adopted a fixed order quantity of 6, supported by the historical data from 2010, which is the same as in the current situation.
The difference in this analysis is that we now took the continuous approximation and we first calculated the parameters: SS=safety stock and s=reorder point.
From this first pilot study we obtained a total holding cost of EUR 270.74.
Table 3
Figures derived from pilot study of continuous review approach on Sectio Trays. Service level 99%.
Expected Demand During
Lead time E(DL)
STD(DL)
Service level
Safety Factor (k)
Safety Stock (SS) Reorder point (s) Total Carrying Costs
2.29 1.51 0.99 2.32 4 6 270.74
Estimated figures are based on reports from year 2010. (Figures have been approximated).
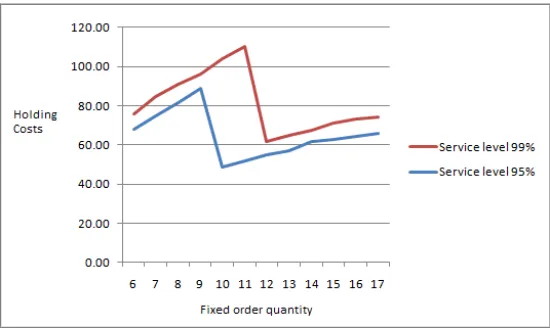
Observe that the carrying costs derived from a continuous review situation, holding a service level of 99% in the level of service, results in higher figures.
Therefore we decided to perform a second pilot study assuming a service level of 95%, which is slightly lower than in the current situation. The purpose of this was to look into a decrease on costs but still keeping a high level of customer service. In this analysis the safety stock resulted in 3 and the reorder point in 5.
From this first pilot study we obtained a total holding cost of EUR 124.83.
Table 4
Figures derived from pilot study of continuous review approach on Sectio Trays. Service level 95%.
Expected Demand During
Lead time E(DL)
STD(DL)
Service level
Safety Factor (k)
Safety Stock (SS) Reorder point (s) Total Carrying Costs
2.29 1.51 0.95 1.64 3 5 124.83
Estimated figures are based on reports from year 2010. (Figures have been approximated).
In this analysis, the carrying costs presented better results.
• Periodic review system analysis
In this pilot study we examined 3 different approaches assuming 3 different service levels. These are: 90%, 95% and 99%. We applied a review period of 7 days.
In this analysis we first calculated the parameters: SS=Safety stock and S=Order-Up-to-Level point.
Then we calculated the holding costs, and we found:
With a service level of 0.95 the holding costs are EUR 191.75
With a service level of 0.99 the holding costs are EUR 236.79
Table 5
Figures derived from pilot study of periodic review approach on Sectio Trays
Expected Demand During Replenishment Cycle E(D(L+R)) Standard Deviation of Demand During Replenishment Cycle STD(D(L+R)) Service level Safety Factor (k)
Safety Stock (SS) Order- Up-to-Level (S) Total Carrying Costs
10.32 3.20 0.99 2.33 7 18 236.79
10.32 3.20 0.95 1.64 5 16 191.75
10.32 3.20 0.90 1.28 4 14 167.74
Estimated figures are based on reports from year 2010. (Figures have been approximated).
7.2. Second Sample: The Universeelset XL
After having some results (which will be summarized in next chapter) regarding to which inventory control system shows better key performance indicators, now our aim is to analyze an item that not only meets the criteria taken to analyze our first sample, but some extra criteria that allows us to make a comparison between a decentralized situation and a centralized inventory management situation. The relevant extra criteria that we applied is that the item should be used by more than one department and should be used in only few operations in order to be able to find high accuracy on its demand. From the collection of the data related to its supply and demand, our aim is to analyze this item separately per department and afterwards to make a pilot study as a joined demand and supply.
We found several limits making this analysis. First, it was highly difficult to find one item that meets all of our criteria, particularly the criteria related to accuracy, due to the fact that most of the items that are used by more than one department, are also used in a very large number of operations, and in lot of cases, it is used more than one per time. However, we found that the item Universeelset XL met most of them.
The Universeelset XL is an item that is utilized by the Orthopedics and Cardio-Thoracic departments. It is provided by one external supplier within 48 hours after have been ordered. The order is made through the internal computer control system from the hospital. It is used in a large number of operations, which are listed in appendix 1. Its price is of EUR 17.65.
7.2.1. Analysis of data
In one side, in the Cardio-Thoracic department, the high quantity showed a negative number of -153 by the end of 2010. In the other side, the Orthopedics department presented a high positive inventory of 128 Universeelsets XL.
As we can observe, both quantities resulted quite similar, with a small difference of 25 items. This made us to think in the possibility that these both departments probably borrow this item between each other. On the other hand, since these numbers don’t make real sense, there are also a lot of probabilities that this data base is polluted, and we don’t count with a truly accurate data.
However, taking into account all the boundaries already described in previous sections, and having experienced the difficulties to find out a real accurate data, we decided to work on the demand with which we already counted and started to perform the pilot studies applying a continuous review and a periodic review supply. Since our purpose is to make a comparison between a decentralized situation and a centralized inventory management, our aim is first to analyze the data separately, it means per department, and secondly we performed a pilot study in a joint situation, in which both demands have been added.
• Separated analysis per department
In the Cardio-Thoracic department we adopted a fixed order quantity of 6 Universeelsets XL, based on the historical data of the supply from 2010.
Assuming first a target service level of 99%, we obtained a Safety Stock of 7 and a reorder point of 10. The total holding costs resulted in EUR 77.43.
Then, we assumed a target service level of 95%. In this analysis we found a Safety Stock of 5 and a reorder point of 8, resulting in a total holding cost of EUR 68.99 by the end of the year.
When applying a periodic review supply, we found the following numbers:
With a target service level of 0.99 the holding costs are EUR 90.82
With a target service level of 0.95 the holding costs are EUR 72.22
With a target service level of 0.90 the holding costs are EUR 62.30
Table 6
Figures derived from pilot study of continuous and periodic review on Cardio-Thoracic department’s demand of Universeelset XL
Continuous Review
System Periodic Review System
Service level 0.99 0.95 0.99 0.95 0.90
Expected Demand During
Replenishment Cycle 3.4 3.4 15.31 15.31 15.31
Standard deviation of Demand During
Replenishment Cycle 2.8 2.8 5.9 5.9 5.9
Safety Stock (SS) 7 5 14 10 8
Reorder point (for continuous) /
Order-Up-to-Level point (for periodic) 10 8 29 25 23
Total Carrying Costs (EUR) 77.43 68.99 90.73 72.16 62.25
Estimated figures are based on reports from year 2010. (Figures have been approximated).
From the figures, we again can conclude that a continuous review system launches more efficient results, which include higher target on customer service level at lower holding costs.
With respect to the Orthopedics department, we applied the same analyses and found the results summarized in table 7. For the purposes of this pilot study we based our fixed order quantity on the historical supply of 2010, which is 3 Universeelsets XL.
Table 7
Figures derived from pilot study of continuous and periodic review on Orthopedics department’s demand of Universeelset XL
Continuous Review
System Periodic Review System
Service level 0.99 0.95 0.99 0.95 0.90
Expected Demand During
Replenishment Cycle 0.28 0.28 1.28 1.28 1.28
Standard deviation of Demand During
Replenishment Cycle 0.6 0.6 1.2 1.2 1.2
Safety Stock (SS) 1 1 3 2 2
Reorder point (for continuous) /
Order-Up-to-Level point (for periodic) 2 1 4 3 3
Total Carrying Costs (EUR) 16.19 12.53 15.33 11.51 9.48