Qualified management of irrigation regimes of crops is one of the basic conditions of irriga-tion profitability. It brings about great savings of irrigation water, electrical power and nitrogen fertilisers, and it enables to achieve optimum and high-quality marketable yields of crops and to reduce a risk of groundwater contamination by
nitrates, pesticide residues and other xenobiotic compounds. SANFORD (2003) stated that the man-agement of irrigation regime could reduce energy consumption per unit yield by 7–32% in relation to the crop. The importance of energy savings increases with the growth of its prices that has been, and will probably be, marked.
Supported by the Ministry of Agriculture of the Czech Republic, Project No. QF3100.
Optimisation of Irrigation Regime for Early Potatoes,
Late Cauliflower, Early Cabbage and Celery
JOSEF ZAVADIL
Research Institute for Soil and Water Conservation, Prague, Czech Republic
Abstract: The paper deals with optimisation of threshold suction pressure of soil water on light soils for early potatoes, early cabbage, late cauliflower and celery on the basis of results of small-plot field experiments with differentiated irrigation regime. Experiments were conducted in 2003–2005. Threshold suction pressures of soil water were identical for all crops: 15 kPa in treatment I, 30 kPa in treatment II, 60 kPa in treatment III, and 120 kPa in treatment IV. Precipitation, air temperature and relative humidity, global solar radiation, wind speed and direction were measured by an automated meteorological station. Reference and actual evapotranspiration was determined for the experimental crops according to FAO Paper No. 56 and by means of a biological curve (BC) in 2003–2005. To compare these two methods of calculation of actual evapotranspiration the soil moisture balance was found out. Based on the influence on marketable yield and proportion of the crop quality grades it is possible to determine the optimum threshold suction pressure on light loamy-sand soils in early potatoes, late cauliflower and cabbage 30 kPa and in celery 15 kPa. 80% of available soil water capacity (ASWC) corresponds to the threshold suction pressure 30 kPa, and as much as 96% of ASWC corresponds to 15 kPa. The seasonal irrigation depths determined on the basis of soil moisture balance, in which the crop evapotranspiration (ETc) is calculated either according to FAO 56 or by the BC, are substantially different from the really achieved irriga-tion depths in the treatments where optimal sucirriga-tion pressure is maintained. For potatoes, the really achieved values of seasonal irrigation depths are nearer to the depths calculated by the BC, while for the other vegetables (cauliflower, cabbage and celery) they are more similar to the depths calculated by FAO 56 methodology. The theoretical irrigation depths calculated by the BC method sometimes differ substantially from those based on FAO 56. These differences are at maximum for cauliflower and celery and at minimum for cabbage and decrease with the decreasing irrigation depths.
Scientific and in practice tested methods may be used for irrigation management. They are usually based either on the measurement of soil mois-ture and on its balance or on the measurement of some physiological parameters of plants. In some countries there exist organisations offering to farmers information necessary for irrigation management. Paid services usually provide daily values of potential or reference evapotranspiration, sometimes with crop coefficients, or direct instru-mental measurements of soil moisture (CURWEN & MASSIE 1994; KOHUT 1996; WOLFF et al. 1996; KING & STARK 1997; MARTINS 2000; SPECTY 2006; http://weather.nmsu.edu/wcc202/; etc.). But mainly farmers in Europe use these services to a small ex-tent. In the Czech Republic (CR) several methods for irrigation regime management were developed. The method of biological curve (SLÁMA 1969) is based on the balance of soil moisture according to potential evapotranspiration determined as the product of the sum of actual vapour pressures over the balance period and the coefficient of biological curve. The graphico-analytical method (KUDRNA 1987) is based on an assumption that the proc-ess of organic matter formation is determined by thermodynamic laws. This method was modified by SLAVÍK (1980) so that it would be possible to manage the irrigation regime of field crops by the prognosis of the need of supplemental irrigation rates in a decade balance period. The agrometeo- rological programme complex AVISO, run by a branch of the Czech Hydrometeorological Insti-tute in Brno, is a balance method based on the computations of potential evapotranspiration by a modified procedure according to Penman and Monteith (KOHUT 1996). None of these methods has been applied in practice on a larger scale.
No scientific method is currently used in the CR for the management of irrigation regimes of vegetables and field crops. Only in newly built mi-croirrigations, mainly in orchards and vineyards, Virrib sensors of the company AMET in Velké Bílovice (http://www.amet.cz) directly measuring soil moisture are used.
Simplicity and low cost of the used method are crucial conditions for the introduction of qualified management of irrigation regimes. For the use of any method it is necessary to determine minimum soil moisture or threshold suction pressure of soil water. Their values are related to the crop and soil type. In the CR the threshold suction pres-sure was determined only for early potatoes on
medium-heavy soils (ZAVADIL 2000). In extensive foreign specialised literature dealing with irriga-tion management threshold sucirriga-tion pressures were reported only in North American literature. For vegetables including potatoes (Irish potato) they were summarised e.g. by KEMBLE and SANDERS (http://www.aces.edu/pubs/docs/A/ANR-1169) or by SANDERS (http://www.nscu.edu/depts/hort/hil/ hil-33-e.html). THOMAS et al. (1970) determined optimum threshold suction pressures of soil water for cabbage while these pressures for potatoes were determined by VAN LOON (1981), SHOCK
et al. (2001), WILSON et al. (2001), KANG et al.
(2004), SHOCK (2004).
This paper deals with the optimisation of thresh-old suction pressure of soil water on light soils for early potatoes, early cabbage, late cauliflower and celery on the basis of results of small-plot field trials with differentiated irrigation regime.
MATERIAL AND METHODS
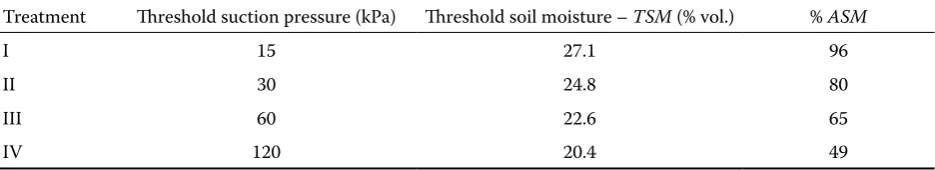
In the experiment we used early potatoes (cul-tivar Marabel – seed tubers were certified as C2), late cauliflower (cv. Fremont), early cabbage (cv. Zora in 2003 and 2005 and cv. Perfekta in 2004) and celery (cv. Maxim). These crop species were chosen with respect to the present assortment of crops irrigated in the CR. The experiment with each crop had 4 variants of irrigation regime. The variant without irrigation was not used in early potatoes and vegetables because their produc-tion without supplemental irrigaproduc-tion is not as-sumed. Threshold suction pressures of soil water were identical for all crops: 15 kPa in treatment I, 30 kPa in treatment II, 60 kPa in treatment III, and 120 kPa in treatment IV. Table 1 shows soil moisture contents in percentage by volume cor-responding to these pre-irrigation suction pres-sures. Suction pressures of soil water in kPa were converted to soil moisture contents in percentage
by volume by means of the pF curve (Figure 1). Field capacity (ΘFC) and wilting point (ΘW) were determined from the pF curve for the effective depth of watering to 0.3 m in early potatoes and to 0.2 m in vegetables. These soil moisture constants have the same value for both depths – ΘFC = 27.6% vol. (pF 2) and ΘW = 13.4% by vol. (pF 4.18). VAN GENUCHTEN equation (1980) was used for the approximation of pF curve.
The irrigation of vegetables started immediately after planting to ensure their survival. In vegetables the irrigation regime started to be differentiated after their rooting to the effective depth of water-ing to 0.2 m and in potatoes after their emergence. The effective depth of watering in potatoes was 0.3 m. All crops were irrigated by microsprinkling. In 2003 we used Super Mamkad sprinklers of the Israeli company Dan Sprinklers with sprinkler intensity 4.6 mm/h at a pressure of 0.35 MPa, in
0 5 10 15 20 25 30 35
1 2 3 4 5
pF
Soil moisture (% vol.)
[image:3.595.64.532.103.188.2]0,2 m 0,3 m 0,4 m 0,6 m
[image:3.595.108.467.531.729.2]Figure 1. pF curves, experimental plot in Mělník-Neuberk locality
Table 1. Differentiation of irrigation regime and the values of soil moisture constants
Treatment Threshold suction pressure (kPa) Threshold soil moisture –TSM (% vol.) % ASM
I 15 27.1 96
II 30 24.8 80
III 60 22.6 65
IV 120 20.4 49
ΘFC (field capacity) = 27.6% vol.;ΘV (permanent wilting point) = 13.4% vol.; ASM (available soil moisture) = ΘFC – ΘV = 14.2% vol.; % ASM = 100 × (TSM – ΘV)/AS
2004 and 2005 impact circular microsprinklers with sprinkler intensity 7.3 mm/h at a pressure 0.35 MPa were employed. The amount of water consumed for irrigation was measured with water meters at each treatment separately. The irrigation regime was adjusted with respect to the need of protective sprayings against diseases and pests, hoeing and weeding. The date of irrigation was indicated when the suction pressure of 15 kPa was reached in treatment I, 30 kPa in treatment II, 60 kPa in treatment III, and 120 kPa in treat-ment IV. Irrigation rates were calculated so that the water content in soil would be filled up to the field capacity and water losses during microsprin-kling would be compensated. Suction pressures of soil water were measured automatically with Watermark sensors of Irrometer Co. (http://www. irrometer.com/agcat.htm#WM) in one-hour inter-vals at a depth of 0.3 and 0.6 m under potatoes and at a depth of 0.2 and 0.4 m under vegetables. At each depth 3 sensors were placed ca. 0.5 m apart for the reason of non-uniform sprinkler intensity and soil heterogeneity. Watermark sensors were used because they measure suction pressures of soil water to 200 kPa and are cheap compared to the other sensors, which is one of the main con-ditions for their use in practice in the CR. Data were recorded with dataloggers of the company Environmental Measuring Systems in Brno (EMS Brno) (http://www.emsbrno.cz). The irrigation re-gime was managed according to suction pressures of soil water at 7.00 a.m. If one value of suction pressure was markedly different from the others, it was left out.
An automated meteorological station of EMS Brno Company was used for meteorological measure-ments. It registered precipitation, air temperature and relative humidity, global solar radiation, wind direction and speed. To determine potato yield 8 rows by 15 hills were harvested, and 8 rows by 15 individuals were harvested to determine vegeta-ble yield. One replication always consisted of two rows. Crop yields were expressed as weight. Besides total yield the proportion of the size categories of potato tubers (< 3, 3–5 and > 5 cm) in yield and the proportion of the quality grades of vegetables in yield were determined. Vegetables were included in grades according to criteria defined by the re-spective Czech technical standards: ČSN 46 3112 Cauliflower (2000), ČSN 46 3113 Head Cabbage and Head Savoy Cabbage (2000) and ČSN 46 3120 Fresh Vegetables – Root Vegetables (1995). Yields
were evaluated by one-factor analysis of variance on a significance level α = 0.05.
Reference evapotranspiration (ETo) was deter-mined in accordance with the FAO 56 paper (AL-LEN et al. 1998). Actual vapour pressure (ea) was calculated from maximum and minimum relative air humidity (RHmax and RHmin) and minimum and maximum air temperature (Tmin and Tmax). For all crops used in the experiment actual eva-potranspiration (ETc) was calculated according to FAO 56 (1) and by means of the biological curve (SLÁMA 1969) (2).
ETc = ETo × Kc (1)
where:
Kc – simple crop coefficient (ALLEN et al. 1998)
ETc = ea × Kb (2)
where:
ea – actual vapour pressure computed from average daily air temperature and its average daily relative humidity
Kb – experimentally determined coefficient of biological curve for the particular temperature groups given in ČSN 75 0434 (1994)
To compare these two methods of ETc computa-tion the soil moisture balance was found out. The assumed allowable soil moisture deficit (ASMD) is based on ČSN 75 0434. For potatoes to flowering and 2 weeks before harvest it is 40% and in the interim period 30%, for cauliflower, cabbage and celery in the first 30 days from planting it is 30% and later until harvest 40%. Each irrigation rate equalled the amount of water necessary to fill up the water content in soil to the depth of irrigation to field capacity.
RESULTS AND DISCUSSION
Figure 3). The same applied to ETc (Figure 4). Gen-erally higher ETc of cabbage in 2004 was caused by the use of cv. Perfekta with longer growing season than in cv. Zora planted in 2003 and 2005.
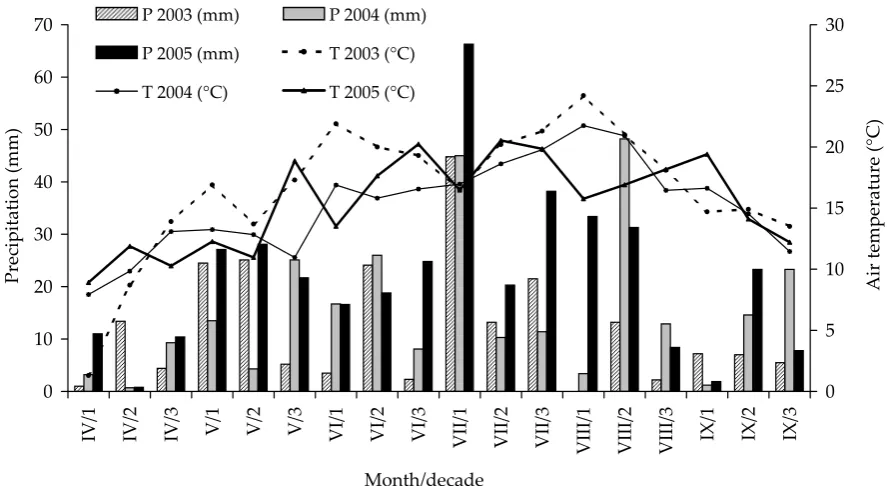
[image:5.595.73.517.82.325.2]The depth of precipitation and its distribution in the growing season of crops made it possible to markedly differentiate seasonal irrigation depths between the treatments in 2003 and 2004 in all
Table 2. Average values of temperature of air (T) and its relative humidity (RH), global radiation (Rg), wind speed (u2), soil temperature at a depth 0.1 m (Ts), precipitation amount (P) and reference evapotranspiration (ETo) for months IV–IX
Year T (oC) RH (%) R
g (W/m2) u2 (m/s) Ts (oC) P (mm) ETo (mm)
2003 15.2 65.8 185.6 1.7 19.0 239.8 678.6
2004 15.2 68.6 176.9 1.7 18.8 277.2 575.6
2005 15.4 70.9 183.8 1.6 18.1 390.2 577.0
0 10 20 30 40 50 60 70
IV
/1
IV
/2
IV
/3 V/1 V/2 V/3
V
I/1 VI/2 VI/3
V
II
/1
V
II
/2
V
II
/3
V
II
I/1
V
II
I/2
V
II
I/3 IX/1 IX/2 IX/3
Month/decade
Precipitation
(mm)
0 5 10 15 20 25 30
A
ir
te
m
pe
ra
tu
re
(°
C
)
P 2003 (mm) P 2004 (mm)
P 2005 (mm) T 2003 (°C)
T 2004 (°C) T 2005 (°C)
[image:5.595.63.531.508.579.2]Figure 2. Comparison of average daily temperatures of air (T) and precipitation amounts (P) for the decades of growing seasons in 2003–2005
Table 3. Precipitation amounts in the growing season of crops
Year Early potatoes Late cauliflower Early cabbage Celery
GS P (mm) GS P (mm) GS P (mm) GS P (mm)
2003 26.3.–14.7. (111 days) 148 3.7.–2.10. (91 days) 87 22.4.–24.6. (64 days) 103 29.4.–2.10. (188 days) 218
2004 (119 days)1.4.–28.7. 174 7.7.–11.10. (96 days) 157 21.4.–20.7. (91 days) 158 (177 days)5.5.–29.9. 262
2005 (111 days)7.4.–26.7. 256 7.7.–26.9. (81 days) 185 20.4.–22.6. (64 days) 124 12.5.–19.9. (160 days) 333
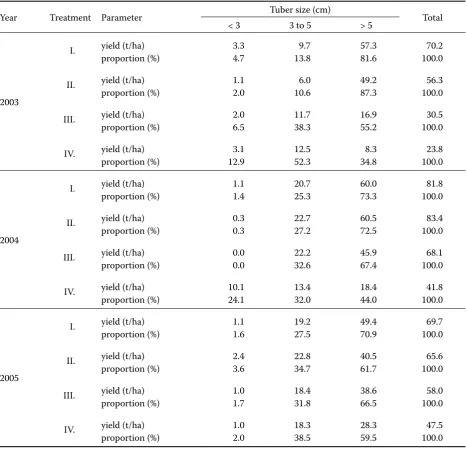
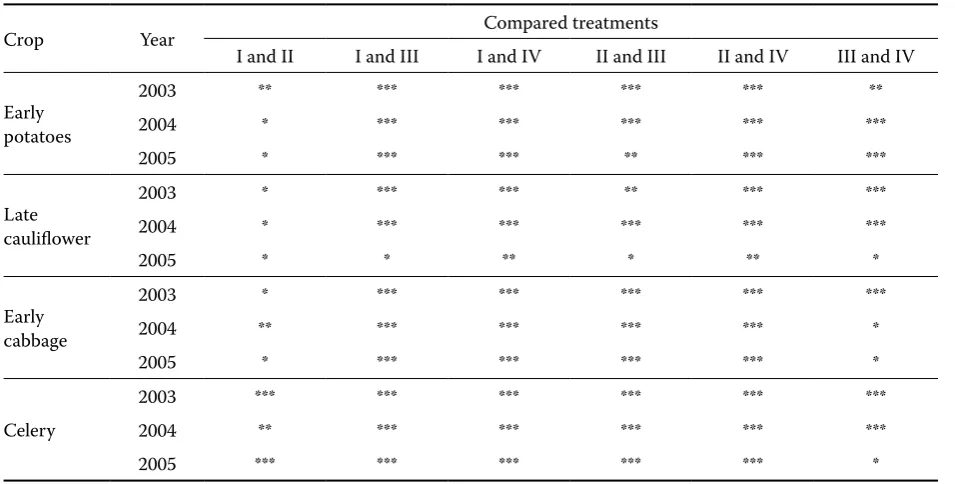
[image:5.595.63.537.619.738.2]crops, in 2005 only in potatoes (Table 4). In all years marketable yields of all crops were highest in treatment I with the highest irrigation depth (Tables 5–8). There was a statistically significant
difference between treatments I and II (pre-ir-rigation suction pressure 15 and/or 30 kPa) only in potato yield in 2003, in cabbage yield in 2004, when cv. Perfekta was planted, and in celery root Wind speed (u2) – monthly averages
0.0 0.5 1.0 1.5 2.0 2.5
I. II. III. IV. V. VI. VII. VIII. IX. X. XI. XII.
(m
/s
)
Actual vapor pressure (ea) – monthly sums
0 20 40 60
I. II. III. IV. V. VI. VII. VIII. IX. X. XI. XII.
(k
Pa
)
Net radiation (Rn) – monthly sums
0 100 200 300 400 500
I. II. III. IV. V. VI. VII. VIII. IX. X. XI. XII.
(M
J/m
2 /m
on
th
)
Reference evapotranspiration (ETo) – monthly sums
0 50 100 150
I. II. III. IV. V. VI. VII. VIII. IX. X. XI. XII.
Month
ET
o
(m
m
[image:6.595.84.497.83.644.2])
Figure 3. Monthly averages of wind speed and monthly sums of actual vapour pressure, net radiation and reference evapotranspiration
▨ 2003 ■ 2004 ■ 2005
Reference evapotranspiration (ETo) – monthly sums Net radiation (Rn) – monthly sums
Actual vapour pressure (ea) – monthly sums Wind speed (u2) – monthly averages
ET
o
(m
m
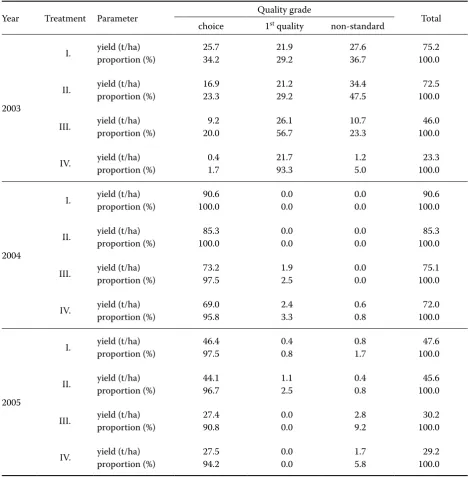
yield in all years (Table 9). The difference in cau-liflower yields between treatments I and II was insignificant in all years. The yields of all crops in treatments III and IV except cauliflower yield in treatment III in 2005 were significantly lower in all three years than in treatments I and II. The effect of seasonal irrigation depth on the propor-tion of quality grades of the harvested crop is not unambiguous. In potatoes in the year 2003 with low precipitation as well as in 2004 the propor-tion of marketable product (tubers > 5 cm in di-ameter) was much higher in treatments I and II than in treatments III and IV. In 2005 the highest proportion of marketable tubers was recorded in treatment I while there were not any marked dif-ferences between the other treatments (Table 5). The same situation was in cauliflower with the proportion of the quality grade “choice” in total yield (Table 6). In 2003 the proportion of quality grades of cabbage heads (Table 7) was adversely influenced in treatments I and II by bursting of heads caused by the late termination of irrigation. In 2004 and 2005 the seasonal irrigation depth did not significantly influence the proportions of cabbage head quality grades. In all treatments the proportion of choice quality was > 90%, in 2004 in treatments I and II it was even 100%. In
all years the differentiation of seasonal irrigation depths in celery had a great influence on root yield but a small influence on the proportion of quality grades of the crop (Table 8). A significant reduction in the proportion of quality grade I roots was recorded only in treatment IV in 2005 – by about 20% compared to treatments I and II. In treatments III and IV celery roots and cabbage heads were smaller compared to treatments I and II, but their quality was high.
Based on the influence on marketable yield and proportion of the crop quality grades it is possi-ble to determine the optimum threshold suction pressure on light loamy-sand soils to be 30 kPa in early potatoes, late cauliflower and cabbage and 15 kPa in celery. 80% of available soil water capacity (ASWC) corresponds to the threshold suction pressure 30 kPa, and as much as 96% of ASWC corresponds to 15 kPa (Table 1).
[image:7.595.62.540.101.342.2]A possibility of comparing threshold suction pressures with their values reported in literature is very scarce for vegetables. KEMBLE and SAND-ERS (http://www.aces.edu/pubs/docs/A/ANR-1169) or SANDERS (http://www.nscu.edu/depts/hort/ hil/hil-33-e.html) reported the threshold suction pressure of 35 kPa for potatoes (Irish potato), 34 kPa for cabbage and cauliflower, and 25 kPa for Table 4. Theoretical and actual seasonal irrigation depths (SID)
Crop Year TheoreticalSID (mm) Real SID (mm)
according to BC according to ETc treatment I treatment II treatment III treatment IV
Early potatoes
2003 205 269 176 100 28 0
2004 117 195 134 85 60 0
2005 124 173 151 125 57 20
Late cauliflower
2003 470 206 231 199 147 125
2004 318 137 185 127 100 78
2005 202 120 165 154 123 115
Early cabbage
2003 238 176 146 135 77 38
2004 167 138 129 93 61 50
2005 123 120 80 70 48 44
Celery
2003 712 426 278 186 66 28
2004 376 264 155 127 117 43
2005 255 206 126 108 47 47
celery. However, THOMAS et al. (1970) recorded the highest yields of cabbage at the threshold suction pressure of soil water in the upper 61 cm amounting to 80–160 kPa. Yields decreased after its value 360 kPa was reached. Compared to the results of our experiments, these values are too high. In the soil conditions of experimental plot a statistically significant depression of cabbage yield occurred at the suction pressure of water 30 kPa (Table 5). Optimum threshold suction pressures of soil water for potatoes reported in literature usually range from 20 to 60 kPa (VAN LOON 1981; ZAVADIL 2000; SHOCK et al. 2001; WILSON et al.
[image:8.595.64.532.101.550.2]2001; KANG et al. 2004; SHOCK 2004). Compared to the optimum threshold suction pressures of soil water cited in literature the values we measured were usually somewhat lower. It can probably be explained by different hydrophysical properties of soil. The plots where experiments were conducted in other countries had heavier soils with higher field capacity than on our experimental plot. The effect of cultivar probably played its role in pota-toes. In our experiment we used an early cultivar unlike the experiments conducted abroad. ASWC corresponding to pre-irrigation suction pressures of soil water for crops used in the experiment are Table 5. Yields of early potatoes
Year Treatment Parameter Tuber size (cm) Total
< 3 3 to 5 > 5
2003
I. yield (t/ha) 3.3 9.7 57.3 70.2
proportion (%) 4.7 13.8 81.6 100.0
II. yield (t/ha) 1.1 6.0 49.2 56.3
proportion (%) 2.0 10.6 87.3 100.0
III. yield (t/ha) 2.0 11.7 16.9 30.5
proportion (%) 6.5 38.3 55.2 100.0
IV. yield (t/ha) 3.1 12.5 8.3 23.8
proportion (%) 12.9 52.3 34.8 100.0
2004
I. yield (t/ha) 1.1 20.7 60.0 81.8
proportion (%) 1.4 25.3 73.3 100.0
II. yield (t/ha) 0.3 22.7 60.5 83.4
proportion (%) 0.3 27.2 72.5 100.0
III. yield (t/ha) 0.0 22.2 45.9 68.1
proportion (%) 0.0 32.6 67.4 100.0
IV. yield (t/ha) 10.1 13.4 18.4 41.8
proportion (%) 24.1 32.0 44.0 100.0
2005
I. yield (t/ha) 1.1 19.2 49.4 69.7
proportion (%) 1.6 27.5 70.9 100.0
II. yield (t/ha) 2.4 22.8 40.5 65.6
proportion (%) 3.6 34.7 61.7 100.0
III. yield (t/ha) 1.0 18.4 38.6 58.0
proportion (%) 1.7 31.8 66.5 100.0
IV. yield (t/ha) 1.0 18.3 28.3 47.5
mostly higher than ASWC reported in literature. The reasons are likely the same as in threshold suc-tion pressures of soil. E.g. KEMBLE and SANDERS (http://www.aces.edu/pubs/docs/A/ANR-1169) or SANDERS (http://www.nscu.edu/depts/hort/hil/hil-33-e.html) reported 70% ASWC for potatoes and celery and 60% for cabbage and cauliflower, ČSN 75 0434 (1994) 60–70% for early potatoes but only 40% for late potatoes before flowering and 50% after flowering, SLÁMA (1972) 60% for medium-early potatoes, NOVOTNÝ et al. (1990) 75–80% for cabbage and 80% for celery in the period of inten-sive growth of celery root. According to RYBÁČEK
et al. (1988) ASWC in potatoes is related to the
importance of irrigations in their developmental period. It is about 40% in an important period, 66% in a critical period and as much as 80–90% in a very critical period. KING and STARK (1997) drew a conclusion that in general the content of available soil water should be maintained between 65% and 85% (in relation to developmental stage) during the active growth period in order to achieve optimum potato yields.
[image:9.595.65.535.100.550.2]The seasonal irrigation depths determined on the basis of soil moisture balance, in which the crop evapotranspiration (ETc) is calculated either according to FAO 56 (ALLEN et al. 1998) or by the biological curve method (SLÁMA 1969), are Table 6. Yields of late cauliflower
Year Treatment Parameter Quality grade Total
choice 1st quality 2nd quality non-standard
2003
I. yield (t/ha) 37.0 3.5 0.7 0.3 41.5
proportion (%) 89.2 8.3 1.7 0.8 100.0
II. yield (t/ha) 38.5 2.9 1.1 0.4 42.8
proportion (%) 90.0 6.7 2.5 0.8 100.0
III. yield (t/ha) 26.4 5.0 1.1 0.8 33.4
proportion (%) 79.2 15.0 3.3 2.5 100.0
IV. yield (t/ha) 14.4 4.1 3.3 1.8 23.6
proportion (%) 60.8 17.5 14.2 7.5 100.0
2004
I. yield (t/ha) 25.7 2.6 2.6 3.4 34.3
proportion (%) 75.0 7.5 7.5 10.0 100.0
II. yield (t/ha)proportion (%) 28.478.3 13.34.8 2.15.8 0.92.5 100.036.3
III. yield (t/ha)proportion (%) 18.863.3 16.75.0 10.83.2 2.79.2 100.029.7
IV. yield (t/ha)proportion (%) 15.663.3 12.53.1 15.83.9 2.18.3 100.024.6
2005
I. yield (t/ha) 29.3 2.4 1.9 3.4 37.0
proportion (%) 79.2 6.6 5.0 9.2 100.0
II. yield (t/ha) 24.0 6.5 3.1 3.4 36.9
proportion (%) 65.0 17.5 8.3 9.2 100.0
III. yield (t/ha) 23.4 8.5 1.8 2.7 36.5
proportion (%) 64.2 23.3 5.0 7.5 100.0
IV. yield (t/ha) 21.9 7.3 1.4 3.1 33.8
substantially different from the really achieved irrigation depths in the treatments where optimal suction pressure is maintained (Table 4). For pota-toes, the really achieved values of seasonal irriga-tion depths are nearer to the depths calculated by the BC, while for the other vegetables (cauliflower, cabbage and celery) they are more similar to the depths calculated by FAO 56 methodology. The theoretical irrigation depths calculated by the BC method sometimes differ substantially from those based on FAO 56. These differences are at maxi-mum for cauliflower and celery and at minimaxi-mum for Table 7. Yields of early cabbage
Year Treatment Parameter Quality grade Total
choice 1st quality non-standard
2003
I. yield (t/ha)proportion (%) 25.734.2 21.929.2 27.636.7 100.075.2
II. yield (t/ha)proportion (%) 16.923.3 21.229.2 34.447.5 100.072.5
III. yield (t/ha)proportion (%) 20.09.2 26.156.7 10.723.3 100.046.0
IV. yield (t/ha)proportion (%) 0.41.7 21.793.3 1.25.0 100.023.3
2004
I. yield (t/ha)proportion (%) 100.090.6 0.00.0 0.00.0 100.090.6
II. yield (t/ha)proportion (%) 100.085.3 0.00.0 0.00.0 100.085.3
III. yield (t/ha)proportion (%) 73.297.5 1.92.5 0.00.0 100.075.1
IV. yield (t/ha)proportion (%) 69.095.8 2.43.3 0.60.8 100.072.0
2005
I. yield (t/ha)proportion (%) 46.497.5 0.40.8 0.81.7 100.047.6
II. yield (t/ha)proportion (%) 44.196.7 1.12.5 0.40.8 100.045.6
III. yield (t/ha)proportion (%) 27.490.8 0.00.0 2.89.2 100.030.2
IV. yield (t/ha)proportion (%) 27.594.2 0.00.0 1.75.8 100.029.2
coef-ficients, would be a necessary precondition for any future sound use of the BC method for crop irriga-tion management. For a more exact determinairriga-tion of the BC coefficients, it would be necessary to
re-Potatoes 0 100 200 300 400
1/4 6/4 11/4 16/4 21/4 26/4 1/5 6/5 11/5 16/5 21/5 26/5 31/5 5/6 10/6 15/6 20/6 25/6 30/6 5/7 10/7 15/7 20/7 25/7
ETc
(mm)
364.0 335.8
335.0 Cauliflower 0 100 200 300 3/ 7 9/ 7 15 /7 21 /7 27
/7 2/8 8/8
14
/8
20
/8
26
/8 1/9 7/9
13 /9 19 /9 25 /9 1/ 10 7/ 10 ETc (m m ) 278.2 251.7 211.0 Cabbage 0 100 200 300 20 /4 26
/4 2/5 8/5
14
/5
20
/5
26
/5 1/6 7/6
13
/6
19
/6
25
/6 1/7 7/7
13 /7 19 /7 ETc (m m ) 244.7 279.6 199.9 Celery 0 200 400 600 29
/4 8/5
17
/5
26
/5 4/6
13
/6
22
/6 1/7
10
/7
19
/7
28
/7 6/8
15
/8
24
/8 2/9
[image:11.595.110.501.83.675.2]11 /9 20 /9 29 /9 ETc (m m ) 2003 2004 2005 560.2 451.6 404.8
Figure 4. Mass curves of actual evapotranspiration (ETc )
evaluate the archival data on irrigation experiments carried out in the 1950’s and in the first half of the 1960’s. Some supplementary experiments might also be needed. It might be difficult to find funding ETc (m m ) ETc (m m ) ET c (m m ) ET c (m m ) Celery 0 200 400 600
and capacity for this undertaking. Therefore, it is only little probable that the coefficients could be improved at all.
CONCLUSIONS
On the basis of the results of field experiments, it is possible to estimate the optimum threshold suction pressure on light loamy-sand soils as 30 kPa for early potatoes, late cauliflower and cabbage and 15 kPa for celery. The seasonal irrigation depths, if the irrigation management is controlled by soil
suction, are lower than those calculated by the FAO 56 method (ALLEN et al. 1998). Therefore, the crop irrigation management by means of suc-tion sensors can bring about important savings of irrigation water while high marketable yields of the crops are achieved.
[image:12.595.63.533.104.579.2]Taking into account the incorrectly estimated coefficients of biological curves of some crops and, on the other hand, reasonable prices of automated weather stations, the use of the FAO 56 method is recommended if the soil water balance is to be taken as the basis of irrigation management. Table 8. Yields of celery
Year Treatment Parameter Quality grade Total
1st quality 2nd quality non-standard
2003
I. yield (t/ha)proportion (%) 39.971.7 13.023.3 2.85.0 100.055.7
II. yield (t/ha)proportion (%) 23.575.0 24.27.6 0.30.8 100.031.3
III. yield (t/ha)proportion (%) 16.485.8 13.32.5 0.20.8 100.019.1
IV. yield (t/ha)proportion (%) 10.975.8 22.53.2 0.21.7 100.014.4
2004
I. yield (t/ha)proportion (%) 50.285.8 10.86.3 2.03.3 100.058.4
II. yield (t/ha)proportion (%) 44.081.7 11.76.3 3.66.7 100.053.9
III. yield (t/ha)proportion (%) 38.396.7 1.02.5 0.30.8 100.039.6
IV. yield (t/ha)proportion (%) 13.479.2 1.48.3 12.52.1 100.017.0
2005
I. yield (t/ha)proportion (%) 43.796.7 0.81.7 0.81.7 100.045.2
II. yield (t/ha)proportion (%) 28.394.2 0.51.7 1.34.2 100.030.0
III. yield (t/ha)proportion (%) 21.389.2 2.29.2 0.41.7 100.023.8
References
ALLEN R.G., PEREIRA L.S., RAES D., SMITH M. (1998): Crop evapotranspiration. FAO Irrigation and Drainage Paper No. 56.
ČSN 75 0434 (1994): Supplementary irrigation water requirements. Český normalizační institut, Praha. (in Czech)
ČSN 46 3120 (1995): Fresh Vegetables – Root Vegetables. Český normalizační institut, Praha. (in Czech) ČSN 46 3112 (2000): Cauliflower. Český normalizační
institut, Praha. (in Czech)
ČSN 46 3113 (2000): Head Cabbage and Head Savoy Cab-bage. Český normalizační institut, Praha. (in Czech) CURWEN D., MASSIE L.R. (1994): Irrigation Management
in Wisconsin – the Irrigation Scheduling Program (WISP). University of Wisconsin – Extension, A3600: 1–12. http://cecommerce.uwex.edu/pdfs/A3600.PDF, accessed 25 June 2006.
KANG Y., WANG F.-X., JUAN B.-Z., LIU H.-J., JUAN B.Z. (2004): Potato evapotranspiration and yield under different drip irrigation regimes. Irrigation Science, 23: 133–143.
KING B.A., STARK J.C. (1997): Potato Irrigation. Univer-sity of Idaho Cooperative Extension System, 789:1-16. (http://info.ag.uidaho.edu/resources/PDFs/BUL0789. pdf, accessed 15 June 2006)
KOHUT M. (1996): System AVISO. Úroda, 6: 15. (in Czech)
KUDRNA K. (1987): Exploitation of irrigation systems. SZN, Praha, 139–151. (in Czech)
MARTINS F. (2000): Irrigation methods of the potato in Europe. In: Management of Nitrogen and Water in Potato Production. Wageningen Prer, Wageningen, 233–249.
NĚMEČEK J. et al. (1967): Survey of agricultural soils of the ČSSR. Volume 1. Methodology of field survey and of drawing up field maps, cartograms and accompanying reports. Genetic-agronomic classification of soils of the CSSR. MZVž Praha. (in Czech)
NĚMEČEK J. et al. (2001): Taxonomic classification sys-tem of soils of the Czech Republic. ČZU Praha. (in Czech)
NOVOTNÝ M. et al. (1990): Irrigation of field and special crops. Príroda, Bratislava. (in Czech)
RYBÁČEK V. et al. (1988): Potatoes. SZN Praha. (in Czech)
SANFORD S. (2003): Low-cost energy conservation: Irri-gation and crop storage facilities. http://s142412519. onlinehome.us/uw/pdfs/A3784-8.PDF, accessed 13 June 2006.
[image:13.595.62.540.100.342.2]SHOCK C.C. (2004): Water and fertilizer management in potato production. http://www.cropinfo.net/crops/po-tato.htm, accessed 20 June 2006.
Table 9. Statistical evaluation of yields on a significance level α = 0.05
Crop Year Compared treatments
I and II I and III I and IV II and III II and IV III and IV
Early potatoes
2003 ** *** *** *** *** **
2004 * *** *** *** *** ***
2005 * *** *** ** *** ***
Late cauliflower
2003 * *** *** ** *** ***
2004 * *** *** *** *** ***
2005 * * ** * ** *
Early cabbage
2003 * *** *** *** *** ***
2004 ** *** *** *** *** *
2005 * *** *** *** *** *
Celery
2003 *** *** *** *** *** ***
2004 ** *** *** *** *** ***
2005 *** *** *** *** *** *
SHOCK C.C., ELDREDGE E.P., SAUNDERS L.D., FEIBERT E.G.B. (2001): Optimum soil water potential and drip tape position for potato (Solanum tuberosum L.) drip irrigation. American Journal of Potato Research, 78: 482.
SLÁMA V. (1969): Setting up irrigation schedules of agri-cultural crops. Volume III. Graphical method. ÚVTIZ 1/1969. (in Czech)
SLÁMA V. (1972): The biological curve of water requi-rements of medium early potatoes. VÚZH Bratislava. [Final report.] VÚZH Bratislava. (in Czech)
SLAVÍK L. (1980): Differentiated irrigation scheduling of field crops based on the prognosis of water requirements. Proc.eedings of the Czech University of Agriculture in Prague, Faculty of Agronomy, series A, 32: 221–231. (in Czech)
SPECTY R. (2006): How farmers use information obtai-ned from advisory services in France. http://www.fao. org/docrep/W4367E/w4367e07.htm, accessed 2 June 2006.
THOMAS J.R., NAMKEN L.N., BROWN R.G. (1970): Yield of cabbage in relation to nitrogen and water supply. Journal of the American Society of Horticultural Science, 95: 732–735.
TRÁVNÍK K., ZBÍRAL J., NĚMEC P. (1999): Agrochemical testing of agricultural soils. The Mehlich III method. ÚKZÚZ, Brno. (in Czech)
VAN GENUCHTEN M.TH. (1980): A closed-form equation for predicting the hydraulic conductivity of unsatura-ted soils. Soil Science Society of America Journal, 44: 892–898.
VAN LOON C.D. (1981): The effect of water stress on po-tato growth, development, and yield. American Popo-tato Journal, 58: 51–69.
WILSON C.R., PEMBERTON B.M., RANSOM L.M. (2001): The effects of irrigation strategies during tuber initia-tion on marketable yield and development of common scab disease of potato in Russet Burbank in Tasmania. Potato Research, 44: 243–251.
WOLFF P., HUEBENER R., STEIN TH.M. (1996): Germany’s Irrigation Sector under Conditions of Restricted Water Allocation. University of Kassel.
ZAVADIL J. (2000): Water-saving supplementary irriga-tion of early potatoes. Rostlinná výroba, 46: 495–500. (in Czech)
http://www.amet.cz/, accessed 15 june 2006.
http://weather.nmsu.edu/wcc202/, accessed 15 June 2006.
http://www.emsbrno.cz, accessed 15 June 2006.
http://www.irrometer.com/agcat.htm, accessed 15 June 2006.
http://www.aces.edu/pubs/A/ANR-1169/, accessed 20 March 2006.
http://www.ces.ncsu.edu/depts/hort/hil/hil-33-e.html, accessed 26 June 2006.
Corresponding author:
Ing. JOSEF ZAVADIL, CSc., Výzkumný ústav meliorací a ochrany půdy, Žabovřeská 250, 156 27 Praha 5-Zbraslav, Česká republika