ESCHERICHIA COLI, POULTRY, AND PRECIPITATION: A WATERSHED STORY
Ryan Eric Leighton
A thesis submitted to the faculty at the University of North Carolina at Chapel Hill in partial fulfillment of the requirements for the degree of Master of Science in the Department of
Environmental Sciences & Engineering in The Gillings School of Global Public Health.
Chapel Hill 2018
Approved by:
Jill R. Stewart Rachel T. Noble Michael E. Emch
ii
© 2018 Ryan Eric Leighton ALL RIGHTS RESERVED
iii ABSTRACT
Ryan Eric Leighton: Escherichia coli, Poultry, and Precipitation: A Watershed Story (Under the direction of Jill Stewart)
Industrial poultry production in concentrated animal feeding operations (CAFOs) in North Carolina has grown rapidly, with North Carolina now ranked nationally as a top poultry producer. The Yadkin-Pee Dee River Basin harbors the highest density of poultry production among North Carolina river basins. This study examined the effect of poultry CAFOs on water quality in the Yadkin-Pee Dee River Basin by comparing watersheds with CAFOs (n=5) to those without CAFOs (n=4). In partnership with Yadkin Riverkeeper, we collected surface water samples during both dry weather and wet weather events, for a total of 36 samples analyzed. Each sample was evaluated for Escherichia coli concentrations and antibiotic resistance profiles. Few E. coli isolates were antibiotic resistant. A multiple linear
regression indicated presence of poultry CAFOs resulted in higher E. coli concentrations compared to background sites and that every 1-mm increase in precipitation resulted in higher E. coli concentrations.
iv
ACKNOWLEDGEMENTS
I would like to acknowledge the following people who made this study possible:
First, I would like to thank Elizabeth Christenson for all her guidance and assistance during study design, laboratory processes and scientific writing. I would also like to thank everyone in the Stewart lab, especially Lindsay Wickersham and Rachel Lempp for their help, attention to detail and support. I also want to thank my undergraduate research assistants, whose dedication made my lab work flow – Pooja Naik, Maggie Lucas and Maddy Ponder.
I would also like to thank Lorin Bruckner for assisting in data visualization, specifically with using Tableau® software.
I would like to acknowledge the incredible support of my thesis committee: Dr. Jill Stewart, Dr.
Rachel Noble, and Dr. Michael Emch. I am extremely grateful for my research advisor and mentor, Dr. Jill Stewart. Dr. Stewart, thank you so much for your patience, feedback, support and expertise.
I would like to thank the staff at Yadkin Riverkeeper for their partnership, collaboration, and support of the project. A special thank you to Brian Fannon who worked closely with me and for his time in taking water samples.
Finally, I would like to thank family and friends for all their love and support throughout this entire year. You all have made a huge difference and impact!
v
TABLE OF CONTENTS
LIST OF TABLES……….………..……… vi
LIST OF FIGURES………. vii
LIST OF ABBREVIATIONS AND SYMBOLS………..……….…… viii
CHAPTER 1: INTRODUCTION……….…………. 1
CHAPTER 2: OBJECTIVES………..……. 5
CHAPTER 3: REVIEW OF LITERATURE……….6
CHAPTER 4: METHODS………. 13
CHAPTER 5: RESULTS………..18
CHAPTER 6: DISCUSSION………. 31
CHAPTER 7: CONCLUSION ……… 36
REFERENCES………. 37
vi LIST OF TABLES
Table 1. 95% mean E. coli concentrations on each sample date……… 22 Table 2. 95% mean E. coli concentrations of each sample site……… 23 Table 3. Antibiotic resistance in E. coli isolates………...…………24 Table 4. Mean two-day antecedent precipitation (mm) of and during sampling event, and
corresponding E. coli concentration……….………25 Table 5. Stream discharge (m3/s) and its corresponding E. coli concentration on each sample date……...26 Table 6. Predicted mean E. coli concentration by a multiple linear regression analysis……… 29 Table 7. Multiple linear regression analysis statistics………..… 30 Table 8. Multiple linear regression fitted model……….30
vii
LIST OF FIGURES
Figure 1. Overview of Yadkin-Pee Dee River Basin………15
Figure 2. Sample locations……….………….……….……….………15
Figure 3. Mean E. coli (CFU/100 mL) per sample date……….………..21
Figure 4. Mean E. coli (CFU/100 mL) per sample type………….……….……….……….. 23
Figure 5. Correlation between mean E. coli (CFU/100 mL) and precipitation (mm)………..…….…………...24
Figure 6. Total two-day antecedent rainfall (in) of and during sampling event.…..………..…….25
Figure 7. Correlation between mean E. coli (CFU/100 mL) and stream discharge (m3/s)………..………26
Figure 8. Hydrographs depicting two-day antecedent stream discharge (m3/s) of and during sample event……….……… 27
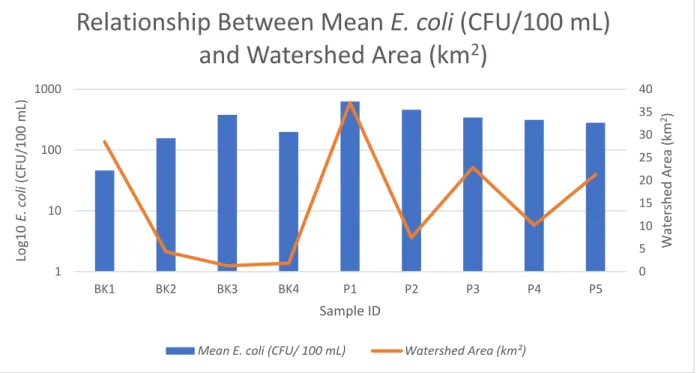
Figure 9. Relationship between mean E. coli (CFU/100 mL) and watershed area (km2)………..……..28
Figure 10. Correlation between mean E. coli (CFU/100 mL) and watershed area (km2)………..…. 28
viii
LIST OF ABBREVIATIONS AND SYMBOLS
AFO Animal Feeding Operation
BK Background
CAFO Concentrated Animal Feeding Operation
CFU Colony Forming Unit
CI Confidence interval
DL Detection limit
E. coli Escherichia coli
FIB Fecal Indicator Bacteria
FIO Fecal Indicator Organism
Km Kilometer
mL Milliliter
MLR Multiple Linear Regression
P Poultry
P P-value
PCR Polymerase Chain Reaction
1
CHAPTER 1: INTRODUCTION
A watershed is an area of land that drains rainwater or snow into a body of water like a stream, river or lake (United States Geological Survey, 2016). These surface waters make up about 80% of the water that is used daily and are important for drinking water, agriculture, and habitat for various plants and animals (National Ground Water Association, 2012). However, runoff pollution can degrade the quality of the watershed. Precipitation exacerbates runoff pollution by collecting various pollutants in surfaces and soils of the watershed and concentrating them in the surface waters (Parker et al., 2010).
Animal waste is a contributor to surface water pollution, and concentrated animal feeding operations (CAFOs) can be major contributors to water pollution if waste treatment is not handled properly (Mallin
& Cohoon, 2003).
Concentrated animal feeding operations (CAFOs) can house thousands of animals for food production, and these operations generate significant volumes of waste that require management and disposal (Hribar, 2010). There are currently an estimated 50 million chickens in the upper Yadkin-Pee Dee River Basin and these chickens collectively produce 1,000,000 tons of manure each year according to data from NRAES (1999) and Barker (1990) and calculations from Chastain et al. (2000) (Yadkin Riverkeeper). With poultry CAFOs, practices like reusing the waste for fertilizer for crops can lead to leaching of manure into watersheds, degrading the water quality (Burkholder et al., 2006; Fisher et al., 2005). Many microorganisms that can exist in watersheds from fecal runoff are sources of potential human health hazards, which is why tracking and monitoring fecal indicator organisms is of great public health importance.
2
Tools have been developed to track fecal contamination in the environment, including the use of fecal indicator bacteria. Escherichia coli, a type of fecal coliform bacteria that is found in the intestines of humans and animals, is commonly used as an indicator of human and/or animal fecal contamination in fresh water (Pitout et al., 2017; Centers for Disease Control and Prevention, 2018). E. coli is monitored as its presence is indicative of other potential pathogenic microbes that could be present in water (Edberg et. al., 2000). Due to antibiotic use in animal agriculture, monitoring antibiotic resistant E. coli is also of interest (Gustafson & Bowen, 1997). Antibiotic use remains common in food animal production and antimicrobial resistance from agricultural practices is a potential public health problem as humans can be exposed to antibiotic resistant pathogens by consumption of domesticated farm animals or coming into contact with the pathogens in the environment (Silbergeld et al., 2008). These resistant bacteria in animal waste, including Escherichia coli, can also end up in watersheds from runoff, and concentrations can potentially increase during precipitation events (Campagnolo et al., 2002: Harris et al., 2018; Hill et al., 2005).
Precipitation can further exacerbate microbial pollution by collecting and draining the
microorganisms into the nearest body of water. Previous studies have shown microbial concentrations were directly correlated with increased rainfall and streamflow (Lipp et. al, 2001; Shehane et al., 2005).
A study conducted by Noble et al. (2003) also found E. coli concentrations greatly increased after heavy precipitation events. However, many public health studies have focused on beach water quality after storm events, which leaves the potential impacts of precipitation on many inland watersheds unknown.
Tornevi et al. (2014) found that rainfall led to higher concentrations in a freshwater river and concluded that precipitation is a main contributor to fluctuating water quality. The location of poultry CAFOs in watersheds and near creeks, streams, rivers or lakes can make these bodies of water vulnerable to microbial pollution, especially during heavy precipitation events (Wing et al., 2002).
3
Studies and reviews have been conducted to examine how poultry CAFO waste can affect the chemical and biological parameters of water quality by nutrient and pathogen contamination. Nutrients such as nitrogen and phosphorus have been found in large quantities in poultry waste, with chicken waste having the highest amount of nitrogen and phosphorus of animal waste (Mallin and Cahoon, 2003; Martin and Gershuny, 1992). Poultry waste runoff can lead to influxes of nitrogen and phosphorus into a body of water, causing eutrophication. Eutrophication, along with warmer temperatures,
encourages algal bloom growth, causing removal of oxygen from the water (hypoxia) as the algae grow exponentially, thus reducing water quality. Human zoonotic pathogens have been found in chicken litter, and human health can be negatively impacted by ingestion of pathogens from this litter from contaminated recreational or drinking-waters, with symptoms such as abdominal cramps, bloody diarrhea and vomiting(Rogers and Haines 2005; Craun et al. 2010; Dale et al. 2010; USEPA 2013; Mayo Clinic, 2018). North Carolina specifically is one of the top producing poultry states in the United States, and the impact of its poultry CAFOs on microbial water quality and how precipitation can affect watershed water quality needs to be assessed.
North Carolina is ranked nationally as the number four broiler chicken producer, and number three in total poultry production (North Carolina Poultry Federation, 2018). The upper Yadkin-Pee Dee River Basin has the highest poultry production in the state, with an estimated 50 million chickens (Yadkin Riverkeeper). These chickens collectively produce an estimated 1,000,000 tons of manure each year, which consequently can leach into the Yadkin-Pee Dee River Basin and surrounding environment in North Carolina, potentially decreasing water quality (Environmental Working Group, 2016). While several studies have examined fecal contamination from CAFOs (Campagnolo et al., 2002; Burkholder et al., 2007), including in eastern North Carolina’s coastal basin and have considered effects of storm events (Burkholder et al., 1997; Mallin, 2000; Mallin et al., 1999), there has been a lack of research into poultry CAFOs affecting water quality in western North Carolina, specifically in the Yadkin-Pee Dee River
4
Basin, which is located largely in the piedmont region and is more susceptible to increased surface water runoff and erosion than the coastal region (Markewich et al., 1990). This study will address that gap in knowledge.
This research examines the E. coli concentrations and antibiotic resistance profiles in the Yadkin- Pee Dee River Basin in North Carolina and tests how precipitation events can influence E. coli
concentrations. The purpose of this study was to compare microbial water quality in watersheds that had poultry CAFOs upstream to background sites that lacked poultry CAFOs by assessing E. coli concentration and antibiotic resistance following dry periods and precipitation events. Validation of CAFO contamination during precipitation events could inform regulatory bodies like the state department of natural resources and the United States Environmental Protection Agency to increase their efforts in helping maintain water quality of environmental waters.
5
CHAPTER 2: OBJECTIVES
1. Measure and compare E. coli concentration in surface water sites with and without upstream poultry CAFOs.
2. Measure and compare the prevalence of antibiotic resistant E. coli in surface water sites with and without poultry CAFOs.
3. Evaluate the effect of precipitation on E. coli concentrations in the upper Yadkin-Pee Dee Watershed.
6
CHAPTER 3: REVIEW OF LITERATURE
Introduction
Fecal contamination of bodies of water can lead to waterborne illnesses and is detrimental to human health, with microbial contamination being a major cause. Concentrated animal feeding
operations (CAFOs) are a potential culprit to microbial water contamination, as animal waste from these operations can end up in streams, rivers and lakes, especially from rain events (Hribar, 2010). Fecal indicator bacteria (FIB) like Escherichia coli have been used to detect and determine the level of fecal contamination in environmental waters to protect the general population from water-related pathogens (USEPA 2006; USEPA Office of Water 2015). However, due to antibiotic use to protect animals from infection, CAFOs have consequently created antibiotic resistant bacteria including E. coli, which also can end up in the environment from animal waste (Hribar, 2010). One animal production industry, poultry, is of concern. The poultry industry in North Carolina is booming, with North Carolina being ranked
nationally as the number four broiler chicken producer, and number three in total poultry production (North Carolina Poultry Federation, 2018). The upper Yadkin-Pee Dee River Basin has the highest poultry production in the state, with an estimated 50 million birds in 2014 (Yadkin Riverkeeper). The goal of this review is to discuss existing literature on microbial water pollution from poultry CAFOs, including background of poultry CAFOs and their environmental health effects, E. coli’s role in monitoring water quality and the bacteria’s potential of acquiring antibiotic resistance, precipitation’s effect on water quality, and North Carolina’s place in the poultry production industry.
7 Poultry concentrated animal feeding operations
American agriculture has transitioned from family-owned small farming to large-scale corporate farming in the last century, with a few companies now producing most of the food animals (Macdonald and McBride, 2009). Today, production of these animals occurs in CAFOs, which are essentially large- scale industrialized agricultural factory farms. To qualify as a CAFO, a farming operation must first be considered an animal feeding operation (AFO) which is defined as: “a lot or facility where animals are kept confined and fed or maintained for 45 or more days per year, and crops, vegetation, or forage growth are not sustained over a normal growing period” (Hribar, 2010; USEPA, 2009). The benefit of CAFOs stem from being the operations being well managed, located and monitored as they can reduce cost of animal production and thus reduce consumer cost by increased efficiency in feeding and housing (Hribar, 2010). CAFOs are classified by type and number of animals, and by how they discharge their animal waste into the nearest body of water. There are size thresholds in considering a CAFO to be small, medium or large. For poultry, especially laying hens or broilers, the CAFO, (which has a liquid manure handling system) is considered large with 30,000 or more chickens, medium with 9,000 – 29,999, and small with 9,000 or less chickens (USEPA, 2009). The large number of animals means a large amount of waste, which is where most of the environmental health issues arise.
Poultry CAFO waste can have several types of contaminants like nutrients, pathogens, and antibiotics (Hribar, 2009). Previous studies have shown that poultry CAFOs have contaminated surrounding watersheds by runoff containing poultry litter (bedding contaminated with feces)
(Campagnolo et al., 2002; Mallin & Cohoon, 2003). Poultry litter can lead to degradation of water quality through chemical and microbial pollution. A study conducted by Harden (2015) found that watersheds that had swine and poultry CAFOs exhibited significantly greater nutrient contamination, including ammonium, nitrate and total N, compared to watersheds that lacked these operations. Stone et al.
(1995) also found a stream that had both swine and poultry CAFOs had elevated nutrient concentrations
8
during both dry and wet weather events compared to a nearby background stream that lacked these operations. Nutrients in poultry waste like nitrogen and phosphorus can contribute to eutrophication, which is when there are excessive amounts of nutrients in a body of water, and this leads to algal bloom growth which can be detrimental to local ecosystems (Slonczewski, 2016; United States Environmental Protection Agency, 2017).
A study conducted by Mallin et al. (2015) found that in eastern North Carolina, watersheds that contained both swine and poultry CAFOs did not meet NC water quality standards (NCDENR, 1999), as they exceeded the fecal coliform standard’s average of 200 CFU/100 mL for “5 consecutive samples during any 30-day period” and exceeded “400 CFU/100 mL in more than 20% of samples examined.” A high concentration of CFU/100 mL points to possible pathogen presence, and pathogens indicated by E.
coli can be harmful if ingested, potentially causing abdominal cramps, bloody diarrhea and vomiting
(Mayo Clinic, 2018). Human zoonotic pathogens have been found in chicken litter, like Escherichia coli O157:H7, Salmonella, Campylobacter, Cryptosporidium parvum, and Giardia lamblia, and thus have been consequently found in runoff and in surrounding watersheds according to a review conducted by the United States Environmental Protection Agency (USEPA) in 2013. A study conducted by Claire Hruby in Iowa found that some of these pathogens from poultry manure can survive weeks in soil, which means heavy precipitation events could also cause water contamination by collecting and discharging the slurry (soil and water mixture) into the nearest body of water.
Antibiotics are found in residual levels in waste, as they are used to ensure the animals can stay healthy in fighting off potential infection and, until recently, to promote growth (Marshall and Levy, 2011; Gustafson & Bowen, 1997). However, overuse of antibiotics has led to antibiotic resistance in pathogens like E. coli due to selective pressure, causing some treatments for infection to be ineffective (Kaufman, 2000; Martinez, 2008). In 2013 the Food & Drug Administration (FDA) announced a plan to phase out certain medical antibiotics that were used in livestock to curb antibiotic resistance (FDA,
9
2013). Tyson, the leading poultry producer in the country, has curtailed antibiotic usage, and the company notably claimed it would eliminate antibiotics important to human medicine in raising its poultry by 2017 (Meyer, 2017). Monitoring E. coli and its potential for antibiotic resistance is helpful in maintaining water quality and subsequently public health.
E. coli and its role in water quality
Escherichia coli is a gram-negative, rod-shaped type of fecal coliform bacteria that is found in
the intestines of humans and animals. Most strains are considered harmless to humans, but some strains produce Shiga-toxin, which can cause hemorrhagic diarrhea, and the serotype O157:H7 is the one most related to foodborne illnesses (The World Health Organization, 2018). E. coli is commonly used as a fecal indicator organism (FIO) of human and/or animal fecal contamination in fresh water (Pitout et al., 2017; Centers for Disease Control and Prevention, 2018). E. coli is monitored in water as its presence is indicative of other potential pathogenic microbes that could also be present (Edberg et. al., 2000). For E. coli to qualify as an FIO, it should ideally meet criteria according to The Routledge Handbook of Water
and Health (Bartram et al. 2015). Some of the criteria include:
• Being present whenever enteric pathogens are present
• Occurring in greater numbers than pathogens
• Broad applicably and detectability in all types of water that humans may encounter
• Specific to a fecal source with humans or animal species that share fecal-oral pathogens with humans
• Being inexpensively, reliably, rapidly, and distinctly detectable
• Being randomly distributed in a sample
While no one fecal indicator organism currently satisfies all the criteria under all circumstances, many regulatory agencies and scientists still consider E. coli and members of the fecal coliform group as the
10
best for microbial water quality testing (Tipton, 2017; USEPA, 2009). Due to high volumes of antibiotics used in animal agriculture, monitoring antibiotic resistant E. coli is also of interest (Gustafson & Bowen, 1997).
Some poultry CAFOs use antibiotics to prevent or treat diseases and, until recently, to promote growth, but this can create potential antibiotic resistance in bacteria like E. coli due to selective pressure (Gustafson & Bowen, 1997; Martinez, 2008). Antibiotic resistance occurs when the antibiotic kills most of the intended susceptible bacteria, but a small number that are naturally immune to the antibiotic survive and reproduce, creating a population of predominantly antibiotic resistant bacteria (CDC, 2018).
Antibiotic resistance has been an increasing public health issue in relation to CAFOs, as the use and overuse of antibiotics in animal feed has led to microbes becoming antibiotic resistant (Kaufman, 2000).
Animals like poultry do not completely metabolize the antibiotics and can still exist in their waste (Hriibar, 2010). One study tested antibiotic resistance of E. coli in fecal samples of turkeys, broilers, their famers and their slaughterers, and found that there was statistically significantly higher (p < 0.005) antibiotic resistance to ciprofloxacin, flumequine and neomycin as compared to laying hens that didn’t have high antibiotic usage (Boggard, 2001). A related study also found high prevalence of antibiotic resistance, but of Staphylococcus aureus in turkey (79%; 22/28) and chicken (26%; 6/23) isolates (Waters et al., 2011). Antibiotic resistance is not confined to poultry CAFOs but is a concern across industrial food animal production facilities. In 2007, Sapkota et al. (2007) analyzed surface water samples downstream of a swine CAFO and found statistically significant antibiotic resistance of erythromycin (p = 0.02) and clindamycin (p < 0.001) in enterococci. Christenson and Stewart (2018) also found higher antibiotic resistance in E. coli isolated from surface waters downstream of CAFOs compared to background watersheds (19% vs. 6%). Some studies have also noted higher levels of contamination following precipitation events.
11 Precipitation’s effect on water quality
Precipitation can further exacerbate CAFO waste leaching and microbial pollution by collecting and dumping the waste and microorganisms into the nearest body of water. Studies have shown
microbial concentrations are directly correlated with increased rainfall and streamflow (Lipp et al., 2001;
Shehane et al., 2005). A study conducted by Noble et al. (2003) found E. coli concentrations greatly increased after heavy precipitation events. Tornevi et al. (2014) found that rainfall led to higher E. coli concentrations in a freshwater river and that precipitation drives water quality’s variation. The location of poultry CAFOs in watersheds and near creeks, streams, rivers or lakes can make these bodies of water vulnerable to microbial pollution, especially during heavy precipitation events (Wing et al., 2002). High E. coli concentrations have also been found in the sediment of streams, rivers and lakes and a previous
study found increased E. coli concentrations into the water column due to resuspension of these sediments from rainstorms. (Kim et al., 2010). This is consistent with research conducted by Cho et al.
(2010) who observed sharp increases of fecal indictor bacteria after precipitation events from sediment.
Poultry Production in North Carolina
North Carolina is a top state in agricultural industry, with its poultry production being its leading agricultural income generator, making up ~ 40% of North Carolina’s agricultural income. Poultry
production has generated more than $34.4 billion for North Carolina’s economy, and has created more than 100,000 jobs. North Carolina ranks 2nd in the United States in turkey, 4th in broiler chicken and 8th in egg laying chicken production (Caruthers, 2016). The upper Yadkin-Pee Dee River Basin has the highest poultry production in the state, with an estimated 50 million chickens according to Yadkin Riverkeeper.
With all these chickens comes the amount of waste they produce, which is a mounting public health issue. These chickens collectively produce an estimated 1,000,000 tons of manure each year according to data from NRAES (1999) and Barker (1990) and calculations from Chastain et al. (2000). This poultry
12
manure consequently could leach into the Yadkin-Pee Dee River Basin and surrounding environment in North Carolina, potentially decreasing water and environmental quality downstream (Environmental Working Group, 2016).
13
CHAPTER 4: METHODS Sample Collection
Water samples were collected in the Yadkin-Pee Dee River Basin from late October to mid- November in 2017. Each sample was collected in a sterile 1 L sample bottle that was triple-rinsed, then filled with the sample water and capped. Nitrile gloves were worn for each sample collection to ensure no cross contamination. After the bottle was filled and re-capped, the sample bottles were immediately stored in a cooler on ice and transported back to the laboratory in Chapel Hill for processing. All samples were processed within 24-hrs of sample collection.
Nine samples were collected for each of four sampling events by the Yadkin Riverkeeper,
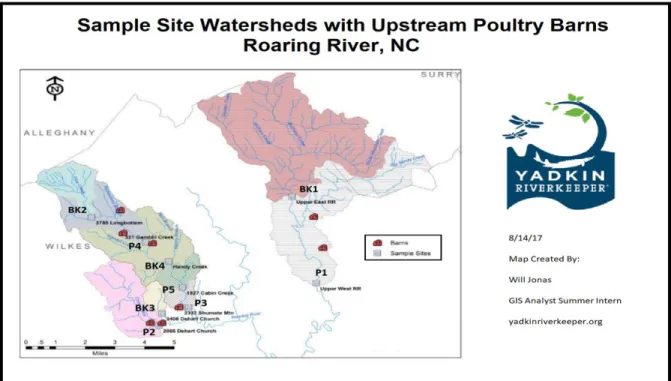
totaling 36 samples. Four of the nine samples (BK1-BK4; Figure 1) were taken from background sites that contained no CAFO upstream in the watershed, while the other 5 samples (Figure 1., P1-P5) were taken from watersheds that contained at least one poultry CAFO upstream based on Environmental Working Group (EWG) data for poultry barns (Environmental Working Group & Waterkeeper Alliance, 2016).
Background sites had primarily agricultural land use in their upstream contributing watersheds, although these watersheds did not contain any type of CAFO based on EWG data or other known point sources of potential contamination, such as wastewater treatment plants (Environmental Working Group &
Waterkeeper Alliance, 2016). Poultry sites are were situated in watersheds with a poultry CAFO located upstream in the watershed, and also did not have any other kind of CAFO or known point source.
Sample events on 10/24/17 (precipitation event A), 11/9/17 and 11/14/17 (precipitation event B) had measured precipitation in the two-days preceding sampling, and the last sampling event on 11/17/17 had no rainfall and is considered the closest to a baseline. Precipitation event A was the heaviest precipitation event (48 mm), with the 9 sample sites’ rainfall averaged together. The sampling
14
event that occurred during event A was during peak rainfall of this sampling period, as is confirmed by rainfall data obtained from USGS 02111391 near Wilkesboro, NC (Figure 5A). Precipitation event B on 11/9/17 was a lighter precipitation event and sampling also occurred during its peak rainfall of this sampling period (Figure 5B). The rainfall event on 11/14/17 was the lightest event (Figure 5C). The sample event on 11/17/17 (Figure 5D) was taken with no two-day antecedent rainfall, which is why the event is considered closest to a baseline water/stream discharge level.
15
Figure 1. The Yadkin-Pee Dee River Basin in North Carolina with existing poultry operations in 2014. The light blue box on map is approximately where this study’s sampling occurred.
Note: Map used in permission by Yadkin Riverkeeper.
Figure 2. Sample locations (courtesy of Yadkin Riverkeeper). Barns refer to CAFO locations that house food animals.
16 Sample Processing
For every sample collected, standard membrane filtration methods were used to quantify concentrations of E. coli from each water sample collected (United States Environmental Protection Agency, 2002). Processing and filtration occurred within 1 day after each sampling event. 50mL of each of the 9 samples was filtered onto its own membrane and repeated for 25mL, 5mL, and 1mL volumes and aseptically placed on 50 mm plates containing selective mTEC media (Sigma-Aldrich). The mTEC plates were inverted and incubated at 44 oC for 22 hr (+/- 2 hr). Plates were examined for colonies with morphological characteristics of E. coli as per manufacturer’s instructions. Plates that contained 20 to 80 colonies were counted, then summed and used to calculate concentrations of colony forming units (CFUs) per 100mL (United States Environmental Protection Agency, 2010). Up to five E. coli colonies per sample were then isolated, purified and confirmed through biochemical testing including indole
production with Kovacs Reagent (Acharya, 2017).
Antibiotic Resistance Testing
Antimicrobial resistance testing was conducted on all archived E. coli isolates using standard Kirby-Bauer disc diffusion methods on Mueller Hinton II agar (Sigma Aldrich) and following standard Clinical Laboratory and Standards Institute (CLSI) guidelines (Clinical Laboratory Standards Institute, 2014). Isolates were tested for resistance to eleven antibiotics (Table 3) in different antibiotic classes as recommended by The National Antimicrobial Resistance Monitoring Systemand CLSIguidelines,
including antibiotics used in industrial agriculture or in human medicine with risk assessment priority levels based on The World Health Organization criteria. (The Centers for Disease Control and Prevention, 2016; Clinical Laboratory Standards Institute, 2014; U.S. Food and Drug Administration, 2012 & 2015;
The World Health Organization, 2017).
17 Data and Statistical Analysis
Mean E. coli per 100 mL was calculated for each sample type, sample event and for all
background sites and poultry sites. Sample concentrations were calculated by counting E. coli colonies of the most countable plates (20-80 colonies) then calculating the proportionate number per 100 mL.
Then, the concentrations per sample type and sample event were averaged. 95% confidence intervals were calculated for each mean. Tableau® software was used to generate figures of 95% confidence intervals.
Precipitation data was collected using National Oceanic Atmospheric Administration’s (NOAA) Advanced Hydrologic Predictive Service. Precipitation data was aggregated from NOAA data for 2 days and 1 day prior to each sampling event and during sampling event (U.S. Department of Commerce et al., 2018). ArcGIS was used to extract precipitation data for each sampling location. Antecedent
precipitation to the sampling event graphs were recorded from USGS 02111391 near Wilkesboro, NC, with the USGS gauge being located 35-40 kilometers to the sampled watersheds (Figure 5) (U.S.
Geological Survey, 2018).
Stream discharge was recorded on the sampling date from USGS 02112250 Yadkin River at Elkin, NC, the USGS gauge located closest to the sampled watersheds, with the closest sampled site being around 24 kilometers from the gauge and the farthest sampled site being around 42 kilometers from the gauge (U.S. Geological Survey, 2018).
GraphPad Software was used to run unpaired Welch t-tests between background and poultry samples and Microsoft Excel’s Data Analysis package used for a simple linear regression model to examine how precipitation data and subsequently, stream discharge affect E. coli concentration. A multiple linear regression that included watershed area and precipitation to explain variations in E. coli was also conducted.
18
CHAPTER 5: RESULTS
E. coli concentration in background and poultry sites
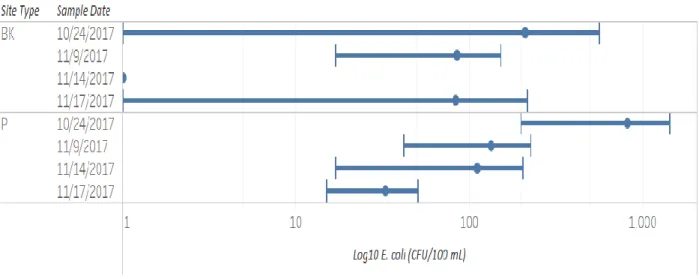
The highest mean E. coli concentrations for both background (BK) and poultry (P) sites were observed on the first sampling date on 10/24/17, with concentrations at BK sites averaging 210 CFU/100 mL (95% CI: [-124,554]) and concentrations at P sites averaging 813 CFU/100mL (95% CI: [199,1427]) (Figure 3 & Table 1). The mean E. coli concentrations on the other three sample days for both sample types were much lower {BK = 85 CFU/100 mL (95% CI: [-50,196]), P = 134 CFU/100 mL (95% CI: [42,226}
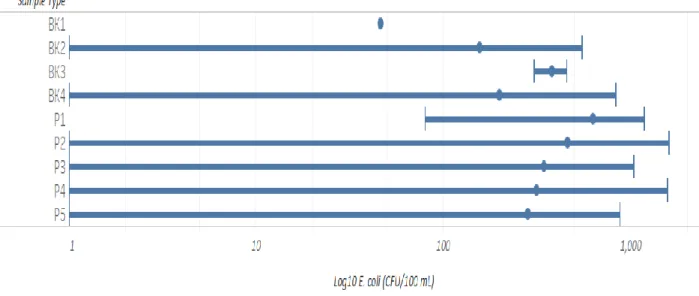
(Figure 3 & Table 1). E. coli concentration widely varied between sample type and site. Variation in mean E. coli concentrations were observed among sites, with sites P1 and P2 (627, 459 CFU/100 mL; 95% CI:
[80,1173], [-684,1601] respectfully) showing highest observed E. coli concentrations (Figure 4 & Table 2).
P1 had the highest mean concentration of E. coli of all poultry sites and background sites, with a mean concentration of 627 CFU/100 mL compared to other poultry sites with means that ranged from 281 to 459 CFU/100 mL and background sites that ranged from 46 to 380 CFU/100 mL. A Welch t test
comparing concentration differences between background and poultry samples revealed a two tailed P value equal to 0.07, so the difference in concentration was not quite statistically significant (P > 0.05).
The lack of significance is likely explained by a low number of samples and high variability of concentrations observed within samples.
Prevalence of antibiotic resistant E. coli in background and poultry sites
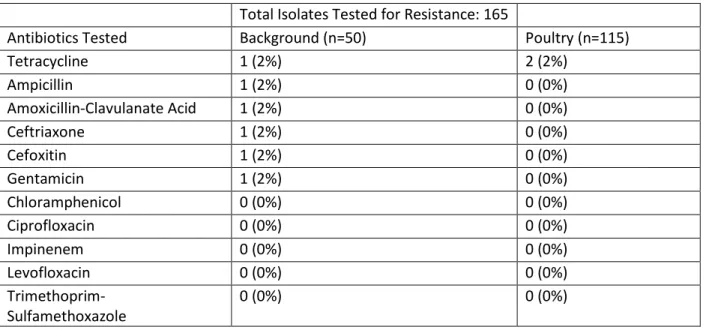
A total of 165 E. coli isolates were archived from sites with up to five isolates collected for each site for each sample time. A total of 165 isolates were tested for antibiotic resistance, and four of those were found to be resistant (2%) (Table 3). Two resistant isolates originated from poultry sites, with both isolates showing resistance to tetracycline. The other two resistant isolates originated from background
19
sites with one isolate resistant to tetracycline and the other isolate showing multi-drug resistance, with resistance to ampicillin, amoxicillin-clavulanate acid, ceftriaxone, cefoxitin and gentamicin.
Precipitation’s effect on E. coli concentration
Average precipitation was highest on 10/24/17 (Figure 5 & Table 4, 48mm), and this rain event (event A) was the largest precipitation event with the highest stream discharge rate (86 m3/s that was obtained from USGS 02112250 gauge on the Yadkin River at Elkin, NC) (Figure 7 & Table 5). The
antecedent rainfall that occurred about 18-hours prior to the event contributed to the rising limb of the stream flow/discharge of this sampling event (Figure 8A). The largest amount of precipitation and highest stream discharge rate corresponds to the highest mean E. coli concentration (Figure 5 & Table 4, 545 CFU/100 mL) of all sample dates. This event also exemplifies a big difference between background and poultry E. coli concentration, with poultry (Table 1, 813 CFU/100 mL) having a greater mean concentration of E. coli compared to background (Table 1, 210 CFU/ 100 mL). Precipitation event B on 11/14/17 was a smaller rain event compared to A, and the mean concentrations of both background and poultry E. coli decreased. There was a large drop-off in stream discharge between the first (event A, 86 m3/s) and second event (event B, 36 m3/s), which directly corresponds to the mean concentration of E.
coli dropping between the two events as well. Sampling event 11/17/17 was closest to a baseline level,
as no two-day antecedent precipitation occurred (zero mm of precipitation) and it had the lowest stream discharge (26 m3/s) compared to the other three events. Overall, rainfall had an effect size of 9.97 according to the regression; that is, for every 1 mm increase in rainfall, the concentration of E. coli increased by 9.97 CFU/100 mL. USGS 02111391 gauge’s precipitation graphs (Figure 6) displayed the two-day antecedent rainfall of and during the time of sampling, which confirmed the first three sampling events occurred during peak rainfall events of this sampling period, and the last sampling event was classified as a baseline level as zero mm of precipitation occurred during that sampling period.
20 Area’s effect on E. coli concentration
The watershed area of the nine different watersheds varied from 1.29 km2 to 37.08 km2. From a simple relationship graph, it appeared that an increase in area did not correlate with greater E. coli concentrations, except for site P1, which had the greatest area (37.08 km2) and the greatest E. coli concentration (627 CFU/100 mL) (Figure 9). However, a simple linear regression did show a positive correlation between area and E. coli concentration (Figure 10). A multiple linear regression (MLR) analysis concluded that precipitation did have an impact in predicting higher E. coli concentrations (X1), and that it did matter whether the watershed was a background or poultry site (X3), as these
coefficients were positive for the model: Y = -87.26 + 9.96(X1) -6.59(X2) + 369.16(X3). Area (X2) did not have a positive effect in predicting E. coli concentration in addition to precipitation based on this multiple linear regression analysis. Results of the MLR indicate that when controlling for precipitation and area, presence of poultry CAFO results, on average, resulted in higher E. coli concentrations compared to background sites by 369 CFU/100mL. When controlling for watershed type (presence of poultry) and area, every 1 mm increase in two-day antecedent precipitation results, on average, resulted in higher E. coli concentrations by 9.96 CFU/100mL (Table 7 & 8).
21
Figure 3. Mean E. coli concentrations (CFU/100 mL) on each sample date. Wings indicate 95%
confidence intervals (CI). If lower CI was <0, the lower limit was set to 1.01 (log scale). BK refers to
‘background site’ (no poultry CAFO upstream). P refers to ‘poultry site’ (with a poultry CAFO upstream).
11 samples (11/36) had E. coli counts that were either below or above the limit of detection (20 – 80 colonies per plate). Sample date 11/9/17 had 3/4 BK and 0/5 P samples above/below the limit of detection, sample date 11/14/17 had 4/4 BK samples and 1/5 P samples above/below the limit of detection, sample date 11/17/17 had 1/4 BK and 2/5 P samples above/below the limit of detection. E.
coli concentration is log scale
22
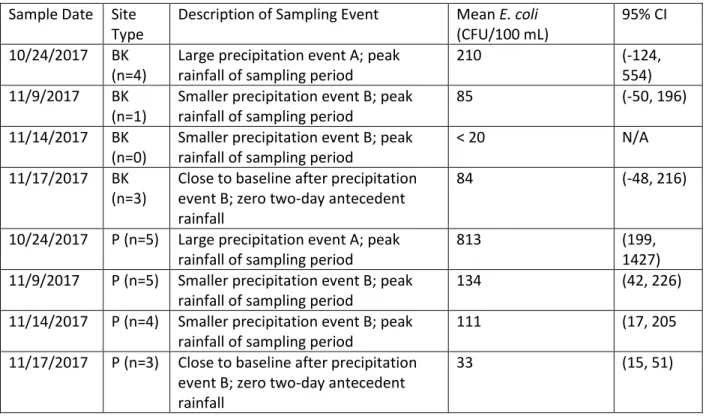
Table 1. 95% Mean E. coli concentrations (CFU/100 mL) on each sample date. BK refers to ‘background site’ (no poultry CAFO upstream). P refers to ‘poultry site’ (with a poultry CAFO upstream). 11 samples (11/36) had E. coli counts that were either below or above the limit of detection (20 – 80 colonies per plate). Sample date 11/9/17 had 3/4 BK and 0/5 P samples above/below the limit of detection, sample date 11/14/17 had 4/4 BK samples and 1/5 P samples above/below the limit of detection, sample date 11/17/17 had 1/4 BK and 2/5 P samples above/below the limit of detection.
Sample Date Site Type
Description of Sampling Event Mean E. coli (CFU/100 mL)
95% CI 10/24/2017 BK
(n=4)
Large precipitation event A; peak rainfall of sampling period
210 (-124,
554) 11/9/2017 BK
(n=1)
Smaller precipitation event B; peak rainfall of sampling period
85 (-50, 196)
11/14/2017 BK (n=0)
Smaller precipitation event B; peak rainfall of sampling period
< 20 N/A
11/17/2017 BK (n=3)
Close to baseline after precipitation event B; zero two-day antecedent rainfall
84 (-48, 216)
10/24/2017 P (n=5) Large precipitation event A; peak rainfall of sampling period
813 (199,
1427) 11/9/2017 P (n=5) Smaller precipitation event B; peak
rainfall of sampling period
134 (42, 226)
11/14/2017 P (n=4) Smaller precipitation event B; peak rainfall of sampling period
111 (17, 205
11/17/2017 P (n=3) Close to baseline after precipitation event B; zero two-day antecedent rainfall
33 (15, 51)
23
Figure 4. 95% Mean E. coli concentrations (CFU/100 mL) of each sample site. Wings indicate 95%
confidence intervals (CI). If CI <0, the lower limit was set to 1.01 (log scale). BK refers to ‘background site’ (no poultry CAFO upstream). P refers to ‘poultry site’ (with poultry CAFO upstream). 11 samples (11/36) had E. coli counts that were either below or above the limit of detection (20 – 80 colonies per plate). E. coli concentration is log scale.
Table 2. 95% Mean E. coli concentrations (CFU/100 mL) of each sample site. BK refers to ‘background site’ (no poultry CAFO upstream). P refers to ‘poultry site’ (with poultry CAFO upstream).
Sample Type Mean E. coli (CFU/ 100 mL) 95% CI
BK1 (n=1) 46 N/A
BK2 (n=2) 156 (-238, 550)
BK3 (n=2) 380 (304, 456)
BK4 (n=3) 198 (-435, 831)
P1 (n=3) 627 (80, 1173)
P2 (n=4) 459 (-684, 1601
P3 (n=4) 343 (-348, 1034)
P4 (n=2) 314 (-943, 1571)
P5 (n=4) 281 (-315, 877)
24 Table 3. Antibiotic resistance in E. coli isolates.
Total Isolates Tested for Resistance: 165
Antibiotics Tested Background (n=50) Poultry (n=115)
Tetracycline 1 (2%) 2 (2%)
Ampicillin 1 (2%) 0 (0%)
Amoxicillin-Clavulanate Acid 1 (2%) 0 (0%)
Ceftriaxone 1 (2%) 0 (0%)
Cefoxitin 1 (2%) 0 (0%)
Gentamicin 1 (2%) 0 (0%)
Chloramphenicol 0 (0%) 0 (0%)
Ciprofloxacin 0 (0%) 0 (0%)
Impinenem 0 (0%) 0 (0%)
Levofloxacin 0 (0%) 0 (0%)
Trimethoprim- Sulfamethoxazole
0 (0%) 0 (0%)
Figure 5. Simple linear regression between mean E. coli (CFU/100 mL) and precipitation (mm) on each sample date. Precipitation includes mean two-day antecedent rainfall prior to sample event and during sample event that was averaged between 9 samples on sample date. Data for mean E. coli (CFU/100 mL) per sample data was standardized, which excluded 11/36 samples. E. coli concentration is log scale.
1 10 100 1000
0 10 20 30 40 50 60
Log10 E. coli (CFU/100 mL)
Mean Two-Day Antecedent Rainfall of and During Sampling Event (mm)
Correlation Between Mean E. coli (CFU/100 mL) and Mean Precipitation (mm)
10/24/2017 11/9/2017 11/14/2017 11/17/2017 y = 9.9746x + 63.324
R2= 0.9924
25
Table 4. Mean two-day antecedent precipitation of and during sampling event, averaged across 9 sample locations for each sample date and its corresponding E. coli concentration.
Sample Date
Mean Two-Day Antecedent Rainfall of and During Sampling Event Across 9 Sample Sites (mm)
Mean E. coli (CFU/100 mL)
10/24/2017 48 545
11/9/2017 9 126
11/14/2017 2 111
11/17/2017 0 58
A. B.
C. D.
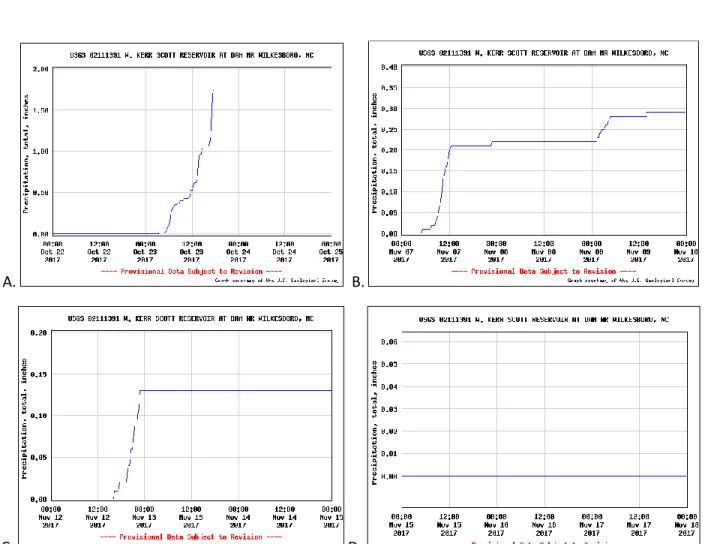
Figure 6. Recorded two-day antecedent rainfall (in) of and during sampling event from USGS 02111391 near Wilkesboro, NC. A. Sample date 10/24/17. Calculated average rainfall across the 9 sample sites was 1.89 in = 48 mm. B. Sample date 11/9/17. Calculated average rainfall across the 9 sample sites was 0.35 in = 9 mm. C. Sample date 11/14/17. Calculated average rainfall across the 9 sample sites was 0.079 in = 2 mm. D. Sample date 11/17/17. Calculated average rainfall across the 9 sample sites was 0 in = 0 mm.
Note: These graphs do not represent the actual aggregated precipitation data that was used for calculations but provide a visual of the overall rain events that occurred during each sampling event.
26
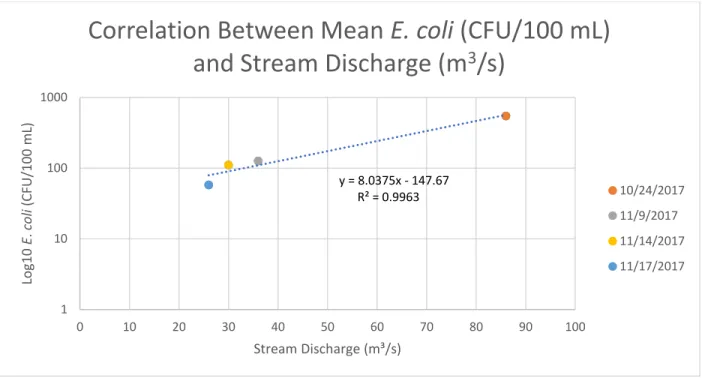
Figure 7. Simple linear regression between mean E. coli (CFU/100 mL) and stream discharge (m3/s) from USGS 02112250 Yadkin River at Elkin, NC. E. coli concentration is log scale.
Table 5. Stream discharge (m3/s) and its corresponding E. coli concentration on each sample date.
Sample Date
Stream Discharge (m³/s)
Mean E. coli (CFU/100 mL)
10/24/2017 86 545
11/9/2017 36 126
11/14/2017 30 111
11/17/2017 26 58
1 10 100 1000
0 10 20 30 40 50 60 70 80 90 100
Log10 E. coli(CFU/100 mL)
Stream Discharge (m³/s)
Correlation Between Mean E. coli (CFU/100 mL) and Stream Discharge (m
3/s)
10/24/2017 11/9/2017 11/14/2017 11/17/2017 y = 8.0375x - 147.67
R² = 0.9963
27
A. B.
C. D.
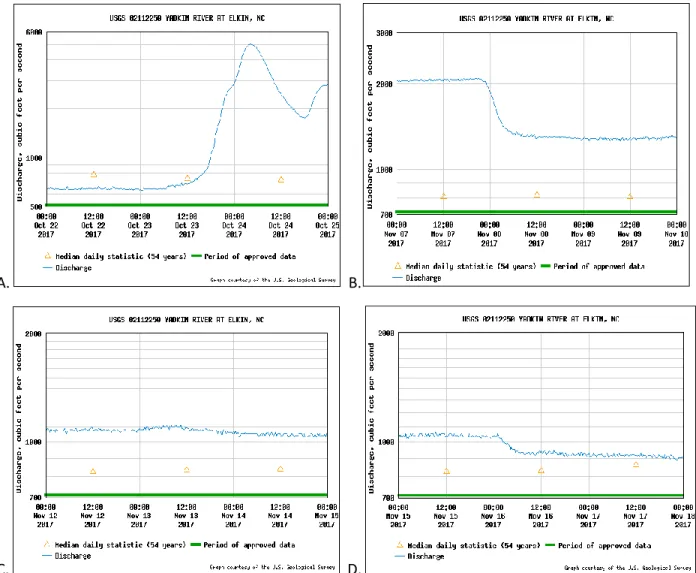
Figure 8. Hydrographs depicting two-day antecedent stream discharge (m3/s) of and during sampling event, from USGS 02112250 Yadkin River at Elkin, NC. A. Sample date 10/24/17. Recorded stream discharge at time of sampling was 3040 ft3/s = 86 m3/s. B. Sample date 11/9/17. Recorded stream discharge at time of sampling was 1280 ft3/s = 36 m3/s. C. Sample date 11/14/17. Recorded stream discharge at time of sampling was 1050 ft3/s = 30 m3/s. D. Sample date 11/17/17. Recorded stream discharge at time of sampling was 914 ft3/s = 26 m3/s.
28
Figure 9. Relationship between mean E. coli (CFU/100 mL) and watershed area (km2). E. coli concentration is log scale.
Figure 10. Simple linear regression between mean E. coli (CFU/100 mL) and watershed area (km2). E. coli concentration is log scale.
0 5 10 15 20 25 30 35 40
1 10 100 1000
BK1 BK2 BK3 BK4 P1 P2 P3 P4 P5
Watershed Area (km2)
Log10 E. coli (CFU/100 mL)
Sample ID
Relationship Between Mean E. coli (CFU/100 mL) and Watershed Area (km
2)
Mean E. coli (CFU/ 100 mL) Watershed Area (km²)
BK1 BK2
BK3 BK4
P2 P4 P3 P1
P5 y = 3.4087x + 260.48
R² = 0.0654
1 10 100 1000
0 5 10 15 20 25 30 35 40
Log10 E. coli (CFU/100 mL)
Watershed Area (km2)
Correlation Between Mean E. coli (CFU/100 mL) and Watershed Area (km2)
29
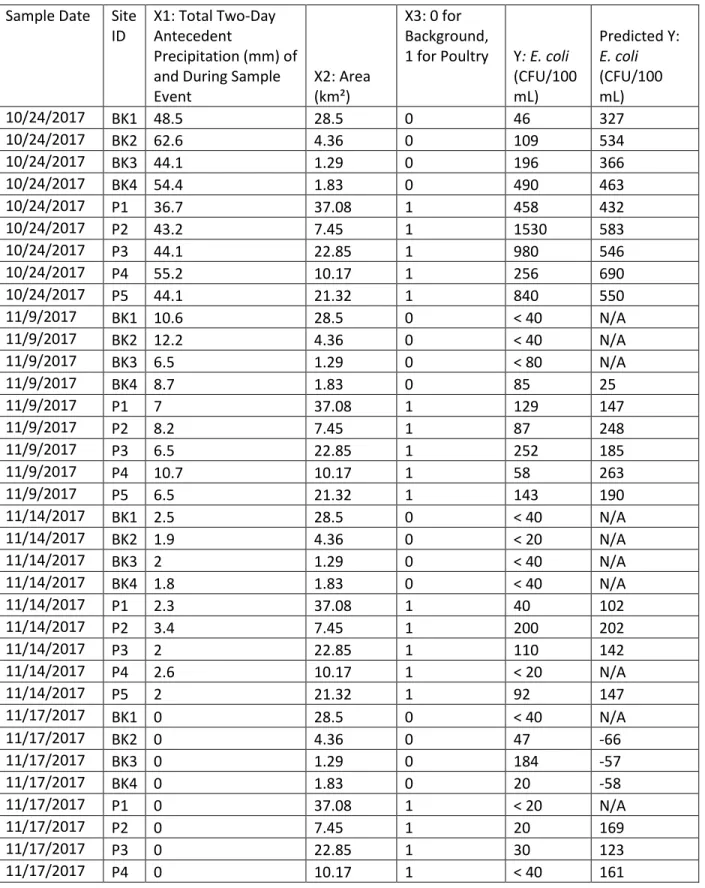
Table 6. Predicted mean E. coli concentration by a multiple linear regression analysis. Variables included total two-day antecedent precipitation that included to time of sample event (mm) (X1), area (km2) (X2), background or poultry sites (X3) and mean E. coli concentration (CFU/100 mL) (Y).
Sample Date Site ID
X1: Total Two-Day Antecedent
Precipitation (mm) of and During Sample Event
X2: Area (km²)
X3: 0 for Background,
1 for Poultry Y: E. coli (CFU/100 mL)
Predicted Y:
E. coli (CFU/100 mL)
10/24/2017 BK1 48.5 28.5 0 46 327
10/24/2017 BK2 62.6 4.36 0 109 534
10/24/2017 BK3 44.1 1.29 0 196 366
10/24/2017 BK4 54.4 1.83 0 490 463
10/24/2017 P1 36.7 37.08 1 458 432
10/24/2017 P2 43.2 7.45 1 1530 583
10/24/2017 P3 44.1 22.85 1 980 546
10/24/2017 P4 55.2 10.17 1 256 690
10/24/2017 P5 44.1 21.32 1 840 550
11/9/2017 BK1 10.6 28.5 0 < 40 N/A
11/9/2017 BK2 12.2 4.36 0 < 40 N/A
11/9/2017 BK3 6.5 1.29 0 < 80 N/A
11/9/2017 BK4 8.7 1.83 0 85 25
11/9/2017 P1 7 37.08 1 129 147
11/9/2017 P2 8.2 7.45 1 87 248
11/9/2017 P3 6.5 22.85 1 252 185
11/9/2017 P4 10.7 10.17 1 58 263
11/9/2017 P5 6.5 21.32 1 143 190
11/14/2017 BK1 2.5 28.5 0 < 40 N/A
11/14/2017 BK2 1.9 4.36 0 < 20 N/A
11/14/2017 BK3 2 1.29 0 < 40 N/A
11/14/2017 BK4 1.8 1.83 0 < 40 N/A
11/14/2017 P1 2.3 37.08 1 40 102
11/14/2017 P2 3.4 7.45 1 200 202
11/14/2017 P3 2 22.85 1 110 142
11/14/2017 P4 2.6 10.17 1 < 20 N/A
11/14/2017 P5 2 21.32 1 92 147
11/17/2017 BK1 0 28.5 0 < 40 N/A
11/17/2017 BK2 0 4.36 0 47 -66
11/17/2017 BK3 0 1.29 0 184 -57
11/17/2017 BK4 0 1.83 0 20 -58
11/17/2017 P1 0 37.08 1 < 20 N/A
11/17/2017 P2 0 7.45 1 20 169
11/17/2017 P3 0 22.85 1 30 123
11/17/2017 P4 0 10.17 1 < 40 161
30
11/17/2017 P5 0 21.32 1 48 127
Table 7. Multiple linear regression analysis statistics.
Regression Statistics
Multiple R 0.65
R Square 0.43
Adjusted R Square 0.35
Standard Error 291.98
Observations 25
Table 8. Multiple Linear Regression Fitted Model: Y = -87.26 + 9.96(X1) -6.59(X2) + 369.16(X3)
Coefficients Standard Error t Stat P-value
Intercept -87.26 130.79 -0.67 0.51
X Variable 1: 48 Hour Antecedent
Precipitation 9.96 2.73 3.64 1.53x10⁻³
X Variable 2: Area -6.59 6.04 -1.0904 0.29 X Variable 3: 0 for
Background, 1 for
Poultry 369.16 155.90 2.37 0.03
31
CHAPTER 6: DISCUSSION
Results of this study indicated a higher concentration of E. coli in surface waters with poultry concentrated animal feeding operations in the watershed compared to waters without poultry CAFOs.
Every poultry site had on average higher numbers of E. coli compared to background sites. These results are consistent with previous studies reporting that CAFOs can leach larger amounts of E. coli into watersheds compared to background sites that lack the industry (Thurston-Enriquez et al., 2005, Hill et.
al., 2005). It is important to note that these previous studies were “experimental plot” studies, meaning that conditions for these studies were better controlled and might not be like the ambient
environmental conditions of this study. The differences in concentrations observed in this study were not statistically significant (p > 0.05). A study conducted by Rogers et al. in 2009 examined persistence of pathogenic bacteria and fecal indicator bacteria like E. coli in agricultural soil that contained poultry litter, which has implications for expanding this study to test soil surrounding the nine sample sites to compare E. coli concentration levels between soil and water, as the surrounding soils could contribute higher amounts of E. coli, especially during precipitation events in runoff. Another study has found that E. coli concentrations can be high (105 CFU/100 mL) in the sediment of the bodies of water (Crabill et al., 1999). Also, studies have found that the pathogen Campylobacter jejuni is highly prevalent among poultry, especially in warmer months, and can occur simultaneously with E. coli, meaning testing for the pathogen in the nine surface water samples could prove useful in also determining poultry CAFO contamination (Cox et al., 2002; Wills and Murray, 1997; USEPA, 2010).
There were few observations of antibiotic resistance among the E. coli isolated in these
watersheds, let alone differences in between sample type. We did not find many isolates (4 out of 165) to be antibiotic resistant or to have multiple antibiotic resistance (1 out of 165). These young poultry