Biomedical diagnostics enabled by integrated organic and printed
electronics
Termeh Ahmadraji,
a‡ Laura Gonzalez-Macia,
a‡ Tapio Ritvonen,
bAndreas Willert,
cSatu Ylimaula,
bDa-vid Donaghy,
dSaara Tuurala,
bMika Suhonen,
bDave Smart,
eAoife Morrin,
fVitaly Efremov,
fReinhard
R. Baumann,
gMunira Raja,
dAntti Kemppainen
band Anthony J. Killard
a,*aDepartment of Applied Sciences, University of the West of England, Coldharbour Lane, Bristol BS16 1QY, UK; b VTT,
P.O. Box 1000, FI-02044 VTT, Finland; c Fraunhofer Institute for Electronic Nanosystems ENAS, Technologie-Campus 3,
09126 Chemnitz, Germany; d Electrical Engineering and Electronics, University of Liverpool, Brownlow Hill, Liverpool L69
7ZX, UK; e Smart Dx Consulting Ltd, 4 Smeaton Park, Moira BT67 0NF, UK; f School of Chemical Sciences and National
Centre for Sensor Research, Dublin City University, Dublin 9, Ireland.; g Department Digital Printing and Imaging
Technolo-gies, Technische Universität Chemnitz,Reichenhainer Str. 70, 09126 Chemnitz, Germany.
ABSTRACT: Organic and printed electronics integration has the potential to revolutionise many technologies, including biomedical diagnostics. This work demonstrates the successful integration of multiple printed electronic functionalities into a single device ca-pable of the measurement of hydrogen peroxide, and total cholesterol. The single-use device employed printed electrochemical sen-sors for hydrogen peroxide electroreduction integrated with printed electrochromic display and battery. The system was driven by a conventional electronic circuit designed to illustrate the complete integration of silicon ICs via pick and place, or using organic electronic circuits. The device was capable of measuring 8 µL samples of both hydrogen peroxide (0 to 5 mM, 2.72×10⁻⁶ A.mM-1)
and total cholesterol in serum from 0 to 9 mM (1.34×10⁻⁸ A.mM-1, r2=0.99, RSD <10%, n=3) which was output on a semi-quantitative
linear bar display. The device could operate for 10 minutes via a printed battery and display the result for many hours or days. A mobile phone ‘app’ was also capable of reading the test result and transmitting this to a remote health care provider. Such a technology could allow improved management of conditions such as hypercholesterolemia.
Printed electronics is being hailed as a technological revolu-tion, equal in importance to the emergence of microelectronics over 50 years ago. The combined qualities of print-processable organic, inorganic and hybrid (semi)conductive materials which can be deposited onto flexible polymeric substrates using a range of additive, high throughput printing methodologies of-fer the prospect of low cost mass production capability and the potential for unprecedented levels of technological integra-tion.1-3 This potent combination is transformational in the ways
in which we use electronic technologies, and further embed them into our daily lives. Such technologies are already being integrated into many everyday appliances such as organic light emitting diode (OLED) displays on TVs, tablets and phones, integrated lighting on product packaging, vehicles and in the built environment, printed RFID tags for object tracking and many more besides.1, 4, 5
One area that has great potential for its integration with or-ganic and printed electronics is that of sensors and diagnostics. In fact, sensors – electrochemical sensors at least – could be regarded as far ahead of their time in the development of printed electronics. Printed electrochemical sensor strips have been with us for some 20 years now for application in blood glucose monitoring and have featured the use of conductive inks printed onto planar substrates to form printed electrodes as the basis of miniaturized electrochemical cells.6,7 Other reagents such as
en-zymes and mediators have also been effectively integrated and
deposited using screen printing techniques. However, to per-form the rest of the measurement, the printed sensor has always been dependent on a number of traditional elements which in-clude displays, batteries and silicon circuitry external to the sen-sor in the form of a meter. In addition, the cost and complexity of the meter components dictates that they are used repeatedly and require maintenance and calibration.
The next stage of technological evolution is to fully integrate all of these components into a single monolithic device through the medium of organic and printed electronics. However, to achieve this, several technological hurdles have to be overcome. Most of these relate to the types and range of materials that must be amenable to integrated fabrication processing methods. This means having the appropriate functionality, print processability and compatibility with other materials and other processes used during manufacturing. This results in a significant complexity challenge to effectively combine all these functionalities into operational devices.
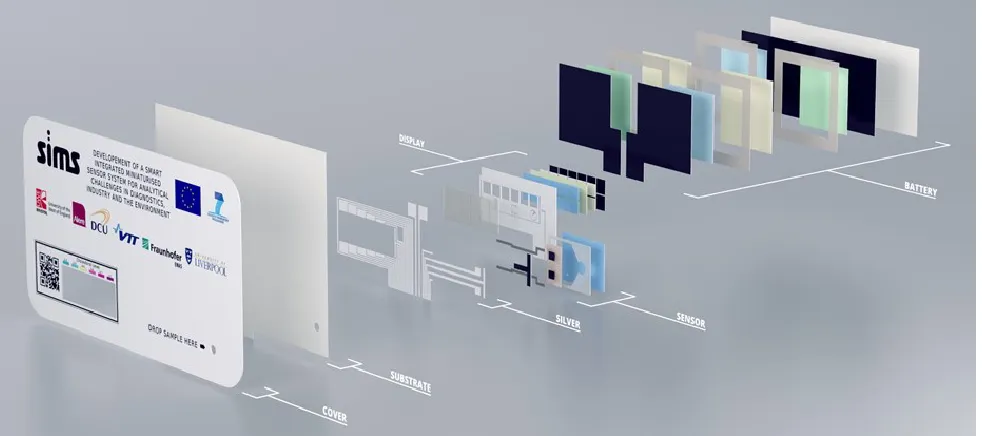
Figure 1. Complete layer stack of the SIMS device. A printed card device cover with display window, QR code, printed cholesterol level and color coding. Transparent polymer substrate layer based on polyethylene naphthalate foil for high dimensional stability during pro-cessing. Common silver layer for interconnects for sensor, display and battery. Display, battery and sensor layer stacks are shown in detail in Figs. 2, 3 and 5.
EXPERIMENTAL SECTION
Devices were fabricated on polyethylene napthalate (PEN) sub-strates of 100 mm × 80 mm (Teonex Q65FA) (Teijin Dupont Films), modified with indium-doped tin oxide (ITO). Q65FA was chosen for its excellent characteristics of process compati-bility and dimensional stacompati-bility. The ITO display current collec-tor was patterned by etching. Silver tracks were deposited using screen printing of Electrodag PF-410 (Henkel) on a DEK 248 screen printer (DEK, UK). All display components were depos-ited using screen printing of the electrochromic ink set (Na-noChromics™ Print Trial Kit TKG-3.1) developed by NTera (Dublin, Ireland). Dual three electrode electrochemical cells were fabricated using screen printing. Silver (PF-410) was used as the conductor and working electrodes, while Ag/AgCl Elec-trodag 6037 SS and carbon ElecElec-trodag 6017 SS (Henkel) were used as reference and common counter electrodes, respectively. Working electrode area was 3 mm × 3 mm.
Batteries were fabricated using a combination of screen print-ing, gluing and lamination. The current collectors were fabri-cated using screen printing of PF-407C (Henkel). Anodes and cathodes employed manganese dioxide and zinc-based inks, re-spectively. The anode and cathode were laminated together em-ploying double-sided glue tape with polymer separator layer and ZnCl2 gel electrolyte.
For the demonstration of the measurement of H2O2,
elec-trodes were modified with the inkjet-printed deposition of Tri-ton X-100 (0.25% v/v) in PBS as electrocatalyst using a Di-matix DMP 2831 inkjet printer, with an estimated total volume of 952 nL. For the measurement of TC, four inkjet-printed lay-ers of cholesterol esterase (ChEs) (1.04 kU/mL) and cholesterol oxidase (ChOx) (0.39 kU/mL) in 0.25% (v/v) Triton X-100, and stabilisers 0.2% (w/v) polyvinylpyrrolidone and poly(dial-lyldimethylammonium chloride) in PBS were deposited to a to-tal volume of 1.5 mL and allowed to dry under ambient condi-tions. Cholesteryl acetate stock solution (500 mg/dL) was pre-pared in PBS/10% (v/v) Triton X-100. Delipidated serum was
spiked with cholesteryl acetate stock to achieve concentrations of 0.5, 1, 3, 5, 7 and 9 mM total cholesterol (TC).
For method development, sensors were operated at -100 mV vs Ag/AgCl pseudo-reference electrode using an Autolab PGSTAT128N with NOVA 1.6 software (Metrohm, UK) in time-based amperometric mode. Measurement involved an in-cubation period of 200 s, followed by amperometric measure-ment for 240 s. The concentration of cholesteryl acetate was correlated against the current at 240 s. For operation of the SIMS device, incubation and amperometric measurement were combined into a single interval of 400 s.
RESULTS AND DISCUSSION
Fig. 1 illustrates the complete twenty-two layer stack of the SIMS device. The development of the integrated sensor system involved the combination of multiple heterogeneous fabrication processes and associated materials including screen printing of metallic and non-metallic conductors, inkjet printing of func-tional electrocatalysts, enzymes and stabilizers, photolithogra-phy and lamination, to combine printed sensor, display and bat-tery onto a single polyethylene naphthalate (PEN) substrate. The following sections detail the individual component charac-teristics and the operation of the integrated device in the meas-urement of H2O2 and total cholesterol (TC).
Printed electrochromic display. The display is a critical com-ponent of any diagnostic device as it represents the interface between the device and the user and must give clear and unam-biguous information. Several types of printed display technolo-gies have been developed including organic light emitting di-odes (OLEDs), electroluminescence (EL) and electrochromics (EC).8,9 While OLEDs offer excellent performance for high
Figure 2. The printed electrochromic display. (a) Scheme of the seven layer display stack. (b) Layout of the electrochromic dis-play showing upper bar disdis-play and lower power, hour glass and book icons to show operation, activity and reading of test result. power to remain illuminated. EC displays, however, undergo a (semi)permanent change in their redox characteristics due to the application of a potential. Viologens are bypyridyl derivatives which undergo a color change upon the application of an appro-priate reduction potential.10,11
This change can be rendered bitable, requiring power only to switch on the display. This characteristic is particularly useful in single use applications such as diagnostic devices, with which the test result can be observed many hours or days after the test is performed. In this work, an EC display was developed using a fully screen-printed seven layer stack (Fig. 2a) onto a transparent ITO conductive substrate. First, the passivation layer was printed on the ITO substrate, followed by the silver conductor, segment electrode and separator as the next layers. The last three prints consisted of the common electrode, carbon electrode and electrolyte.
A non-numeric display was selected and designed which would indicate the level of the analyte being measured by acti-vating an appropriate number of display bars (Fig. 2b). This semi-quantitative display approach was deemed to be the most effective way to allow interpretation by untrained lay users, while also greatly simplifying the design of the display driver aspect of the circuit. The display was also designed with addi-tional functions including a power icon to indicate that the de-vice was switched on and operational, an hour glass icon to in-dicate that the device was performing an operation and a book icon to indicate the reading of the result. Display elements with a size of 5 mm (14 point) were employed to facilitate clear and comfortable viewing by the user, allowing for a wide range of age and ability.12 Display icons were tested for the optimum
[image:3.612.319.560.38.267.2]drive voltage, current consumption and time to reach full inten-sity. It was found that display icons could be driven using a sim-ple ac drive methodology with a nominal voltage of 1.1 V and a current consumption of 25 µA, reaching full intensity after 20 s.
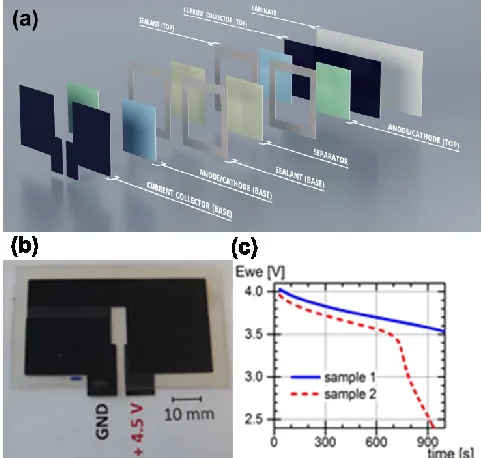
Figure 3. The printed battery. (a) Schematic of a two cell battery; (b) Photo of the three cell 4.5 Vnom battery. (c) Discharge curve at
1 mA.
Printed battery. The printed battery employed in this system was primary cell based on zinc/manganese dioxide chemistry, designed for one-time (non-rechargeable) use. The nominal voltage of this chemical system for a single cell is 1.5 V. These batteries can be manufactured by screen printing technology and can accommodate a range of operational voltages, currents and energy capacities by tailoring the geometries, numbers and configurations of cells employed. This battery concept and some applications have already been described.13-19
The battery was developed on a PEN foil substrate. A stacked, as opposed to a lateral battery configuration was se-lected as having greatest energy capacity, while also reducing cell footprint. This required electrodes to be printed on top of one another, with separators and electrolyte, with each half cell printed on a separate substrate, forming a sandwich and further sealed within a final PEN layer (Fig. 3a). The energy content of this chemical system is dependent on the amount of material within the battery cell. Screen printing was used to deposit lay-ers of the required thickness in the range of 10 to 80 µm to max-imize energy capacity, while also maintaining a planar config-uration.
One of the significant advantages of the screen printing pro-cess is that a series connection of batteries can be designed and easily manufactured. In the current setup, a series connection of three single cells was designed to deliver a voltage of 4.5 Vnom
to drive conventional silicon circuitry (see Device operation) (Fig. 3b). The battery requirement for the system was defined as >3V with a current flow of 1 mA for up to 600 s. The result-ing battery was able to supply >3.5 V for 1,000 s at a 1 mA discharge rate (Fig. 3c). The blue trace illustrates the typical performance of cells manufactured in this way, while the red trace illustrates batteries which occasionally fail early. How-ever, they were still capable of driving the appropriate voltage for the duration of the assay.
functions. However, with the advent of low cost, highly inte-grated silicon electronics using pick and place technology, and with rapid advances in organic electronics, the potential now exists to fully integrate the electronic circuit instrumentation with the rest of the device, giving rise to a new technological paradigm. However, silicon circuits must be produced in large volumes to achieve cost scaling and silicon costs can be reduced by increasing the numbers of devices on a wafer and by reduc-ing their size and complexity. While there has also been signif-icant progress in the development of organic circuit electronics, the potential for this technology to perform more complex pro-cessing tasks is still challenging. Thus, with the aim of facilitat-ing the future integration of both silicon and organic electronics into a fully integrated diagnostic platform, a circuit design was proposed which was both simple but also fully capable of oper-ating the proposed diagnostic device.
The organic circuit was designed with three amplifiers with a six-stage voltage converter, connected to the six-bit display el-ement (Fig. 4a). The difference in resistance of the two electro-chemical sensors is fed into the amplifiers and subsequently an output voltage is obtained. This voltage corresponds to the level of H2O2 or cholesterol in the sample based on the determination
[image:4.612.318.556.130.243.2]of a calibration slope. The voltage is subsequently fed into the voltage converter, which drives respective display elements. Table 1 indicates the levels TC and the respective sensor cur-rents and drive voltages with the corresponding display ele-ment.
Figure 4. a) Block diagram of the organic circuit. Resistance meas-urements at the test (RT) and control (RC) sensors are amplified in a differential logic circuit and subtracted to yield a single amplified output voltage from the subtracting circuit. The voltage converter then drives the appropriate number of display bars. b) Block dia-gram of the equivalent silicon circuit. Sensors are driven via a dig-ital to analogue converter (DAC). Outputs from the Test and Con-trol sensors are amplified and a peripheral interface conCon-troller (PIC)
performs subtraction and voltage conversion to output to the dis-play driver. The disdis-play driver is composed of a bank of MOSFET switches. Display elements were driven at 1.2 V.
Table 1. Relationships between cholesterol concentration, sensor currents, resistance ratios and display driver volt-ages for display illumination.
Display
bit Concentration (mM) Current (10-7 A)
Voltage (V)
RT/RC*
0 >0 <1.708 -3.19 <1 1 >2 <1.838 -5.16 <0.535 2 >4 <2.110 -7.19 <0.361 3 >5 <2.244 -8.2 <0.311 4 >6 <2.378 -9.21 <0.273 5 >7 <2.512 -10.19 <0.244
*RT/RC: Resistance ratio of test and control electrodes.
A silicon circuit conforming to this simplified operational prin-ciple was fabricated using a conventional printed circuit board, and a conventional silicon integrated circuit (IC) was developed to facilitate testing of the printed sensor, display and battery. The integrated printed substrate was connected via a flexible parallel connector to the measurement board. The measurement circuit utilized a simple potentiostat configuration.20,21 The
working electrode (WE) of the sensor was kept at the ground potential. The potential of the counter electrode (CE) was con-trolled by an operational amplifier so that the potential of the reference electrode (RE) in a steady state very closely follows the cell voltage (Vcell). The cell voltage (-100 mV in these
meas-urements) was set by a digital-to-analog converter (DAC). The current flowing to the working electrode was converted to volt-age by the transimpedance amplifier and digitized. A microcon-troller unit (MCU) controlled the measurement process and out-put the responses to the printed display. Additional manual switching (on/off and measurement timing) were also included.
Printed electrochemical sensors. Electrochemical sensors are particularly suited to integration with organic electronics as they are, themselves electrical devices, do not require more costly or complex components such as is often the case in opto-electronics and they can also be easily manufactured in a two-dimensional, planar configuration using print fabrication.
For the device demonstrated here, an amperometric sensor based on a novel electrocatalytic phenomenon which results in the enhanced electrocatalysis of H2O2 at a silver paste, screen
printed electrode was employed.22 The novel electrocatalytic
mechanism was based on the formation of liquid crystal lyo-tropic phases of surfactant which form on the surface of the sil-ver and bring about an enhancement in the reduction of H2O2 at
moderate reduction potentials (approx. -100 mV) to avoid inter-ferences. H2O2 is a very important molecule as it is a by-product
of many chemical and biochemical reactions and so represents an important target for industrial and environmental monitoring and diagnostic device development.23-25 Previous work has
demonstrated that a combination of dodecyl benzenesulfonic acid and KCl could bring about an up to 80-fold increase in the reduction of H2O2 at silver-paste electrodes. It has also been
[image:4.612.53.297.335.619.2]Recently it was demonstrated that Triton X-100 can also be used to effectively solubilize lipoprotein-bound cholesterol and cholesterol esters in combination with this enhanced electroca-talysis to bring about the measurement of total cholesterol (TC).28 Here, we further demonstrate the full printed integration
[image:5.612.56.290.108.548.2]of a TC sensor with printed display and battery.
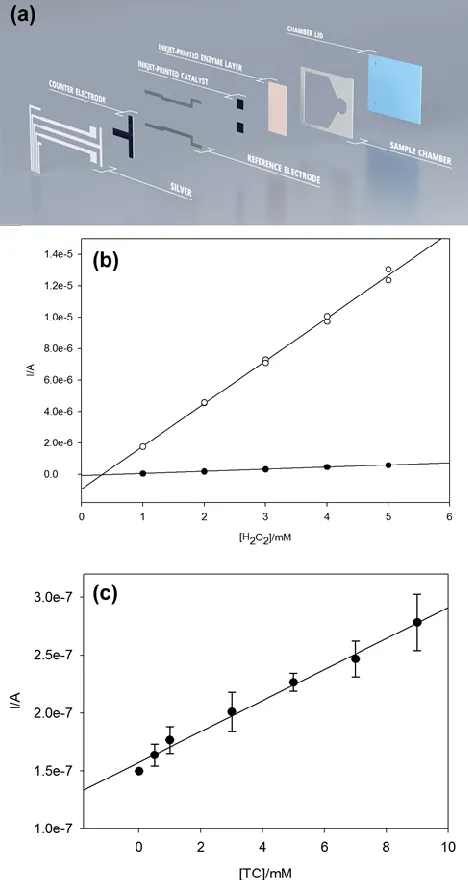
Figure 5. (a) Scheme of the electrochemical sensor. The sensor comprised a dual working electrode configuration with com-mon counter and individual reference electrodes. A spacer and lid formed a microfluidic sample chamber of approx. 8 µL. The working electrodes were composed of screen-printed silver and modified with Triton X-100/PBS as catalyst. Total cholesterol measurement was achieved with the inkjet-printed deposition of cholesterol esterase, cholesterol oxidase and stabilizers. (b) Measurement of H2O2 in 0.5% Triton X-100, -0.1 V vs.
Ag/AgCl, at 420 s. Sensitivity 3.02×10⁻⁵ A.mM-1.cm-2 (c)
Meas-urement of total cholesterol in serum. 1.34×10⁻⁸ A.mM-1,
r2=0.99, RSD<10% (n=3).
The sensor electrodes (silver WE, silver/silver chloride RE and silver/carbon CE) were fabricated using screen printing A dual electrode configuration was adopted, with one electrode providing measurement of background and the other measuring
the reduction of H2O2 (Fig. 5a). This configuration was chosen
to reduce the complexity of the circuit electronics and the cali-bration required in compensating for local device and environ-mental variations. Following inkjet printing of electrocatalyst and assay reagents, the sensor was encapsulated to form a thin layer microfluidic sample chamber requiring a sample volume of approx. 8 µL, to make it applicable to fingerstick blood draw measurements.29
The measurement of H2O2 using electrodes modified with the
inkjet-printed Triton X-100 (0.5% v/v) in PBS is shown in Fig. 5b. The fully printed sensor was tested for the measurement of H2O2 in the range of 0 to 5 mM. Catalysis was significantly
en-hanced in the presence of Triton X-100, while in its absence, little catalysis was observed, being 1.2×10⁻⁵ A at 5 mM H
2O2,
in Triton (3.02×10⁻⁵ A.mM-1.cm-2), compared with 5.91×10⁻⁷ A
in PBS alone; some 20-fold enhancement. This was comparable to the sensitivity of 4.9×10⁻⁵ A.mM-1.cm-2 previously achieved
using inkjet-printed DBSA/KCl.27 Recently, H
2O2 sensors based
on inkjet-printed Prussian blue nanoparticles have achieved sensitivities of 7.62×10⁻⁵ A.mM-1.cm-2.30
For the measurement of TC, both ChEs and ChOx were de-posited using inkjet printing, along with Triton X-100, and en-zyme stabilizers. Measurement of cholesteryl ester in the range of 0 to 9 mM was selected to demonstrate direct (undiluted) measurement of cholesterol in the clinically relevant range.30,31
The majority of cholesterol is transported by lipoproteins in the form of cholesteryl esters. These can be transformed to choles-terol by ChEs and to cholest-4-en-3-one and H2O2 by ChOx.
Triton X-100 between 0.2 and 0.5% has been shown to be opti-mal for full release of cholesterol esters from both HDL and LDL, which is a pre-requisite for TC measurement. Other com-binations of surfactant and protecting agents have been shown to result in selectivity to either LDL-C or HDL-C.28
The measurement of TC in the fully printed sensor device demonstrated good linearity in the range from 0 to 9 mM with a slope of 1.34×10⁻⁸ A.mM-1, r2=0.99, RSD<10% (n=3) (Fig.
5c). Replicate measurements were made with different sensors with the same stock of TC standard. Levels of TC below 5.2 mM are considered desirable and of low risk while 5.2 to 6.2 mM is considered borderline high risk. Values greater than 6.2 mM are considered high risk. This was reflected in display col-our coding of green (0 to 4 mM), yellow (4 to 5 mM), orange (5 to 6 mM), light red (6 to 7 mM) and dark red (>7 mM). The resulting sensor was capable of measuring TCfrom 0 to 9 mM at moderate (-100 mV) potentials to minimize potential redox interferences. The presence of surfactant may also assist in re-ducing interference due to biofouling. The generation of sub-microampere currents, resulting in nW levels of power con-sumption is an important feature in minimizing power require-ments (battery size).
Fabrication integration. Organic and printed electronics presents an exciting, but also a challenging opportunity to mass manufacture novel and advanced devices. The physical integra-tion of multiple funcintegra-tionalities creates an exponential complex-ity problem due to the numbers of different functional materials, their particular process requirements and their compatibility with other materials and other processes. As a result, achieving true integration of such heterogeneous devices has remained challenging. Various approaches have been taken to address this problem. Some have used multiple substrates on which to fabricate various system elements33, while others have used
battery components to achieve instrument-free glucose meas-urement.33 However, the approach taken here was to
demon-strate integration of heterogeneous subsystems on a single sub-strate, for which all processes must be made fully inter-compat-ible at the process level. Several integration principles were ap-plied here to achieve integration. Redundancy was removed from the various components, where possible. Processes were also sequenced to ensure that materials with least sensitivity, or more rigorous process requirements were performed prior to those with greater sensitivity. The design layout was also opti-mized to eliminate any potential impact of one subsystem on another. The integrated printed sensor, battery and display is il-lustrated in Fig. 6. As the display is printed ‘face down’ to the substrate and the sensor is fabricated ‘face up’ from the sub-strate, a simple microfluidic was incorporated to allow sample application on the same side as the display. Sensor and display were fabricated together on a single substrate and the battery was prepared on a separate substrate and subsequently inte-grated onto the common substrate. Final addition of sensor modification layers was then performed via inkjet printing, re-sulting in a layer stack of 22 processing steps. Although only 24 fully integrated devices were fabricated, operational yields of 100% were achieved by having good design tolerances in all print process steps.
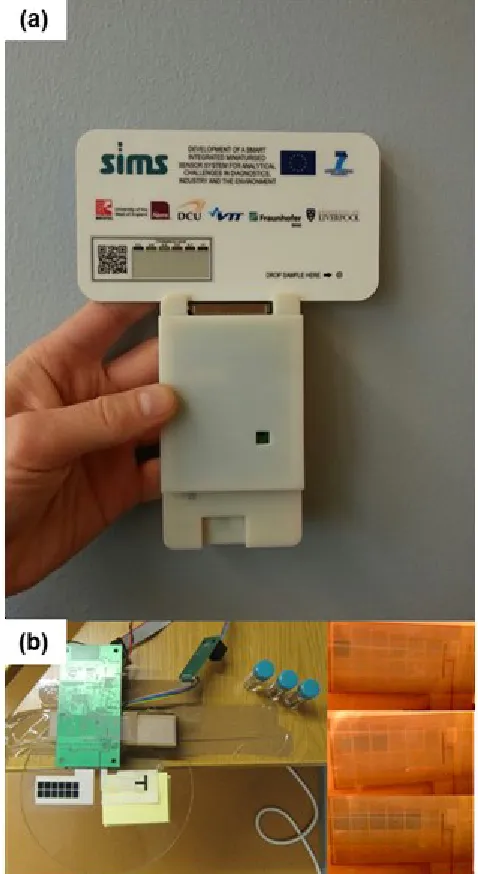
Device operation. The integrated prototype device is shown in Fig. 7a. The device was activated by operating a manual on/off touch switch which activates the circuit and illuminates the power on icon. The sample chamber was composed of a hy-drophilic polymer bonded with a PSA. Filling was by capillary action, with air escape through two vias in the lid of the sample chamber. Upon addition of sample (8 µL of H2O2 or cholesterol
in serum), the second switch is activated to begin the measure-ment timing of the device. A potential of -100 mV is applied to the sensor working electrodes of both the control and test cells. For measurement of TC, the assay employed a 400 s incubation between cholesterol and cholesterol oxidase to allow full con-version to cholest-4-en-3-one and hydrogen peroxide. During this period, the hour glass icon is illuminated. After 400 s, the difference in current between the two sensors is subtracted and applied to the stored calibration constant of the device and illu-minates the appropriate number of display bars.
[image:6.612.316.555.125.562.2]Figure 6. Integrated printed system components. Sensor (bottom right), display (bottom left) and battery (top) were effectively inte-grated onto a single substrate using a combination of screen print-ing, inkjet printprint-ing, bonding and lamination processes into a mon-olithic 22 layer stack.
Fig. 7b shows the test set up of separate display and sensor to allow reuse of the displays during laboratory testing. To the right of Fig. 7b shows the illumination of one display bar for 1 mM H2O2, three bars for 3 mM and five bars for 5 mM. In
[image:6.612.55.296.496.655.2]ad-dition, the ‘book’ icon is displayed indicating that it is time for the device reading. A video of the operation of the device can be viewed in Supporting Information.
Figure 7. Operation of the integrated sensor system. (a) The assem-bled prototype showing printed cover with QR code, cholesterol concentration values and sample application zone. Below is the electronic control board. (b) Testing of the device using separate displays and sensors (displays could be reused during laboratory testing). On the right shows the results of the addition of 1, 3 and 5 mM H2O2, resulting in the activation of an equivalent number of
display blocks.
whether the measured level of analyte (in this instance choles-terol) was normal or too high. In addition, the device was de-signed with QR coding. This coding contains specific device identification that can be used in several ways including device authentication, supply chain management and quality control monitoring.32
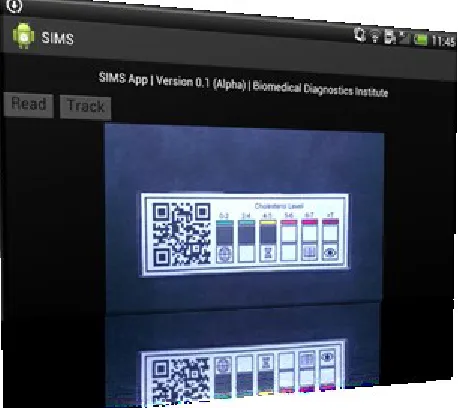
[image:7.612.57.286.319.523.2]In addition, the QR also allows the location and orientation of the display to be detected. Result detection and interpretation is performed using an Android smartphone application. The ‘app’ is designed to provide patient identification and authenti-cation. The app employed the phone’s camera to take a picture of the display. Using the QR code, the app identifies the device, locates the device display, detects the location and number of display blocks activated, and can record the date, time and lo-cation of the test. A picture of the display, along with test result and associated metadata can be automatically sent via SMS to a remote, healthcare management site to monitor health status, treatment efficacy and testing compliance. The issue as to whether or not the test result should be interpreted locally by the phone has implications for the type of medical device regu-latory approval required of the mobile phone. Operation of the mobile phone communications app can be seen in the accompa-nying video (Supporting Information).
Figure 8. The communications interface mobile phone application. The app allows an image of the SIMS device to be captured by the phone’s camera. Image processing algorithms automatically locate the chip and the QR features. The reading on the chip is automati-cally recorded (small grey squares) and the QR codes are used to identify the test and track the results.
Cholesterol testing is currently used to manage hypercholes-terolemia which is a major risk factor in atherosclerosis. Treat-ment is typically by way of lifestyle manageTreat-ment (diet and ex-ercise), as well as administration of statins. Point of care devices employing strips and meters are available and strips typically retail for between US$2 and US$3 per strip. This requires the more challenging acceptance and integration of such technol-ogy into the lifestyle of often elderly patients. Pharmacy-based testing is also available at over US$12 per test. The prototype production cost of the SIMS device was approximately US$5,
which could be significantly reduced during production scale up and mass manufacture to approximately US$1.50 or less, with a target sale price of US$5. It also offers users greater sim-plicity of self-testing, as well as connectivity with health care providers. Current test time is approximately seven minutes which has the potential to be reduced to less than two or three minutes and which would be acceptable to most users. While the measurement of TC has been demonstrated here, the addi-tion of a sensor for the measurement of high density lipoprotein cholesterol (HDL-C) would facilitate subtractive measurement of non-HDL-C (low density lipoprotein or LDL and very low density lipoprotein or VLDL cholesterol) using the Friedwald equation.35 Non-HDL-C is considered to be atherogenic and so
is better than the separate measurement of LDL-C.36
CONCLUSIONS
Printed electronics was successfully used to achieve the fabri-cation of a sensor, display and battery into a fully integrated diagnostic device. The sensors were shown to be capable of the quantitative measurement of H2O2 and total cholesterol, while
the display, battery and circuit all demonstrated component functionality. The final integrated device was also able to demonstrate the measurement of H2O2. The device was also
ca-pable of remote result transmission via mobile phone. Such a device could form the basis of a new approach to diagnostic de-vice fabrication and enhance the management of disorders such as hypercholesterolemia.
ASSOCIATED CONTENT
Supporting Information
The Supporting Information is available free of charge on the ACS Publications website.
Video showing operation of the SIMS device (.md4)
Video showing operation of the mobile phone interface (.avi)
AUTHOR INFORMATION
Corresponding Author
* Email: [email protected]; Tel.: +44(0)117 328 2147.
Author Contributions
The manuscript was written through contributions of all authors. All authors have given approval to the final version of the manu-script. ‡These authors contributed equally.
Notes
The authors declare no conflicts of interest.
ACKNOWLEDGMENT
The authors would like to acknowledge the financial assistance of EU, FP7/2007-2013, under grant number 257372.
REFERENCES
(1) Kamyshny, A.; Magdassi, S. Small. 2014, 10, 3515-3535. (2) Park, S.; Vosguerichian, M; Bao, Z. Nanoscale, 2013, 5, 1727-1752.
(3) Chang, J.; Ge, T.; Sanchez-Sinencio, E. Circuits and Systems (MWSCAS), 2012 IEEE 55th International Midwest Symposium on, 2012, 582-585.
(5) Singh, M.; Haverinen, H. M.; Dhagat, P.; Jabbour, G. E. Adv. Mater. 2010, 22, 673-685.
(6) Newman, J. D.; Turner A. P. F. Biosens. Bioelectron. 2005, 20, 2435-2453.
(7) Wang, J. Chem. Rev. 2008, 108, 814-825.
(8) Carpi F.; De Rossi, D. Optics Laser Technol. 2006, 38, 292-305. (9) Yang, Y.; Chang, S.-C.; Bharathan, J.; Liu, J. J. Mater. Sci. Ma-ter. Electron. 2000, 11, 89-96.
(10) Ryu, J.-H.; Lee, J.-H.; Han, S.-J.; Suh, K.-D. Macromol. Rapid Commun. 2006, 27, 1156-1161.
(11) Bonhôte, P.; Gogniat, E.; Campus, F.; Walder, L.; Grätzel M.
Displays, 1999, 20, 137-144.
(12) Redish, J.; Chisnell, D. AARP, Washington, 2004, pp. 1-64. (13) Willert, A.; Kreutzer, A.; Geyer, U.; Baumann, R. R. in Euro-pean Conference and Exhibition on Integration Issues of Miniaturized Systems - MEMS, MOEMS, ICs and Electronic Components, Brussels, 2009.
(14) Espig, M.; Siegel, F.; Hammerschmidt, J.; Willert, A.; Bau-mann, R. R. in 28th International Conference on Digital Printing Tech-nologies/Digital Fabrication 2012, Quebec, Canada, 2012, pp. 168-170.
(15) Willert, A.; Espig, M.; Sowade, E.; Baumann, R. R. in 7th
Inter-national Conference & Exhibition on Integration Issues of Miniatur-ized Systems - MEMS, NEMS, ICs and Electronic Components, Am-sterdam, 2013.
(16) Willert, A. IEEE 2013 International Semiconductor Conference Dresden – Grenoble (ISCDG), Dresden, Germany; September 26-27, 2013. URL: http://iscdg.org/program/.
(17) Willert, A.; Espig, M.; Sowade, E.; Baumann, R. R. Proceed-ings of Smart Systems Integration 2013, Amsterdam, The Netherlands, March 13-14, 2013. ISBN: 978-3-8007-3490-0 URL:
http://www.mesago.de/en/143ssi/The_conference/Pro-gram/2479__program_detail.htm. VDE VERLAG GMBH Berlin Of-fenbach.
(18) Willert, A.; Helmert, M.; Baumann, R. R. Smart Systems Inte-gration, Munich, Germany, 2016, ISBN 978-3-95735-040-4
(19) Willert, A.; Helmert, M.; Baumann, R. R. ICFPE, Yamagata 2016, Japan.
(20) Kissinger P. T.; Heineman, W. R. Laboratory Techniques in Electroanalytical Chemistry, Marcel Dekker, New York, NY, USA, 1996.
(21) Ahmadi M. M.; Jullien, G. A. IEEE Trans. Circ. Sys. I, 2009,
56, 1339-1348.
(22) Gonzalez-Macia, L.; Smyth, M. R.; Morrin, A.; Killard, A. J.
Electrochim. Acta, 2011, 56, 4146-4153.
(23) Chen, W.; Cai, S.; Ren, Q.-Q.; Wen, W.; Zhao, Y.-D. Analyst, 2012, 137, 49-58.
(24) Guascito, M. R.; Filippo, E.; Malitesta, C.; Manno, D.; Serra, A.; Turco, A. Biosens. Bioelectron. 2008, 24, 1057-1063.
(25) Zhang Y.; Wilson, G. S. J. Electroanal. Chem. 1993, 345, 253-271.
(26) Gonzalez-Macia, L.; Smyth, M. R.; Morrin A.; Killard, A. J.
Electrochim. Acta, 2011, 58, 562-570.
(27) Gonzalez-Macia, L.; Smyth M. R.; Killard, A. J. Electroanal.
2012, 24, 609-614.
(28) Ahmadraji T.; Killard. A. J. Anal. Meth., 2016, 8, 2743-2749. (29) Gubala, V.; Harris, L. F.; Ricco, A. J.; Tan, M. X.; Williams, D. E. Anal. Chem. 2012, 84, 487-515.
(30) Cinti, S.; Arduini, F.; Moscone, D.; Palleschi, G.; Killard. A.J.
Sensors 2014, 14, 14222-14234.
(30) Zhao, C.; Wan, L.; Jiang, L.; Wang, Q.; Jiao, K. Anal. Biochem.
2008, 383, 25-30.
(31) Naito, H. K.; Hutchison, J. D.; Bowers, G. N.; Baillie, E. E.; Joseph, J. M.; Myers, G. L.; Hainline, A.; Cooper, G. R. ;Seckinger, D.; Ross, J. W.; Aziz, K.; Danniel, A.; Schaffer, R.; Vanderlinde, R. E.; Bachorik, P.; Hartmann, A.; Kessler, G.; LaRosa, J. C.; Statland, B. E.; Warnick, R.; Cleeman, J. I.; Lippel, K.; Rifkind, B. Clin. Chem. 1988,
34, 193-201.
(32) Quintero, A.V.; Van Remoortere, B.; Smits, E.C.P.; van den Brand, J.; Briand, D.; Schoo, H.F.M.; Rooij, N.F.; Microelectron. Eng., 2013, 110, 52-58.
(33) Beni, V.; Nilsson, D.; Arven, P.; Norberg, P.; Gustafsson, G.; Turner, A.P.F. ECS J. Solid State Sci. Technol., 2015, 4, S3001–S3005. (34) Seenivasagam V.; Velumani, R. Comput. Math. Methods Med. 2013, 2013, 516465.