1 TITLE PAGE
1. The title of the article:
A 3D MACHINE VISION METHOD FOR NON-INVASIVE
ASSESSMENT OF RESPIRATORY FUNCTION
2. The name and initials of each author:
L. N. Smith, M. L. Smith, M. E. Fletcher and A. J. Henderson
3. The department and institution to which the work should be attributed:
Department of Engineering, Design and Mathematics, University of the West of England, Bristol.
4. The name, postal and email address, and telephone number of the author responsible for correspondence and to whom requests for reprints should be addressed:
Professor Lyndon Neal Smith
Professor in Computer Simulation and Machine Vision
Department of Engineering, Design and Mathematics, T Block University of the West of England, Bristol
Bristol BS16 1QY UK
Email: [email protected] Tel. +44 (0)117 3282009
5. Sources of financial support:
This paper presents independent research funded by the National Institute for Health Research (NIHR) Invention for Innovation (i4i) Programme (II-FS-0908-10078); and the University of the West of England, Bristol.
6. Category in which the manuscript is being submitted:
Original Article
7. Word count and number of figures:
Words: 5,234. Figures: 7.
2
3
ABSTRACT Background
Respiratory function testing is important for detecting and monitoring illness, however it is difficult for some patients, such as the young and severely ill, to perform conventional tests that require co-operation and/or patient contact.
Method
A new method was developed for non-contact breathing measurement, employing photometric stereo to capture the surface topography of the torso of an unconstrained subject. The surface is integrated to calculate time-dependent volume changes during respiration.
Results
The method provides a useful means of continuously measuring volume changes during respiration with high spatial and temporal resolution. The system (NORM) was tested by comparison with pneumotachometry equipment and a clear periodic signal, of a frequency corresponding to the reference data, was observed.
Conclusion
4
INTRODUCTION
5
used to identify patients at high risk with a specificity of 95% (8). However, while there is increasing evidence that lung development during early life is important for respiratory health through the life-course, some patients, particularly the very young, are not able to perform the existing tests. Current procedures are conducted by "contact" test methods, many of which become impossible to use with young children or patients who are either too young or too ill to cooperate. There are no tests available that require the patient to do no more than simply sit without a face mask, special chest bands/markers or a mouthpiece and undergo continuous capture of the whole respiratory system function. Consequently it is not currently possible to detect minute falls in ventilation due to progressive respiratory or cardiac or neurological
disease. Therefore, for significant patient numbers across all ages, no appropriate assessment tool exists, even though continuous monitoring could provide early warning of disease, that repeating conventional tests does not offer (and that simple tests such as respiratory rate might miss). This deficiency highlights the urgent need for research into clinical monitoring and diagnosis for enabling respiratory function testing in both specialist centres and primary care. To illustrate the limitations of current technologies employed clinically, a brief review is given here of existing techniques for respiratory function testing.
6
requiring some form of sensor to be applied to the patient. This can cause discomfort, may mean they are not suitable for use during sleep, can lead to errors due to distress caused by the contact device and may of themselves affect the parameters of interest. For example, measuring flow by a pneumotachograph at the mouth and/or nose requires contact with the patient’s face, which may alter the breathing pattern e.g. by the re-breathing of exhaled air (known as dead-space). Also, in some cases such as young children or the critically ill, patient cooperation often cannot be attained so that it is not possible to employ contact methods. However, a number of contact methods are commonly employed and are therefore worth mentioning in more detail; specifically spirometry, inductive plethysmography and airflow based methods. A spirometer is a device for measuring the volume of air inspired and expired by the lungs. It detects the flow rate of gases by measuring pressure differences across a fine mesh; and then flow is integrated to produce a pot of volume against time. Incentive spirometry can be used in children as young as 3 years, but this leaves a significant gap in measures during the most rapid phase of postnatal lung
7
suitable for use during sleep) and potential technological limitations such as electrical interference with other equipment (9). Also because inductance varies with length
(circumference) and babies have compliant chest walls (change shape readily depending on position), movement from one position to another can invalidate the calibration. Finally, the very limited spatial resolution of IP limits its utility as a diagnostic tool, since the ability to measure movement and breathing at locations between the bands may assist with clinical assessments. For example, high-spatial resolution measurement of respiratory muscle dysfunction could be useful since it has been found that this condition often goes undetected until it becomes more severe (10). Airflow methods make use of the difference in, for example, the temperature of exhaled and inhaled air; where these differences can be used to infer respiratory rate. These types of systems therefore require a sensor to be attached to the airways, such as a thermistor to measure the temperature of the inhaled and exhaled air. Disadvantages include the obtrusive nature of the sensor and accuracy limitations, such as the calibration issues associated with the non-linear signal from the thermistor. Another more accurate approach is to employ a nasal pressure
transducer, however the transducer can be uncomfortable and can itself affect breathing. For very young children, or patients with significant respiratory compromise or fatigue related disorders (e.g. muscular dystrophies) use of such transducers or effort dependent procedures requiring coordination and cooperation can be challenging if not impossible, preventing accurate monitoring of the disease process. Therefore existing contact sensor systems often rely on methodologies prone to significant error (11) and/or limited resolution.
8
sensor systems. Again, it is not possible to enter here into a detailed review of all the non-contact techniques reported in the literature. Instead selected previous work will be mentioned to
illustrate the type of research being undertaken and its relevance to the authors’ work. One of the most commonly researched non-contact methods is that of optical breathing monitoring, where the patient is illuminated by one or more light sources (often employing structured light such as stripes) and the resulting images of the patient are captured using a camera. If images are captured continuously then changes in the illumination pattern can be used to calculate body shape changes and hence breathing volumes. Early research employing triangulation of light stripes indicated that good accuracy could be obtained (12), but at the time the technique was not developed into systems that could be used on the ward, presumably due to the expense and performance limitations associated with the imaging and computing technology available. Today, high-resolution digital cameras and high-performance computing hardware are both relatively low cost, so that optical systems for real-time breathing monitoring are becoming a viable commercial possibility. Systems that are available on the market tend to employ
triangulation, either through use of reflective markers that are placed at selected positions on the body (13), or by projecting a pattern of coloured light onto the chest and abdomen (14).
9
bare-chested for marker placement and data acquisition – some subjects may be uncomfortable with this and same-sex technicians may be required, thereby further increasing costs. The patterned light system suffers from a similar disadvantage in that the patient needs to be in a specified position – for example, in a chair with the pattern projection equipment mounted in front of them. Since the method employs a data projector for producing the patterns of light there is also the need for the patient to be located at a set distance from the projector for the pattern to be in focus; and there is a danger of the pattern going out of focus towards the side of the trunk where the skin is further from the projector than on, say, the front of the trunk. A further limitation is that the system employs visible light; and this in combination with the positional constraints involved would be expected to make the system unsuitable for employment with sleeping patients. This is quite important, since detection of sleeping related disorders, such as Obstructive Sleep Apnoea, could be an important and valuable potential application of any non-contact breathing measurement system. Other reported research on non-non-contact breathing measurement has involved use of laser Doppler vibrometry (15), laser displacement techniques (9) and thermal imaging where the temperature of the skin is used as a measure of breathing (16). These three approaches all suffer from the limitation of not offering high spatial resolution; i.e. not being able to measure the body shape changes simultaneously at various points, as is useful for diagnostic purposes. Therefore there is currently no non-invasive (or
10
11
MATERIALS AND METHODS
12
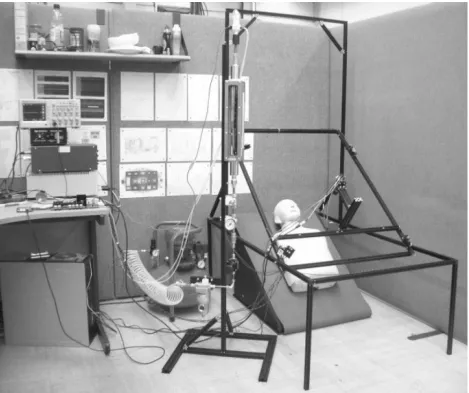
Figure 1. NORM Proof of Principle System; the final clinical system will either be mounted on the wall/ceiling, or will employ a simple bedside type stand.
13
interface electronics. The spirometer (pneumotachometry equipment), visible near the top of Figure 1, was calibrated for tidal breathing by employing an accompanying pneumatic rig prior to the capture of spirometric data. This provided ground truth breathing data with which to compare the NORM optical data, for benchmarking NORM.
In addition to providing overall breathing volume measurement, the NORM system provides high spatial resolution for localised diagnoses of lung conditions, while using an affordable digital camera. Good quality image capture was achieved by employing an area scan
14
Figure 2. Spectral response of Genie HM1400 / XDR Area Scan Monochrome Camera (Teledyne DALSA).
Figure 2 shows the spectral response of the camera employed, and although at longer wavelengths it drops considerably from its peak at 650nm, it can be seen that even at the relatively long wavelength of 850nm the sensitivity is reasonable at around 7 μJ/cm2
. It was also necessary to employ a lens optimised for transmission at the wavelength used, therefore a
15
[image:15.612.82.351.155.542.2]relatively uniform and wide illumination characteristic. The emission spectrum of these diodes is shown in Figure 3.
Figure 3: Emission spectrum of SFH 4730 Infrared LEDs.
16
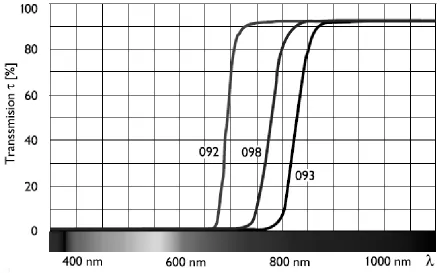
[image:16.612.76.516.330.603.2]transmission at the LED peak wavelength while minimising transmission at other wavelengths. This results in the signal to noise ratio being maintained/enhanced, so that camera integration times do not need to be increased to an extent that would impact the image acquisition rate, which is crucial for maximising the temporal resolution of the system. Coloured-glass infrared filters were employed since they are cost-effective and insensitive to the angle of incidence. The infra-red filter Schneider SKR FIL 093 was used, which has a transmission profile as shown in Figure 4.
17
It can be seen that at the wavelength of the LEDs, 850nm, the transmission of the filter is relatively high. It was found that the filter decreases the signal to 63%, while the noise
component comprising wavelengths shorter than 750nm are attenuated by the filter to less than 1% of their original value. Therefore the filtered system will have a signal to noise ratio at least a factor of 60 times better than in the unfiltered case. Clearly therefore, it is worth employing optical filtering in systems of this type.
Using the above components, NORM recovers surface orientation information which is processed to provide a bulk volume measurement of the patient’s torso volume over time.
Surface recovery is achieved by using a photometric stereo technique that employs multiple light sources, at known locations, and a single camera.
Photometric 4D Approach for Recovery and Modelling of the Torso
18
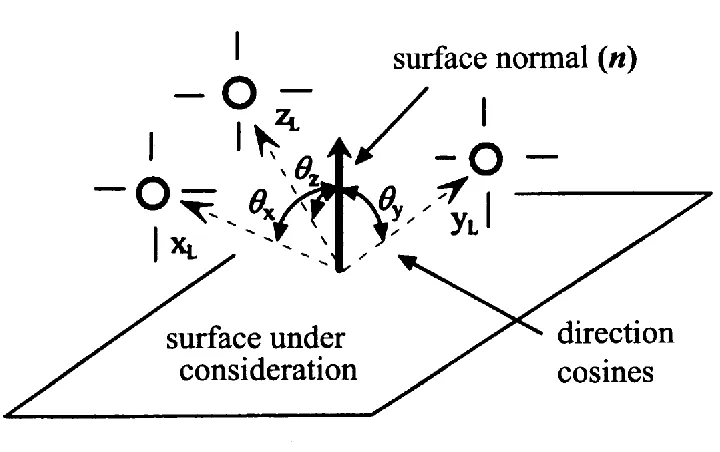
[image:18.612.116.476.163.389.2]shows the surface normal vector defined in terms of its three direction cosines, within the lighting coordinate frame (XL, YL, ZL).
Figure 5. Photometric stereo geometry for determination of the surface normal vector n.
The surface of the object is illuminated by at least three light sources at known locations, each with a
directional vector, with the camera above and pointing directly towards the surface.
A matt surface will reflect light approximating to Lambertian reflectance, exhibiting a cosine or scalar product relationship with respect to the light vectors. The magnitude of these three vectors (which form the axes of the lighting coordinate frame) will be determined by the intensity of the
three respective illuminates, which should be arranged to be equal. The corresponding pixel intensity
within each of the three acquired images, one respectively for each light (XL, YL, ZL), will be related
19
components can be calculated from the three respective images. Once the normal vector components
are known, the magnitude of the surface normal vector can also be calculated, and will be directly
proportional to the albedo of the surface material at the location being considered. Since the intensity
will be given by the dot product of the lighting and surface normal vector, the direction cosines of the
normal vector can be expressed as:
Өx = cos-1(xL.n/|xL||n|)
Өy = cos-1(yL.n/|yL||n|)
Өz = cos-1(zL.n/|zL||n|)
20
To convert the recovered surfaces into an instantaneous volume measurement, an integration technique is used, which employs the surface elements. Preliminary work has also begun on modelling the vertical cross-section of the torso as vertically stacked ellipses. This enables breathing performance to be evaluated at various localised regions of the torso; thereby
21
RESULTS
The NORM electronics and algorithms control the camera and lighting to microsecond precision. Auxiliary data such as spirometer data and environmental data can be captured at rates of
kilohertz, surpassing the recommended rate of 200Hz for Spirometry acquisition, and enabling detection of fine structure in respiration and lighting harmonics. The data acquisition software enabled easy capture of high resolution image data at a consistent rate of over 50Hz, enabling a dynamic analysis of 3D chest movement at 10Hz (four frames with directional lighting, and a background frame), which is over an order of magnitude faster than the rate of typical tidal breathing (~0.2Hz). The calibration apparatus successfully provided pneumatic flow rates in the range ±3L/s, with a high precision of ±7.5 mL/s. Preliminary results suggested that mains
powered fluorescent lighting introduced an optical noise component into the dynamic volumetric data. The fluorescent lighting fundamental was found to be 100.055Hz, with a FWHM of
0.06Hz. This frequency could produce a beating effect with a 50Hz imaging system, with a 36s period. It was however possible to eliminate this lighting interference by employing the optical filters described above.
Comparison of the Optical Volumetric Data to the Pneumatic ‘Ground Truth’
22
rate of dV/dt = cos(ωt), the volume signal will be V = sin(ωt) + v0, 90° out of phase). Performing
a numerical differentiation and noise filtering, yielded an optical flow signal in phase with the pneumatic flow signal, confirming the detection of tidal breathing.
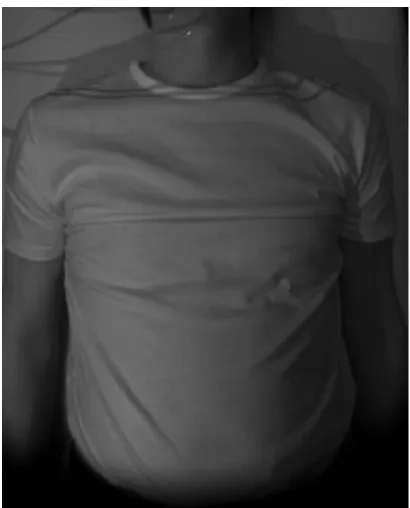
[image:22.612.71.276.317.571.2]The equipment shown in Figure 1 successfully captured data at 50fps, enabling 10fps of full 3D data to be recovered. The system was operated with the mannequin replaced by a volunteer patient breathing through a spirometer, while NORM captured vision data from their torso; an example of a captured image is shown in Figure 6.
Figure 6. Example image from the NORM patient dataset.
23
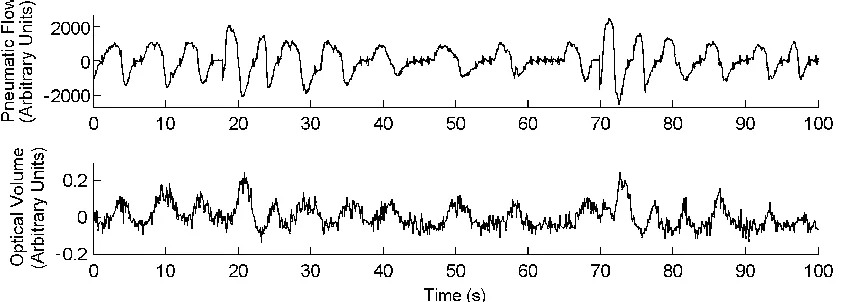
[image:23.612.86.509.352.503.2]frequency corresponding with that of the benchmark pneumotachograph data. There is also a consistent phase relationship between the two signals; which is as expected, with the pneumatic signal lagging behind the volume signal by 90° (one quarter of a tidal cycle): i.e. the volume measurement peaks and troughs are around the areas of zero flow-rate, as would be expected. Both data in Figure 7 were recorded synchronously using the NORM system, so no manual time alignment was required or used to combine the two datasets. At seventeen seconds an occlusion is visible, which is believed to be caused by the patient swallowing. There is a corresponding plateau in the optical data with a slight delay as the phase relationship returns to its nominal relative value to the tidal flow rate.
Figure 7. Concurrent plot of the time-dependent bulk volume measurement from the image data plotted against the synchronously captured benchmark pneumotachometer data. The pneumatic signal (dV/dt) lags the optical signal (V(t)) by 90° (one quarter of a tidal cycle): i.e. the volume measurement peaks and troughs are around the areas of zero flow-rate.
24
lower limit of ambient interference (Tmin = 28.9 s); therefore it can be safely concluded that in
25
DISCUSSION
26
(OSA), thereby potentially assisting with obviation of lengthy, laborious and expensive
conventional polysomnography. The high spatial and temporal resolution that has been found to be achievable with the NORM approach means that it offers a capability to monitor or diagnose a number of respiratory related disorders that include neurological disorders, muscle motion and orthopaedic conditions; with the ability to detect regional movement providing further diagnostic functionality. Benefits may include increased sensitivity in detecting early signs of respiratory dysfunction in high risk patients, or localised diagnoses of particular lung conditions and
identification of regions of dysfunction. The approach may also be useful for analysis of cardiac disorders and the monitoring of any conditions that lead to changes in torso morphology.
27
also been reported (20). The extent of the recovery also appears dependent upon the type of surgery employed, with endoscopic methods being reported as leading to greater long-term improvement in pulmonary function than open anterior approaches (21). The ability to detect and quantify these changes has motivated the focus of NORM on scoliosis, along with an
appreciation that the technology can also be used to capture the morphology of the back of a patient in real time. This provides an opportunity to directly recover 3D torso features that can be used to measure the Cobb Angle, before and after surgery (22). This therefore has potential to offer a vision based screening or diagnostic functionality that offers benefits over the
conventional approach of employing x-rays. These benefits include avoidance of the use of ionizing radiation, and potential for eliminating the error in measured Cobb Angle that can result from parallax effects when using orthogonal x-rays to image a twisted spine.
Strengths of the NORM approach include its ability to work with unconstrained patients and in darkness. These factors will enable it to be used for sleep analysis and in critical healthcare applications such as monitoring patients in intensive and neonatal care. The technique does have some limitations; these include expected accuracy reductions when the patient is covered with thick bedclothes and possible occlusion or accuracy limits resulting from images and
28
29
ACKNOWLEDGEMENTS
This paper presents independent research funded by the National Institute for Health
Research (NIHR) Invention for Innovation (i4i) Programme (II-FS-0908-10078). The views expressed are those of the author(s) and not necessarily those of the NHS, the NIHR or the Department of Health.
The research associate who worked on the NORM project at UWE was Mr Scott Mandry.
DISCLAIMER
30
References
1. Haland G,Carlsen K, Sandvik L. Reduced lung function at birth and the risk of asthma at 10 years of age. N Engl J Med. 2006;355:1682-1689.
2. Bisgaard H, Jensen S, Bønnelykke K. Interaction between asthma and lung function growth in early life. Am J Respir Crit Care Med 2012;185:1183-9.
3. Kozlowska W, Bush A, Wade A, Aurora P, Carr SB, Castle RA, Hoo AF, Lum S, Price J, Ranganathan S, Saunders C, Stanojevic S, Stroobant J, Wallis C, Stocks J; London Cystic Fibrosis Collaboration. Lung Function from Infancy to the Preschool Years after Clinical Diagnosis of Cystic Fibrosis. Am J Respir Crit Care Med 2008;178:42-49.
4. Izatt M, Harvey J, Adam C. Recovery of pulmonary function following endoscopic anterior scoliosis correction: Evaluation at 3, 6, 12, and 24 months after surgery. Spine 2006;31 :2469-2477.
5. Fieselmann J, Hendryx M, Helms C. Respiratory rate predicts cardiopulmonary arrest for internal medicine inpatients. J Gen Intern Med 1993;8:354-360.
31
7. Goldhill D, McNarry A, Mandersloot G. A physiologically-based early warning score for ward patients: the association between score and outcome. Anaesthesia 2005;60:547–553.
8. Cretikos M, Chen J, Hillman K, Bellomo R. The objective medical emergency team activation criteria: a case-control study. Resuscitation 2007;73:62-72.
9. Hargrove, J, Zemper, E. Respiratory measurement ustilizing a novel laser displacement technique: normal tidal breathing. Biomedical instrumentation and technology 2009;43:327-331.
10. Tobin M, Laghi F. Monitoring of respiratory muscle function. In: Principles and practice of intensive care monitoring. New York, NY: McGraw Hill; 1998. p. 497-544.
11. Main E, Castle R, Stocks J, James I, Hatch D. The influence of endotracheal tube leak on the assessment of respiratory function in ventilated children. Intensive Care Medicine,
2001;27(11):1788-1797.
12. Peacock A, Morgan M, Gourlay S, et al. Optical mapping of the thoracoabdominal wall. Thorax 1984;39:93-100.
32
14. Brand, D. Lau, E. Cameron, J. Wareham, R. Usher-Smith, J. Bridge, P. Lasenby, J. Iles, R. Tidal breathing parameters measured by structured light plethysmography (SLP) and spirometry. American Thoracic Society International Conference Abstracts, 2010;B18.
15. Scalise, L. Ercoli, I. Marchionni, P. Tomasini, E. Measurement of respiration rate in preterm infants by laser Doppler vibrometry. Medical Measurements and Applications Proceedings (MeMeA), 2011 IEEE International Workshop.
16. Murthy, J. Pavlidis, I. Noncontact measurement of breathing function. Engineering in Medicine and Biology Magazine, IEEE. 2006;25(3):57-67.
17. Ranganathan S, Dezateux C, Bush A, et al. Airway function in infants newly diagnosed with cystic fibrosis. The Lancet 2001;358:1964-5.
18. Sun J, Smith M, Smith L, et al. Object Surface Recovery Using a Multi-Light Photometric Stereo Technique for non-Lambertian Surfaces Subject to Shadows and Specularities. Image and Vision Computing 2007;25:1050–1057.
19. Ahmad J, Sun J, Smith L, Smith M. An improved photometric stereo through distance estimation and light vector optimization from diffused maxima region. Pattern Recognition Letters Published online first: 19 September 2013. doi:
33
20. Newton, P.O. Parent, S. Marks, M. Prospective evaluation of 50 consecutive scoliosis patients treated with Thoracoscopic Anterior Instrumentation. Spine. 2005;S100-109.
21. Izzat M. Harvey J. Adam C, Fender D, Labrom R, Askin G. Recovery of pulmonary function following endoscopic anterior scoliosis correction: Evaluation at 3, 6, 12, and 24 months after surgery. Spine. 2006;31(21):2469-2477.
34
Figure legends
Figure 1. NORM Proof of Principle System; the final clinical system will either be mounted on the wall/ceiling, or will employ a simple bedside type stand.
Figure 2. Spectral response of Genie HM1400 / XDR Area Scan Monochrome Camera (Teledyne DALSA).
Figure 3: Emission spectrum of SFH 4730 Infrared LEDs.
Figure 4. Transmission Profile for Infra-Red filter Schneider SKR FIL 093, (profiles for two other filters are also shown).
Figure 5. Photometric stereo geometry for determination of the surface normal vector n.
Figure 6. Example image from the NORM patient dataset.