Seniz Demir
∗ TUBITAK-BILGEMSandra Carberry
∗∗ University of DelawareKathleen F. McCoy
† University of DelawareInformation graphics (such as bar charts and line graphs) play a vital role in many multimodal documents. The majority of information graphics that appear in popular media are intended to convey a message and the graphic designer uses deliberate communicative signals, such as highlighting certain aspects of the graphic, in order to bring that message out. The graphic, whose communicative goal (intended message) is often not captured by the document’s accompanying text, contributes to the overall purpose of the document and cannot be ignored. This article presents our approach to providing the high-level content of a non-scientific information graphic via a brief textual summary which includes the intended message and the salient features of the graphic. This work brings together insights obtained from empirical studies in order to determine what should be contained in the summaries of this form of non-linguistic input data, and how the information required for realizing the selected content can be extracted from the visual image and the textual components of the graphic. This work also presents a novel bottom–up generation approach to simultaneously construct the discourse and sentence structures of textual summaries by leveraging different discourse related considerations such as the syntactic complexity of realized sentences and clause embeddings. The effectiveness of our work was validated by different evaluation studies.
1. Introduction
Graphical representations are widely used to depict quantitative data and the relations among them (Friendly 2008). Although some graphics are constructed from raw data only for visualization purposes, the majority of information graphics (such as bar charts and line graphs) found in popular media (such as magazines and newspapers) are
∗ The Scientific and Technological Research Council of Turkey, Center of Research for Advanced Technologies of Informatics and Information Security, Gebze, Kocaeli, TURKEY, 41470.
E-mail:[email protected]. (This work was done while the author was a graduate student at the Department of Computer and Information Sciences, University of Delaware, Newark, DE, USA 19716.) ∗∗ Department of Computer and Information Sciences, University of Delaware, Newark, DE, USA 19716.
E-mail:[email protected].
† Department of Computer and Information Sciences, University of Delaware, Newark, DE, USA 19716. E-mail:[email protected].
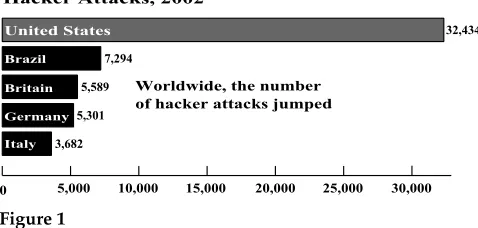
Figure 1
Graphic conveying a maximum bar.
constructed to convey a message. For example, the graphic in Figure 1 ostensibly is intended to convey that “The United States has the highest number of hacker attacks among the countries listed.” The graphic designer made deliberate choices in order to bring that message out. For example, the bar representing the United States is high-lighted with a different color from the other bars and the bars are sorted with respect to their values instead of their labels so that the bar with the highest value can be easily recognized. Such choices, we argue, are examples of communicative signals that graphic designers use. Under Clark’s definition (1996), language is not just text and utterances, but instead includes any deliberate signal (suchas gestures and facial expressions) that is intended to convey a message; thus an information graphic is a form of language.
In popular media, information graphics often appear as part of a multimodal document. Carberry, Elzer, and Demir (2006) conducted a corpus study of information graphics from popular media, where the extent to which the message of a graphic is also captured by the text of the accompanying document was analyzed. One hundred randomly selected graphics of different kinds (e.g., bar charts and line graphs) were collected from newspapers and magazines along withtheir articles. It was observed that in 26% of the instances, the text conveyed only a small portion of the graphic’s message and in 35% of the instances, the text didn’t capture the graphic’s message at all. Thus graphics, together with the textual segments, contribute to the overall purpose of a document (Grosz and Sidner 1986) and cannot be ignored. We argue that information graphics are an important knowledge resource that should be exploited, and understanding the intention of a graphic is the first step towards exploiting it.
In this article, we investigate answers to the following questions: (1) Among all possible information that could be conveyed about a bar chart, what should be included in its summary? (2) How should the content of a summary be organized into a coherent text? (3) How should the text structure be best realized in natural language? Given the intended message and the XML representation of a graphic, our system first determines the content of the graphic’s summary (a list of propositions) by applying the content identification rules constructed for that intended message category. Our system then produces a coherent organization of the selected content by applying a bottom–up approachwhichleverages a variety of considerations (suchas the syntactic complexity of the realized sentences and clause embeddings) in choosing how to aggregate informa-tion into sentence-sized units. The system finally orders and realizes the sentence-sized units in natural language and generates referring expressions for graphical elements that are required in realization.
The rest of this article is structured as follows. Section 2 discusses related work on summarization of non-linguistic input data and describes some natural language applications which could benefit from summaries generated by our work. Section 3 outlines our summarization framework. Section 4 is concerned withidentifying the propositional content of a summary and presents our content-identification rules that specify what should be included in the summary of a graphic. Section 5 describes our bottom–up approach, which applies operators to relate propositions selected for inclusion, explores aggregating them into sentence-sized units, and selects the best orga-nization via an evaluation metric. Section 6 presents our sentence-ordering mechanism, which incorporates centering theory to specify the order in which the sentence-sized units should be presented. Section 7 describes how our system realizes the selected content in natural language. Particular attention is devoted to our methodology for generating referring expressions for certain graphical elements such as a descriptor of what is being measured in the graphic. Section 8 presents a user study that was conducted to evaluate the effectiveness of the generated summaries for the purposes of this research by measuring readers’ comprehension. Section 9 concludes the article and outlines our future work.
2. Background 2.1 Related Work
There has been a growing interest in language systems that generate textual summaries of non-linguistic input data (Reiter 2007). The overall goal of these systems, generally referred to asdata-to-text systems, is to enable efficient processing of large volumes of numeric data by supporting traditional visualisation modalities and to reduce the effort spent by human experts on analyzing the data. Various examples of data-to-text systems in the literature include systems that summarize weather forecast data (Goldberg, Driedger, and Kittredge 1994; Coch1998), stock market data (Kukich 1983), and georeferenced data (Turner, Sripada, and Reiter 2009).
project was extended to the medical domain. The BabyTalk (Gatt et al. 2009) project produces textual summaries of clinical data collected for babies in a neonatal intensive care unit, where the summaries are intended to present key information to medical staff for decision support. The implemented prototype (BT-45) (Portet et al. 2009) generates multi-paragraphsummaries from large quantities of heterogeneous data (e.g., time series sensor data and the records of actions taken by the medical staff). The overall goal of these systems (identifying and presenting significant events) is similar to our goal of generating a summary that conveys what a person would get by viewing an information graphic, and these systems contend with each of the generation issues we must face with our system. Our generation methodology, however, is different from the approaches deployed in these systems in various respects. For example, BT-45 produces multi-paragraph summaries where each paragraph presents first a key event (of highest importance), then events related to the key event (e.g., an event that causes the key event), and finally other co-temporal events. Our system, on the other hand, produces single-paragraph summaries where the selected propositions are grouped and ordered with respect to the kind of information they convey. In addition, BT-45 performs a limited amount of aggregation at the conceptual level, where the aggregation is used to express the relations between events with the use of temporal adverbials and cue phrases (such asas a result). Contrarily, our system syntactically aggregates the selected propositions with respect to the entities they share.
There is also a growing literature on summarizing numeric data visualized via graphical representations. One of the recent studies, the iGRAPH-Lite (Ferres et al. 2007) system, provides visually impaired users access to the information in a graphic via keyboard commands. The system is specifically designed for the graphics that appear in “The Daily” (Statistics Canada’s main dissemination venue) and presents the user with a template-based textual summary of the graphic. Although this system is very useful for in depthanalysis of statistical graphs and interpreting numeric data, it is not appropriate for graphics from popular media where the intended message of the graphic is important. In the iGRAPH-Lite system, the summary generated for a graphic conveys the same information (such as the title of the graphic, and the maximum and minimum values) no matter what the visual features of the graphic are. The content of the summaries that our system generates, however, is dependent on the intention and the visual features of the graphic. Moreover, that system does not consider many of the generation issues that we address in our work.
Choosing an appropriate presentation for a large amount of quantitative data is a difficult and time-consuming task (Foster 1999). A variety of systems were built to automatically generate presentations of statistical data—such as the PostGraphe sys-tem (Corio and Lapalme 1999; Fasciano and Lapalme 2000), which generates graphics and complementary text based on the information explicitly given by the user such as the intention to be conveyed in the graphic and the data of special interest to the user. The content of the accompanying text is determined according to the intention of the graphic and the features of the data. Moreover, the generated texts are intended to reinforce some important facts that are visually present in the graphic. In this re-spect, the generation in PostGraphe is similar to our work, although the output texts have a limited range and are heavily dependent on the information explicitly given by the user.
2.2 Role of Graphical Summaries in Natural Language Applications
text can be delivered via screen reader programs but visually impaired individuals are generally stymied when they come across graphics. These individuals can only receive the ALT text (human-generated text that conveys the content of a graphic) associated with the graphic. Many electronic documents do not provide ALT texts and even in the cases where ALT text is present, it is often very general or inadequate for conveying the intended message of the graphic (Lazar, Kleinman, and Malarkey 2007).
Researchers have explored different techniques for providing access to the in-formational content of graphics for visually impaired users, such as sound (Meijer 1992; Alty and Rigas 1998), touch(Ina 1996; Jayant et al. 2007), or a combination of the two (Kennel 1996; Ramloll et al. 2000). Unfortunately, these approaches have serious limitations suchas requiring the use of special equipment (e.g., printers and touch panels) or preparation work done by sighted individuals. Research has also investigated language-based accessibility systems to provide access to graphics (Kurze 1995; Ferres et al. 2007). As mentioned in Section 2.1, these language-based systems are not appropriate for graphics in articles from popular media where the intended message of the graphic is important. We hypothesize that providing alternative access to what the graphic looks like is not enough and that the user should be provided with the message and knowledge that one would gain from viewing the graphic. We argue that the textual summaries generated by our approach could be associated with graphics as ALT texts so that individuals with sight impairments would be provided with the high-level content of graphics while reading electronic documents via screen readers.
2.2.2 Document Summarization.Research has extensively investigated various techniques for single (Hovy and Lin 1996; Baldwin and Morton 1998) and multi-document summa-rization (Goldstein et al. 2000; Schiffman, Nenkova, and McKeown 2002). The summary should provide the topic and an overview of the summarized documents by identifying the important and interesting aspects of these documents. Document summarizers generally evaluate and extract items of information from documents according to their relevance to a particular request (suchas a request for a person or an event) and address discourse related issues suchas removing redundancies (Radev et al. 2004) and ordering sentences (Barzilay, Elhadad, and McKeown 2002) in order to make the summary more coherent.
It is widely accepted that to produce a good summary of a document, one must understand the document and recognize the communicative intentions of the author. Summarization work primarily focuses on the text of a document but, as mentioned earlier, information graphics are an important part of many multimodal documents that appear in popular media and these graphics contribute to the overall commu-nicative intention of the document. We argue that document summarization should capture the high-level content of graphics that are included in the document, because information graphics often convey information that is not repeated elsewhere in the document. We believe that the summary of a graphic generated by our system, which provides the intended message of the graphic and the information that would be perceived with a casual look at the graphic, might help in summarizing multi-modal documents.1
3. System Overview
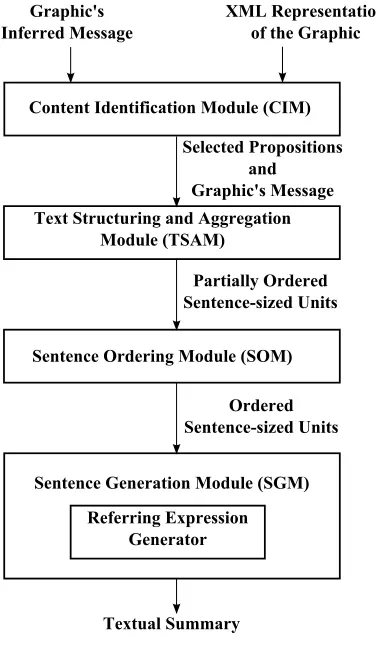
[image:6.486.49.237.316.640.2]Figure 2 provides an overview of the overall system architecture. The inputs to our system are an XML representation of a bar chart and the intended message of the chart; the former is the responsibility of a Visual Extraction System (Chester and Elzer 2005) and the latter is the responsibility of a Bayesian Inference System (Elzer, Carberry, and Zukerman 2011). Given these inputs, the Content Identification Module (CIM) first identifies the salient and important features of a graphic that are used to augment its inferred message in the summary. The propositions conveying the selected features and the inferred message of the graphic are then passed to the Text Structuring and Aggre-gation Module (TSAM). This module produces a partial ordering of the propositions according to the kind of information they convey, and aggregates them into sentence-sized units. The Sentence Ordering Module (SOM) then determines the final ordering of the sentence-sized units. Finally, the Sentence Generation Module (SGM) realizes these units in natural language, giving particular attention to generating referring expressions for graphical elements when appropriate. In the rest of this section, we briefly present the systems that provide input to our work and describe the corpus of bar charts used for developing and testing our system. The following sections then describe the modules implemented within our system in greater detail, starting from the Content Identification Module.
Figure 2
3.1 Visual Extraction System
The Visual Extraction System (Chester and Elzer 2005) analyzes a graphic image (visual image of a bar chart) and creates an XML representation specifying the components of the graphic, such as the height and color of each bar, any annotations on a bar, the caption of the graphic, and so forth. The current implementation handles vertical and horizontal bar charts that are clearly drawn with specific fonts and no overlapping characters. The charts can have a variety of textual components such as axis labels, caption, further descriptive text, text inside the graphic, and text below the graphic. The current system cannot handle 3D charts, charts where the bars are represented by icons, or charts containing texts at multiple angles, however.
3.2 Bayesian Inference System for Intention Recognition
The Bayesian Inference System (Elzer, Carberry, and Zukerman 2011) treats an informa-tion graphic as a form of language with a communicative inteninforma-tion, and reasons about the communicative signals present in the graphic to recognize its intended message. The system is currently limited to simple bar charts and takes as input the XML representa-tion of the chart produced by the Visual Extracrepresenta-tion System described previously.
Three kinds of communicative signals that appear in bar charts are extracted from a graphic and utilized by the system. The first kind of signal is the relative effort required for various perceptual and cognitive tasks. The system adopts the AutoBrief (Kerpedjiev and Roth 2000) hypothesis that the graphic designer chooses the best design to facilitate the perceptual and cognitive tasks that a viewer will need to perform on the graphic. Thus, the relative effort for different perceptual tasks serves as a communicative signal about what message the graphic designer intended to convey (Elzer et al. 2006). The second and third types of communicative signals used in the system are salience and the presence of certain verbs and adjectives in the caption that suggest a particular message category. The presence of any of these three kinds of communicative signals are entered into a Bayesian network as evidence. The top level of the network captures one of the 12 message categories that have been identified as the kinds of messages that can be conveyed by a bar chart, such as conveying a change in trend (Changing Trend) or conveying the bar with the highest value (Maximum Bar). The system produces as output the hypothesized intended message of a bar chart as one of these 12 message categories, along with the instantiated parameters of the message category, in the form of a logical representation such as Maximum Bar(first bar) for the graphic in Figure 1 and Increasing Trend(first bar, last bar) for the graphic in Figure 3a.
3.3 Corpus of Graphics
Figure 3
(a) Graphic conveying an increasing trend. (b) Graphic conveying the ranking of all bars.
In the work described in this article, we only used the bar charts whose intended message was correctly recognized by the Bayesian Inference System and associated each chart with the inferred message category. Here, our intent is to describe a generation approach that works through a novel problem from beginning to end by handling a multitude of generation issues. Thus, using bar charts with the perfect intention is reasonably appropriate within the scope of the present work. For each bar chart, we also used the XML representation that was utilized by the Bayesian Inference System. Slightly less than half of the selected bar charts were kept for testing the system per-formance (which we refer to as thetest corpus), and the remaining graphs were used for developing the system (which we refer to as thedevelopment corpus). Because the number of graphics in the development corpus was quite limited, we constructed a number of bar charts2 in order to examine the effects of individual salient features observed in the graphics from the development corpus. These graphs, most of which were obtained by modifying original graphics, enabled us to increase the number of graphics in the development corpus and to explore the system behavior in various new cases.
4. Content Identification Module (CIM)
Our ultimate goal is to generate a brief and coherent summary of a graphic. Identifying and realizing the high-level informational content of a graphic is not an easy task, however. First, a graphic depicts a large amount of information and therefore it would be impractical to attempt to provide all of this information textually to a user. Second, a graphic is chosen as the communication medium because a reader can get information from it at many different levels. A casual look at the graphic is likely to convey the intended message of the graphic and its salient features. At the same time, a reader could spend much more time examining the graphic to further investigate something of interest or something they noticed during their casual glance.
In order to address the task of identifying the content of a summary, we extend to simple bar charts the insights obtained from an informal experiment where human participants were asked to write a brief summary of a series of line graphs with the same high-level intention (McCoy et al. 2001). The most important insight gained from
this study is that the intended message of a graphic was conveyed in all summaries no matter what the visual features of the graphic were. It was observed that the participants augmented the intended message with salient features of the graphic (e.g., if a line graph is displaying an increasing trend and the variance in that trend is large, then the variance is salient) and that what was found salient depended on the graphic’s intended message. Because the participants generated similar summaries for a par-ticular graphic, we hypothesize that they perceived the same salient features for that graphic. Although the set of features that might be salient is the same for different graphics sharing the same underlying intention, the differences observed between the summaries generated for different graphics with the same intention can be explained by whether or not the features are salient in those graphics. The fact that the summaries did not include all information that could be extracted from the graphic (such as the value of every point in a line graph) but only visually salient features, correlates with Grice’s Maxim of Quantity (1975) which states that one’s discourse contribution should be as informative as necessary for the purposes of the current exchange but not more so.
To extend these observations to constructing brief summaries of bar charts, we hypothesize that (1) the intended message of the bar chart should form the core of its textual summary and (2) the most significant and salient features of the bar chart, which are related to its intended message, should be identified and included in that summary. The inferred intended message of a bar chart serves as a starting point for our content identification approach. In the rest of this section, we first describe a series of experiments that we conducted to identify what constitutes the salient features of a given bar chart and in which circumstances these features should be included in its textual summary. We then present the content identification rules that were constructed to automatically select appropriate content for the summary of a bar chart.
4.1 Experiments
We conducted a set of formal experiments to find patterns between the intended mes-sage of a graphic, salient visual features of the displayed data, and the propositions selected for inclusion in a brief summary. We identified the set of all propositions (PROPALL) that capture information that we envisioned someone might determine by looking at a bar chart. This set included a wide variety of pieces of information present in a bar chart and contained propositions common to all bar charts as well as propositions which were applicable only to some of the message categories. The following is a subset of the identified propositions. In this example, Propositions 1–4 are common to all bar charts; in contrast, Propositions 5–8 are only present when the bar chart is intended to convey a trend:
r
The labels of all bars (Proposition 1)r
The value of a bar (Proposition 2)r
The percentage difference between the values of two bars (Proposition 3)r
The average of all bar values (Proposition 4)r
The change observed at a time period (Proposition 7)r
The difference between the largest and the smallest changes observed in the trend (Proposition 8)Some propositions, which we refer to as open propositions, require instantiation (such as Propositions 2, 3, and 7 given here) and the information that they convey varies according to their instantiations.3 In addition, the instantiation of an open proposition may duplicate another proposition. For example, if the Proposition 3 is instantiated with the first and the last bars of the trend, then the information conveyed by that proposition is exactly the same as Proposition 6.
To keep the size of the experiment reasonable, we selected 8 message categories from among the 12 categories that could be recognized by the Bayesian Inference Sys-tem; these categories were the ones most frequently observed in our corpus and could be used as a model for the remaining message categories. These categories were Increasing Trend, Decreasing Trend, Changing Trend, Contrast Point with Trend, Maximum Bar, Rank Bar, Rank All, and Relative Difference. In the experiments, we did not use the categories Minimum Bar (which can be modeled via Maximum Bar), Relative Difference withDegree (whichcan be modeled via Relative Difference), Stable Trend (whichwas not observed in the corpus), and Present Data (which is the default category selected when the system cannot infer an intended message for the graphic).
For each message category, we selected two to three original graphics from the development corpus, where the graphics with the same intended message presented different visual features. For example, we selected two graphics conveying that a par-ticular bar has the highest value among the bars listed, but only in one of these graphics was the value of the maximum bar significantly larger than the values of the other bars (such as the graphic in Figure 1). In total, 21 graphics were used in the experiments and these graphics covered all selected intended message categories. Because the number of propositions applicable to eachmessage category was quite large, 10–12 propositions were presented for eachgraphic. Eachgraphic was presented to at least four partici-pants. Overall, the experiments covered all selected intended message categories and all identified propositions.
Twenty participants, who were unaware of our system, participated in the experi-ments. The participants were graduate students or recent Ph.D. graduates from a variety of departments at the University of Delaware. Each experiment started with a brief description of the task, where the participants were told to assume that in each case the graphic was part of an article that the user is reading and that the most important information depicted in the graphic should be conveyed in its summary. They were also told that they would be given an information graphic along with a sentence conveying the intended message of the graphic and a set of propositions, and would be asked to classify these additional propositions into one of three classes according to how impor-tant they felt it was to include that proposition in the textual summary:4(1)Essential: This proposition should be included in the brief textual summary, (2) Possible: Th is proposition could be included in the brief textual summary but it’s not essential, and (3)
Not Important: This proposition should not be included in the brief textual summary.
3 We used open propositions in order to keep PROPALL within a manageable size.
4.2 Analysis
To analyze the experiment’s results, we first assigned a numeric score to each class indicating the level of importance assigned by the participants: Essential = 3, Possible = 1, Not-important = 0. We then calculated an “importance level” (IL) for each proposition with respect to a particular graphic, where the importance level estimates how important it is for that proposition to be included in the graphic’s summary. The importance level of a proposition was computed by summing the numeric scores associated with the classes assigned by the participants. For example, if three participants classified a proposition as Essential and two participants as Possible, th e importance level of that proposition in the graphic was (3×3) + (2×1) = 11. In cases where a proposition (Prop A) and an instantiated open proposition which conveyed the same information were classified by a participant into different classes for the same graphic, the classification of the proposition that came earlier in the presentation was used in computing the importance level of Prop A.
Given these computed scores, we needed to identify which propositions to con-sider further for inclusion in a summary. Because there was a divergence between the sets of propositions that were classified as essential by different participants, we decided to capture the general tendency of the participants. For this purpose, we definedmajority importance levelas a ranking criteria, which is the importance level that would be obtained if half of the participants classify a proposition as essential. For example, the majority importance level would be (6×3)/2 = 9 if there were six participants. We classified a proposition as a highly rated proposition if its importance level was equal to or above the majority importance level.5The propositions that were classified as highly rated for the graphics with a message category formed the set of highly rated propositions that should be considered for inclusion for that message category.
We had to ensure that the propositions presented to the participants (PROPALL) actually covered all information that is important enough to include in the summary of a bar chart. Thus, for each graphic, we also asked participants if there was anything else they felt should be included in the brief summary of the graphic. We received only a few isolated suggestions suchas a proposition conveying what type of a curve could fit the trend. Moreover, these suggestions were not common among the participants, and nothing was mentioned by more than one participant (indeed most did not make any suggestions). Thus, we concluded that these suggestions were not appropriate for the textual summary of a bar chart.
4.3 Content Identification Rules for Message Categories
Using the importance level scores, we needed to identify the subset of the highly rated propositions that should be included in the textual summary in addition to the graphic’s intended message. For each message category, we examined the similarities and the differences between the sets of highly rated propositions identified for the graphics
associated with that message category, related these differences to the visual features present in these graphics, and constructed a set of content identification rules for identifying propositions to be included in the summary of a graphic from that message category. If a proposition was marked as highly rated for all graphics in a particular message category, then its selection was not dependent on particular visual features present in these graphics. In such cases, our content identification rule simply states that the proposition should be included in the textual summary for every graphic whose inferred message falls into that message category. For the other propositions that are highly rated for only a subset of the graphics in a message category, we identified a fea-ture that was present in the graphics where the proposition was marked as highly rated and was absent when it was not marked as highly rated, and our content identification rules use the presence of this feature in the graphic as a condition for the proposition to be included in the textual summary. In addition, we observed that a highly rated proposition for a message category might require inclusion of another proposition for realization purposes. For example, in the Rank All message category, the proposition indicating the rank of each bar was identified as highly rated and thus could be included in the textual summary. Because the rank of a bar cannot be conveyed without its label, we added the proposition indicating the label of each bar to the content identification rule containing the rank proposition, although this extra proposition was not explicitly selected by the participants for inclusion. Notice that these steps—identifying features that distinguish one subset of graphs from the other and identifying propositions that need to be included for realizing other propositions—make it difficult to use machine learning for this task. In our case the number of possible features that can be extracted from a graphic is very large and it is difficult to know which features from among those may be important/defining in advance. In addition, the number of graphics in our development corpus is too small to expect machine learning to be effective.
The following are glosses of two partial sets of representative content identification rules. The first set is applicable to a graphic conveying an increasing trend and the second set is applicable to a graphic conveying the rankings of all bars present in the graph:
r
Increasing Trend message category:61. If (message categoryequals‘increasing trend’) then
include(proposition conveying the rate of increase of the trend): Include the proposition conveying the rate of increase of the trend
2. If (message categoryequals‘increasing trend’) and
notsteady7(trend) theninclude(proposition conveying the period(s) witha decrease):8
If the trend is not steady and has variability, then include the proposition indicating where the trend varies
6 The “notsteady” function returns true if its argument is not a steady trend; the “value” function returns the values of all members of its argument; the “greaterthan” function returns true if the left argument is greater than the right argument; the “withinrange” function returns true if all members of its left argument are within the range given by its right argument; the “average” function returns the average of the values of all members of its argument.
7 A trend is unsteady if there is at least one period with a decrease in contrast with the increasing trend. 8 The inclusion of propositions whose absence might lead the user to draw false conclusions is consistent
3. If (message categoryequals‘increasing trend’) and (value(last bar)
greaterthan(3*value(first bar))) theninclude(proposition conveying the overall percentage increase in the trend):
If the overall percentage increase in the trend is significantly large, then include the proposition conveying the percentage increase in the trend
r
Rank All message category:1. If (message categoryequals‘rank all’) theninclude(propositions conveying the label and the value of the highest bar):
Include the propositions conveying the label and the value of the highest bar
2. If (message categoryequals‘rank all’) and (value(all bars)
withinrange((0.7*average(all bars)),(1.3*average(all bars)))) then
include(proposition indicating that the bar values vary slightly): If the values of bars are close to each other, then include the proposition indicating that the bar values vary slightly
3. If (message categoryequals‘rank all’) and (not(value(all bars)
withinrange((0.7*average(all bars)),(1.3*average(all bars))))) then
include(propositions conveying the label and the value of the lowest bar):
If the values of bars are not close to each other, then include the propositions conveying the label and the value of the lowest bar
We defined the conditions of all content identification rules as a conjunction of one or more expressions where some expressions required us to determine threshold values to be used for comparison purposes. For example, we observed that the proposition conveying the overall percentage change in the trend was marked as highly rated only for graphics which depicted a significant change in the trend. We handled this situation for graphics with an increasing trend by defining the third content identi-fication rule (shown earlier) where we needed to set the lowest threshold at which an overall increase observed in a trend can be accepted as significantly large. For setting such threshold values, we examined all graphs in the development corpus to which the corresponding content identification rule is applicable (i.e., the graphs associated with the message category for which the rule is defined) and used our intuitions about whether the proposition captured by the rule should be selected for inclusion in the summaries of these graphs. We set the threshold values using the results obtained from group discussions such that the final setting classified all of the original graphics the way the participants did in the experiments described in Section 4.1.
When the content identification rules constructed for the Increasing Trend message category are applied to the bar chart in Figure 3a, the following pieces of information are selected for inclusion in addition to the intended message of the graphic:
r
The rate of increase of the trend, which is slightr
The small drop observed in the year 1999When the content identification rules constructed for the Rank All message category are applied to the bar chart in Figure 3b, the following pieces of information are selected for inclusion in addition to the intended message of the graphic:
r
The label and the value of the highest bar, which is Army with 233,030r
The label and the value of the lowest bar, which is Other defense agencieswith100,678
r
The label and the ranking of each bar:9Army is the highest, Navy is thesecond highest, Air Force is the third highest, and Other defense agencies is the lowest
4.4 Evaluation of the Content Identification Module
We conducted a user study to assess the effectiveness of our content identification module in identifying the most important information that should be conveyed about a bar chart. More specifically, the study had three goals: (1) to determine whether the set of highly rated propositions that we identified for each message category contains all propositions that should be considered for inclusion in the summaries of graphics with that message category; (2) to determine how successful our content identification rules are in selecting highly rated propositions for inclusion in the summary; and (3) to determine whether the information conveyed by the highly rated propositions is misleading or not.
Nineteen students majoring in different disciplines (suchas Computer Science and Materials Science and Engineering) at the University of Delaware were participants in the study. These students neither participated in the earlier study described in Sec-tion 4.1 nor were aware of our system. Twelve graphics from the test corpus (described in Section 3.3) whose intended message was correctly identified by the Bayesian Infer-ence System were used in the experiments. Once the intended message was recognized, the corresponding content identification rules were executed in order to determine the content of the graphic’s summary. Prior to the experiment, all participants were told that they would be given a summary and that it should include the most important information that they thought should be conveyed about the graphic. Each participant was presented with three graphics from among the selected graphics such that each graphic was viewed by at least four participants. For each graphic, the participants were first given the summary of the graphic generated by our approach and then shown the graphic. The participants were then asked to specify if there was anything omitted that they thought was important and therefore should be included in the summary. In addition, the participants were asked to specify whether or not they were surprised or felt that the summary was misleading (i.e., whether the bar chart was similar to what they expected to see after reading its summary). Note that our summaries with relatively few propositions are quite short. Thus our evaluation focused on determin-ing whether anythdetermin-ing of importance was missdetermin-ing from the summary or whether the summary was misleading. In the experiments, we did not ask the participants to rate
the content of summaries on a numeric scale in order to restrict them to evaluating only the selected content as opposed to its presentation (i.e., the organization and realization of the summary).
Feedback that we received from the participants was very promising. In most of the cases (43 out of 57 cases), the participants were satisfied with the content that our approach selected for the presented bar charts. There were a number of suggestions for what should be added to the summaries in addition to what had already been conveyed, and in a couple of these cases, we observed that a highly rated proposition which was not selected by the corresponding content identification rule was contrarily suggested by the participants. There was no consensus in these suggestions, however, as none was made by more than two participants. Some of the participants (3 out of 19) even commented that we provided more information than they could easily get from just looking at the graphic. In addition, a few participants (2 out of 19) commented that, in some graphics, they didn’t agree with the degree (e.g., moderate or steep) assessed by our approach for differences between bar values (e.g., the rate of change of the trend), and therefore they thought the summary was misleading. Because there wasn’t any common consensus among the participants, we didn’t address this very subjective issue. Overall, we conclude that the sets of highly rated propositions that we identified contain the most important information that should be considered for inclusion in the summaries of bar charts and that our system effectively selects highly rated propositions for inclusion when appropriate.
5. Text Structuring and Aggregation Module (TSAM)
A coherent text has an underlying structure where the informational content is pre-sented in some particular order. Good text structure and information ordering have proven to enhance the text’s quality by improving user comprehension. For example, Barzilay, Elhadad, and McKeown (2002) showed that the ordering has a significant impact on the overall quality of the summaries generated in the MULTIGEN system. Al-though previous research highlights a variety of structuring techniques, there are three prominent approaches that we looked to for guidance: top–down planning, application of schemata, and bottom–up planning.
In top–down planning (Hovy 1988, 1993; Moore and Paris 1993), the assumption is that a discourse is coherent if the hearer can recognize the communicative role of each of its segments and the relation between these segments (generally mapped from the set of relations defined in rhetorical structure theory (RST; Mann and Thompson 1987). The discourse is usually represented as a tree-like structure and the planner constructs a text plan by applying plan operators starting from the initial goal.
Marcu (1998) argued that text coherence can be achieved by satisfying local con-straints on ordering and clustering of semantic units to be realized. He developed a constraint satisfaction based approach to select the best plan that can be constructed from a given set of textual units and RST relations between them, and showed that such bottom–up planning overcomes the major weakness of top–down approaches by guaranteeing that all semantic units are subsumed by the resulting text plan. The ILEX system (O’Donnell et al. 2001), which generates descriptions for exhibits in a museum gallery, utilizes a similar bottom–up planning approach(Mellishet al. 1998) where the best rhetorical structure tree over the semantic units is used as the text structure.
Because our content identification rules identify a set of propositions to be con-veyed, it appears that a bottom–up approach that ensures that all propositions will be included is in order. At the same time, it is important that our generated text adheres to an overall discourse organization such as is provided by the top–down approaches. Because of the nature of the propositions (the kinds of rhetorical relations that can exist between propositions in a descriptive domain are arguably limited [O’Donnell et al. 2001]), however, a structure such as RST is not helpful here. Thus, the top–down planning approach does not appear to fit. Although something akin to a schema might work, it is not clear that our individual propositions fit into the kind of patterns used in the schema-based approach. Instead we use what can be considered a combination of a schema and a bottom–up approach to structure the discourse. In particular, we use the notion of global focus (Grosz and Sidner 1986) and group together proposi-tions according to the kind of information they convey about the graphic. We define three proposition classes (message-related, specific,andcomputational) to classify the propositions selected for inclusion in a textual summary. The message-related class contains propositions that convey the intended message of the graphic. The specific class contains the propositions that focus on specific pieces of information in the graphic, such as the proposition conveying the period with an exceptional drop in a graphic with an increasing trend or the proposition conveying the period with a change which is significantly larger than the changes observed in other periods in a graphic witha trend. Lastly, propositions in the computational class capture computations or abstractions over the whole graphic, such as the proposition conveying the rate of increase in a graphic with an increasing trend or the proposition conveying the overall percentage change in the trend. In our system, all propositions within a class will be delivered as a block. But we must decide how to order these blocks with respect to each other. In order to emphasize the intended message of the graphic (the most important piece of the summary), we hypothesize that the message-related propositions should be presented first. We also hypothesize that it is appropriate to close the textual summary by bringing the whole graphic back into the user’s focus of attention (Grosz and Sidner 1986) (via the propositions in the computational class). Thus, we define an ordering of the proposition classes (creating a partial ordering over the propositions) and present first the message-related propositions, then the specific propositions, and finally the computational propositions. Section 6 will address the issue of ordering the propositions within these three classes.
5.1 Representing Summary Content
the intended message and all of the propositions identified in our content identification rules. This representation scheme increases the number of aggregation and realization possibilities that could be explored by the system, which is described in the next subsection. We defined two kinds of knowledge-base predicates to represent the basic propositions:
(1) Relative Knowledge Base:These predicates are used to represent the basic propositions which introduce graphical elements or express relations between the graphical elements.
(2) Attributive Knowledge Base:These predicates are used to represent the basic propositions which present an attribute or a characteristic of a graphical element.
Eachpredicate contains at least two arguments and we refer to the first argument as themain entityand the others as thesecondary entities. The main entity of each predicate is a graphical element and the secondary entities are either a string constant or a graphical element. Some of the graphical elements that we used in this work are as follows:
r
graphic:“the graphic itself”r
trend:“the trend observed in the graphic”r
descriptor:“a referring expression that represents what is being measured in the graphic”10r
bar(x):“a particular bar in the graphic”1<=x<=n where n=number of bars in the graph
r
all bars:“all bars depicted in the graphic”bset={bar(x)|1<=x<=n}r
period(x,y):“a period depicted in the graphic” 1≤x<n and1<y≤nr
change(x,y):“ the change between the values of any two bars” 1≤x<n and1<y≤nr
all changes:“changes between all pairs of bars of the graphic” cset={change(x,y)|1≤x<n, 1<y≤n}r
trend period:“the period over which the trend is observed”r
graph period:“the period which is depicted by the graphic”r
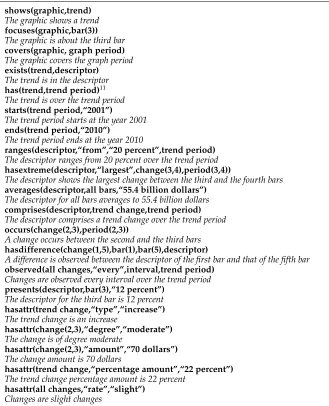
trend change:“the overall change observed in the trend”Table 1 presents sample instantiations of a subset of the predicates that we defined for this work along with a possible realization for each instantiation. Although the number of arguments in Relative Knowledge Base predicates (predicates 1 to 15) varies,
Table 1
Sample instantiations and possible realizations of a subset of our predicates.
1 shows(graphic,trend) The graphic shows a trend
2 focuses(graphic,bar(3)) The graphic is about the third bar
3 covers(graphic, graph period) The graphic covers the graph period
4 exists(trend,descriptor) The trend is in the descriptor
5 has(trend,trend period)11 The trend is over the trend period
6 starts(trend period,“2001”)
The trend period starts at the year 2001
7 ends(trend period,“2010”) The trend period ends at the year 2010
8 ranges(descriptor,“from”,“20 percent”,trend period) The descriptor ranges from 20 percent over the trend period
9 hasextreme(descriptor,“largest”,change(3,4),period(3,4))
The descriptor shows the largest change between the third and the fourth bars
10 averages(descriptor,all bars,“55.4 billion dollars”) The descriptor for all bars averages to 55.4 billion dollars
11 comprises(descriptor,trend change,trend period) The descriptor comprises a trend change over the trend period
12 occurs(change(2,3),period(2,3))
A change occurs between the second and the third bars
13 hasdifference(change(1,5),bar(1),bar(5),descriptor)
A difference is observed between the descriptor of the first bar and that of the fifth bar
14 observed(all changes,“every”,interval,trend period) Changes are observed every interval over the trend period
15 presents(descriptor,bar(3),“12 percent”) The descriptor for the third bar is 12 percent
16 hasattr(trend change,“type”,“increase”) The trend change is an increase
17 hasattr(change(2,3),“degree”,“moderate”) The change is of degree moderate
18 hasattr(change(2,3),“amount”,“70 dollars”) The change amount is 70 dollars
19 hasattr(trend change,“percentage amount”,“22 percent”) The trend change percentage amount is 22 percent
20 hasattr(all changes,“rate”,“slight”) Changes are slight changes
all Attributive Knowledge Base predicates (encoded as hasattr) consist of three argu-ments, where the first argument is the graphical element being described, the second is an attribute of the graphical element, and the third is the value of that attribute (predicates 16 to 20).12
11 Notice that the graphical element trend period in 5 is the main entity in 6 and 7. These all might be combined using the And operator to produce the realizationThe trend starts at the year 2001 and ends at the year 2010.
12 Because all Attributive Knowledge Base predicates have the same form, the amount and unit of a change are represented as a single string which is derived from the textual components of the graphic (such as
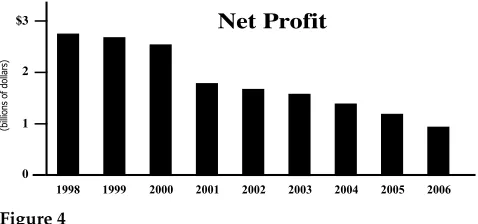
Figure 4
Graphic conveying a decreasing trend.
For example, consider how the propositions given in Section 4.1 can be represented with the predicates shown in Table 1. Some of those propositions require a single predicate. For example, the proposition conveying the value of a bar (Proposition 2) can be represented via the predicate “presents” (Predicate 15) and the proposition conveying the average of all bar values (Proposition 4) via the predicate “aver-ages” (Predicate 10). On the other hand, some propositions require more than one predicate. For example, the proposition conveying the overall percentage change in the trend shown in Figure 4 (Proposition 6) can be represented via the predi-cates “comprises(descriptor,trend change,trend period)” (Predicate 11), “starts(trend period,“1998”)” (Predicate 6), “ends(trend period,“2006”)” (Predicate 7), “hasattr(trend change,“type”,“decrease”)” (Predicate 16), and “hasattr(trend change,“percentage amount”,“65 percent”)”(Predicate 19). The same set of predicates can be used to rep-resent the overall amount of change in the trend by replacing the constant “percentage amount” withthe string “amount” in Predicate 19.
As is shown by the possible realizations included in Table 1, each basic proposition can be realized as a single sentence. Although we determined a couple of different ways (i.e., simple sentences) of realizing eachbasic proposition, our current imple-mentation always chooses a single realization (which we refer to as “the realization associated with the proposition”) and the main entity is always realized in subject position.13
5.2 Aggregating Summary Content
The straightforward way of presenting the informational content of a summary is to convey each proposition as a single sentence while preserving the partial ordering of the proposition classes. The resultant text would not be very natural and coherent, however. Aggregation is the process of removing redundancies during the generation of a more concise and fluent text (Shaw 1998; Dalianis 1999). Aggregation (typically syntactic aggregation [Reiter and Dale 2000]) has received considerable attention from the NLG community (McKeown et al. 1997; O’Donnell et al. 2001; Barzilay and Lapata 2006), and has been applied in various existing generation systems such as the intelligent tutoring application developed by Di Eugenio et al. (2005). Our aggregation mechanism works to combine propositions into more complex structures. It takes
advantage of the two types of predicates (Relative Knowledge Base and Attributive Knowledge Base predicates) and the shared entities between predicates. In order to relate propositions and explore syntactically aggregating them, our mechanism treats eachproposition as a single node tree whichcan be realized as a sentence and attempts to form more complex trees by combining individual trees via four kinds of operators in such a way so that the more complex tree (containing multiple propositions) can still be realized as a single sentence. The first operator (Attribute Operator) works only on propositions withan Attributive Knowledge Base predicate and essentially identifies opportunities to realize sucha proposition as an adjective attached to a noun object in the realization of another proposition. The remaining three operators, which do not work on propositions withan Attributive Knowledge Base predicate, introduce new nodes corresponding to operational predicates (And, Same, and Which) with a single entity into the tree structures. Two of these operators (And Operator and Which Operator) work on trees rooted by a proposition witha Relative Knowledge Base or an And predicate. These operators look for opportunities for VP conjunction and relative clauses, respectively. The third operator (Same Operator) works on trees rooted by a proposition witha Relative Knowledge Base predicate and identifies opportunities for NP conjunction. Althougheachpredicate is associated witha unique realization in the current implementation, none of these operators depend on how the corresponding predicates or the entities in those predicates are realized.
Having defined the operators we next had to turn to the problem of determining how these operators should be applied (e.g., which combinations are preferred). The operators we defined are similar to the clause-combining operations used by the SPoT sentence planner (Walker, Rambow, and Rogati 2002; Stent, Prasad, and Walker 2004; Walker et al. 2007) in the travel planner system AMELIA. In AMELIA, for each of the 100 different input text plans, a set of possible sentence plans (up to 20 plans) were generated by randomly selecting which operations to apply according to assumed preferences for operations. These possible sentence plans were then rated by two judges and the collected ratings were used to train the SPoT planner. Although we greatly drew from the work on SPoT as we developed our aggregation method, we chose not to follow their learning methodology. In the SPoT system, some of the features were domain- and task-dependent and thus porting to a new domain would require retraining. In addition, the judgments of the two raters were collected in isolation and it is unclear how these would translate to the task situation the texts were intended for. Although this methodology was innovative and necessary for SPoT because of the large number of possible text plans, we chose to select the best text plan on the basis of theoretically informed complexity features balancing sentence complexity and number of sentences. Because our text plans are significantly more constrained, it is possible to enumerate each of them and choose the one that best fits our rating cri-teria.14 This has the added benefit of better understanding the complexity features by evaluating the resulting text. In addition, our method would be open to both upgrad-ing the selection criteria and addupgrad-ing further aggregation operators without requirupgrad-ing retraining.15
14 Although in our implementation we do enumerate all plans before the rating criteria are applied to select the best one, it is in principle possible to generate the text plans in an order that would allow maximizing the scoring functions without first enumerating all possibilities. This is left for future work.
Operator:Attribute Operator
Gloss: This operator attaches a single node tree that consists solely of a proposition with an Attributive Knowledge Base predicate, as a direct subchild of a node N with a Relative Knowledge Base predicate in another tree, if the main entity of the Attributive Knowledge Base predicate is an entity (main or secondary) for the proposition at node N.
Input:T1 and T2 Constraints:
1. (pred(T1-root)==“hasattr”)
2. ((pred(T2-node)!=“hasattr”)∧(pred(T2-node)!=“And”)∧ (pred(T2-node)!=“Which”))
3. ((main ent(T1-root)==main ent(T2-node))∨ (main ent(T1-root)==secondary ent(T2-node))) Output: A modified T2 suchthat
1. left child(T2-node)←T1 Glossary:
1. Tx-root: the root node of tree Tx
2. Tx-node: any node in tree Tx (including Tx-root) 3. pred(Tx-node): the predicate at Tx-node
4. left/right child(Tx-node): the leftmost/rightmost child of Tx-node
5. main/secondary ent(Tx-node): the main/secondary entity of the proposition at Tx-node 6. !=: not equal, ==: equal, !: not,←: assign
Operator:And Operator
Gloss:This operator combines two trees if the propositions at their root share the same main entity. A proposition containing an And predicate with the same main entity forms the root of the new tree and the trees that are combined form the immediate descendents of this root. Input:T1 and T2
Constraints:
1. ((pred(T1-root)!=“hasattr”)∧(pred(T2-root)!=“hasattr”)) 2. !((pred(T1-root)==“And”)∧(pred(T2-root)==“And”)) 3. (main ent(T1-root)==main ent(T2-root))
Output: a new tree T3 where the root node has two immediate children such that 1. pred(T3-root)←“And”∧main ent(T3-root)←main ent(T1-root)
2. left child(T3-root)←T1∧right child(T3-root)←T2
Operator:Which Operator
Gloss:This operator attaches a tree (Tree A) as a descendent of a node N in another tree (Tree B) via a Which predicate, if the main entity of the proposition at the root of Tree A is a secondary entity for the proposition at node N of the other tree (Tree B). That particular entity forms the main entity of the Which predicate. Thus, Tree A will be an immediate child of the node with the Which predicate and the node with the Which predicate will be an immediate child of node N in Tree B.
Input:T1 and T2 Constraints:
1. ((pred(T1-root)!=“hasattr”)∧(pred(T2-node)!=“hasattr”)) 2. (main ent(T1-root)==secondary ent(T2-node))
Output:A modified T2 via the addition of a new node (Node x) with a single immediate child suchthat
Operator:Same Operator
Gloss: This operator combines two trees if the propositions at their root contain the same predicate but the main entities of these predicates are different. A proposition with a Same predicate forms the root of the new tree, and the trees that are combined form the descendents of this root. Since the descendents of the new tree have different main entities, the main entity of the Same predicate is some unique element not occurring elsewhere in the tree. For instance, in our implementation this element is obtained by appending a unique number, which isn’t used in another Same predicate in the current forest, to the termrandom(suchasrandom0).
Input:T1 and T2 Constraints:
1. ((pred(T1-root)!=“hasattr”)∧(pred(T2-root)!=“hasattr”)∧ (pred(T1-root)!=“And”)∧(pred(T2-root)!=“And”)∧ (pred(T1-root)!=“Same”)∧(pred(T2-root)!=“Same”)) 2. (pred(T1-root)==pred(T2-root))
3. (main ent(T1-root)!=main ent(T2-root))
Output: a new tree T3 where the root node has two immediate children such that 1. pred(T3-root)←“Same”∧main ent(T3-root)←a unique element
2. left child(T3-root)←T1∧right child(T3-root)←T2
In our work, we thus developed a method that would choose a text plan on prin-cipled reasoning concerning the resulting text. In particular, we looked to balance sen-tence complexity and the number of sensen-tences in the generated text. Moreover, whereas such a method was not applicable in the case of SPoT (because of the significantly larger set of operators withfew constraints resulting in potential text plans too numerous to evaluate), our work differs in several aspects that make it reasonable to generate all text plans and apply an evaluation metric. First, our system has a small number of aggregation operators and all operators cannot be applied to all kinds of predicates (e.g., the Attribute Operator cannot be applied to the Relative Knowledge Base predicates). Second, the number of possible sets of basic propositions that our system needs to organize is significantly lower than the number of possible text plans that the SPoT planner needs to consider. Finally, although it is not practical in SPoT to list all possible sentence plans that might be generated for a particular text plan (since the possibilities are too great), generating all possible combinations of propositions in a proposition class (such as message related class) is practical in our work. This is due to the fact that the number of basic propositions in eachclass is fairly small (e.g., usually between 5 to 15 propositions) and that the nature of the operators and constraints that we put on their application enable us to prune the space of possible combinations. Some of these constraints are: (1) The And Operator produces only one complex tree from a pair of trees and it cannot combine two trees if bothtrees have a proposition withan And predicate at their roots (thus we limit the number of conjuncts in a conjoined sentence to three at most16), and (2) the Attribute Operator produces only one complex tree in cases where a single node tree (Tree A) can be attached as a direct subchild of more than one node in another tree (Tree B); the parent of Tree A is the first such node found by preorder traversal of Tree B.
Our implementation first generates all possible text plans for the propositions within eachclass (message-related, specific, and computational). Eachtext plan is represented as a forest where each tree in the forest represents a sentence. Initially, eachproposition class is treated as a forest consisting of all single node trees in that class (initial candidate forest), and the operators are applied to that forest in order to produce new candidate forests for the proposition class. Anytime two trees in a
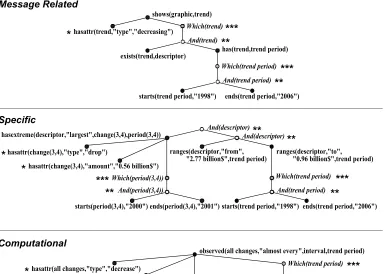
Figure 5
A candidate forest for eachproposition class.
candidate forest are combined via an operator, a new candidate forest is produced; the new candidate forest is added to the existing set of candidate forests, thereby increasing the number of candidate forests. Within each class, our approach first applies the And Operator to all possible pairs of trees in the initial candidate forest, which produces new candidate forests. The Same Operator is then applied to all possible pairs of trees in each candidate forest. Similarly, the Which Operator and the At-tribute Operator are applied to trees in the candidate forests produced earlier. The result of this aggregation is a number of candidate forests with one or more trees (eachusing different aggregation) for eachof the proposition classes. For example, Figure 5 shows one candidate forest that can be constructed for each proposition class by applying these operators to the propositions selected for the graphic in Figure 4, where each forest resulting from the aggregation consists of a single tree.17 In this example, the Attributive Knowledge Base predicates(*)are attached to their parents by the Attribute Operator, the nodes containing And predicates (**) are produced by the And Operator, and the Which predicates (***) are produced by the Which Operator.
5.3 Evaluating a Text Structure
Different combinations of operators produce different candidate forests in eachpropo-sition class and consequently lead to different realized text witha different complexity of sentences. The set of candidate forests for each proposition class must be evaluated to determine which one is best. Our objective is to find a forest that would produce text which stands at a midpoint between two extremes: a text where each proposition is realized as a single sentence and a text where groups of propositions are realized with sentences that are too complex. Our evaluation metric to identify the best forest leverages different considerations to balance these extremes. The first two criteria are concerned with the number and syntactic complexity of sentences that will be used to realize a forest. The third criteria takes into consideration how hard it is to comprehend the relative clauses embedded in these sentences. The insights that we use in selecting the best forest (e.g., balancing semantic importance, overall text structure, aggregation, and readibility due to sentence complexity) represent our novel contributions to the text structuring and aggregation literature. The theory that underlies our evaluation metric (i.e., what it is we are balancing in the generation) is widely applicable to other data-to-text generation domains because it uses general principles from the literature and has the potential to be improved.
5.3.1 Sentence Complexity. Eachtree (single node or complex) in a forest represents a set of propositions that can be realized as a single sentence. Our aggregation rules enable us to combine these simple sentences into more complex syntactic structures. In the literature, different measures to assess syntactic complexity of written text and spoken language samples have been proposed, with different considerations such as the right branching nature of English (Yngve 1960) and dependency distance between lexemes (Lin 1996). We apply the revised D-level sentence complexity scale (Covington et al. 2006) as the basis of our syntactic complexity measure. The D-level scale measures the complexity of a sentence according to its syntactic structure and the sequence in which children acquire the ability to use different types of syntactic structures. The sentence types with the lowest score are those that children acquire first and there-fore are the simplest types. Eight levels are defined in the study, some of which are simple sentences, coordinated structures (conjoined phrases or sentences), non-finite clause in adjunct positions, and sentences withmore than one level of relative clause embedding.
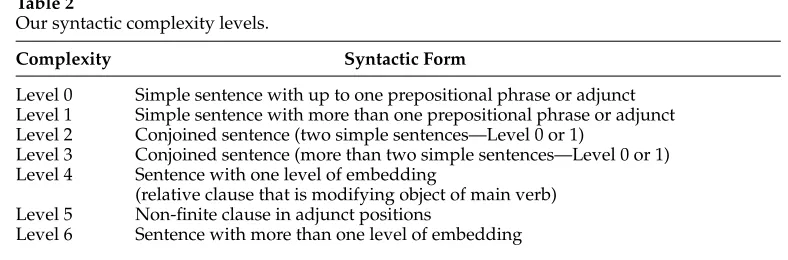
Table 2
Our syntactic complexity levels.
Complexity Syntactic Form
Level 0 Simple sentence withup to one prepositional phrase or adjunct Level 1 Simple sentence with more than one prepositional phrase or adjunct Level 2 Conjoined sentence (two simple sentences—Level 0 or 1)
Level 3 Conjoined sentence (more than two simple sentences—Level 0 or 1) Level 4 Sentence withone level of embedding
(relative clause that is modifying object of main verb) Level 5 Non-finite clause in adjunct positions
Level 6 Sentence withmore than one level of embedding
Levels 0 and 1 correspond to the class of simple sentences in the D-level classification and have a lower complexity than Levels 2 and 3, which correspond to the class of coordinated structures with a higher complexity than simple sentences in the D-level classification.
Eachbasic proposition in our system can be realized as a simple sentence containing at most one prepositional phrase or adjunct.18 Eachsingle node tree witha Relative or Attributive Knowledge Base predicate at its root has the lowest syntactic complexity (Level 0) in this classification.
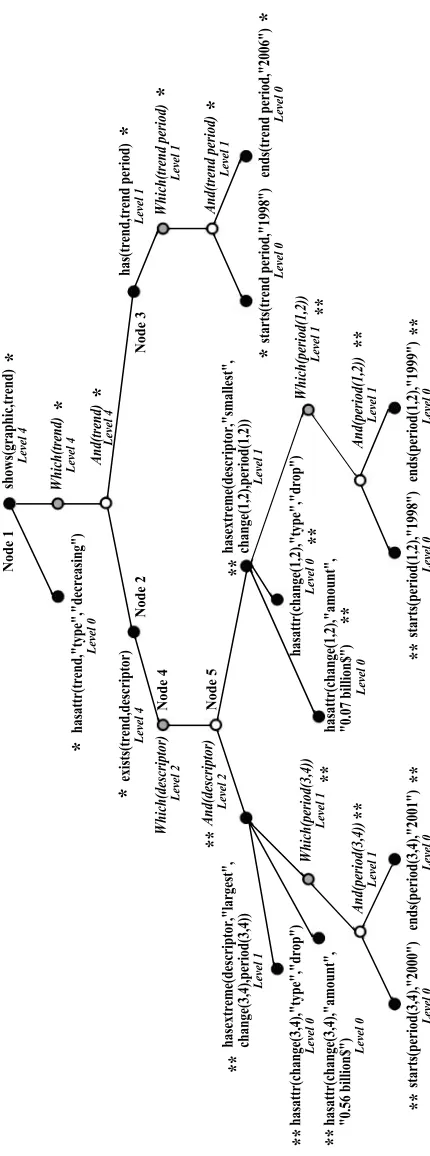
The most straightforward way of realizing a more complex tree would be conjoining the realizations of subtrees rooted by a proposition with an And or a Same predicate, embedding the realization of a subtree rooted by a proposition with a Which predicate as a relative clause, and realizing a subtree that consists solely of a proposition with an Attributive Knowledge Base predicate as an adjective or a prepositional phrase. For example, the tree rooted by shows(graphic,trend) in Figure 5 can be realized as The graphic shows a decreasing trend, which is in the dollar value of net profit and is over the period, which starts at the year 1998 and ends at the year 2006. The resultant text is fairly complicated, however, and a more sophisticated realization would likely lead to a lower syntactic complexity score. We defined a number of And predicate and Which predicate complexity estimators to look for realization opportunities in a complex tree structure so that a syntactic complexity score which is lower than what the most straightforward realization would produce can be assigned to that tree. These estimators compute the syntactic complexity of a complex tree by examining the associated realizations of all aggregated propositions in that tree in a bottom–up fashion. Because the complex trees that are rooted by a proposition with a Same predicate would always be realized as a conjoined sentence (Level 2), we did not define complexity estimators for this kind of predicate.
TheAnd predicate complexity estimators check whether or not the realizations of two subtrees rooted by a proposition withan And predicate can be combined into a simple sentence (Level 1), or a conjoined sentence which consists of two independent sentences (Level 2) if one of the subtrees is rooted by a proposition with an And predicate. For example, the And predicate estimators can successfully identify the