Abstract—This paper presents the recently developed extraction circuit to produce high quality products with low chromatite levels whilst maintaining sustainable PGMs recovery. This was accomplished by installing a chrome extraction plant in the middle of the flotation circuit in order to benefit the increase in PGMs recovery from secondary circuit by lower tonnage to the mill, hence more residence time and better grinding results. The results obtained indicate that the installation of chrome plant in the middle of flotation circuit reduced the amount of chrome in the final PGM’s product and PGMs entrained in the tails can be recovered. Low chromites levels of less than 2.2% whilst maintaining PGMs recovery at 80% were obtained. The results also show that the chemical grades of 43.52% Cr2O3 were obtained which fall within the customers’ specifications.
Keywords—chromatite, PGM, flotation, recovery, tonnage, feed, mass pull, grades, product, tails, time.
I. INTRODUCTION
he Bushveld complex in South Africa is the largest known platinum group metals (PGM) deposit in the world. The Bushveld igneous complex is a rock containing a rich supply of metals, most importantly more than 80% of the world known reserves of platinum group metals [1]. These metals are Platinum, palladium, rhodium, ruthenium, iridium and gold. The PGMs in the Bushveld complex are found in a number of different layers, of which Merensky and the upper group 2 (UG-2) chromites seam are of most economic importance [2 – 3]. The mineralogy of the UG-2 is mostly sulphides, various tellurides and PGMs are identified in the ore to be associated with the metal sulphides and the matrix occurrence is either within or at the metal-gangue grain boundaries [4]. During the grinding process, about 50% of the PGMs are liberated. UG2 platinum grades range between 3 and 8 g/t [5].
PGMs have extraordinary physical and chemical properties that have made them indispensable to the modern industrial world. The PGMs have very high melting points, and are chemically inert to a wide variety of substances
Manuscript received 27 March, 2012; revised 10 April, 2012. This work was supported in part by the University of South Africa and the National Research Foundation, (NRF) South Africa.
Ayo S. Afolabi is with University of South Africa, Department of Chemical Engineering, Private Bag X6 Florida, Johannesburg South Africa. (Corresponding author: Tel: 0027114713617, Fax: 0027114713054, e-mail: [email protected]).
Molebogeng P. Nkobane is with University of South Africa, Department of Chemical Engineering, Florida, Johannesburg, South Africa
Ambali S. Abdulkareem is with University of South Africa, Department of Chemical Engineering, Florida, Johannesburg, South Africa.
.
(even at very high temperatures), and thus resist corrosion [6]. They also have excellent catalytic properties, and are widely used in the chemical industry and in automobile catalytic converters Commercial substitution by cheaper metals has rarely been successful, although an individual platinum group metal may readily be replaced by another.
Crocodile river mine (Eastplats) is currently treating UG-2 ore as the run of mine to recover PGMs and all ore is beneficiated using conventional crushing, milling, and flotation processes. There is a chrome plant that is installed in the middle of the flotation circuit in order to benefit the increased in PGMs recovery from secondary circuit by lower tonnage to the mill, hence more residence time and better grindings. This mine recovers PGMs loss of below 1% recoverable from the chromites.
Barplats mine is a PGMs mine located on the Bushveld complex in South Africa, the main ore body is the UG-2 chromitite layer. The mine is situated on the western limb of the Bushveld complex which is about 70 km north-west of Johannesburg in the North West Province. Geologically UG-2 reef, a platinaferous chromatite lies below Merensky reef and consists primarily of 30 to 90% chromites and 5 to 25% gangue silicates [7]. A trace of base metals sulphide occurs mainly interstitially to the chromatite grain in the UG-2 ore about 70 to 80% of the PGMs in UG-2 ores are typically associated with base metals sulphides (BMS) as occlusions and intergrowth [8].
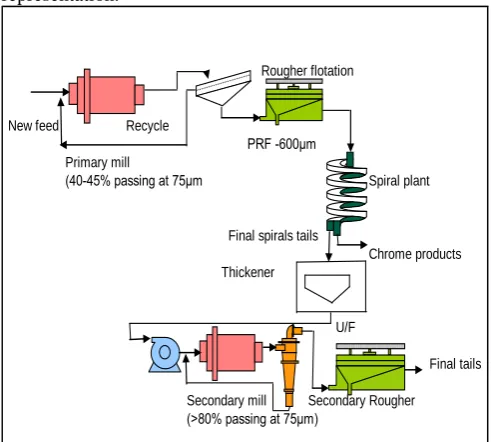
The beneficiation processes are designed to increase the concentration of the PGMs by reducing the bulk of the products from the ore. The mined ore undergoes an MF2 process route which is a mill float mill float plant operation from this, the gravity concentrate is extracted. The sulphides are concentrated by flotation. The flotation concentrates undergo smelting and convertion, to produce a PGM-containing nickel-copper matte. The matte is treated by using hydrometallurgy to separate the base metals from the precious metals [9]. Finally, the PGMs concentrate is refined to separate the individual precious metals into their pure forms. Fig. 1 shows the typical schematic representation of the MF1 plant.
This did not take into account a significant proportion of the PGMs which were locked in the silicate phases and required fine grinding for liberation. The concept of removing the chromite fraction from the first rougher stage tails concept is good because the primary rougher tails is only partially ground, the bulk of the chrome results in the coarse fraction and hence it is easily recoverable (optimum recovery of chrome). PGMs are associated with the base metals sulphides and silicates (not chrome). The near-perfect separation of chrome from the PGMs can be achieved because of the chrome removal step within the flotation circuit, the bulk of the fine chromatite particles in
Development of PGMs and Chrome Extraction
Circuit from UG–2 Ore
Ayo S. Afolabi,
Member, IAENG
, Molebogeng P Nkobane and Ambali S. Abdulkareem
the cleaner tails can be extracted thus allowing recirculation of the cleaner tails and hence improved PGMs recoveries.
Rougher Flotation
Secondary Flotation
(Primary)
PRF -600μm
SRT
[image:2.595.46.290.72.243.2]Primary mill
Secondary mill
(45%-75μm)
(>80%-75μm)
Fig. 1. Schematic representation of old flotation plant
[image:2.595.46.292.313.534.2]Increase PGMs recovery from secondary circuit by gaining 2% extra on it. (Total circuit recovery increase to 80%). Figure 2 shows the schematics of the new MF 2 circuit plant representation.
Rougher flotation
New feed Recycle
PRF -600μm Primary mill
(40-45% passing at 75μm Spiral plant
Final spirals tails
Chrome products Thickener
U/F
Final tails
Secondary mill Secondary Rougher (>80% passing at 75μm)
Fig. 2. Schematic representation of new flotation plant
II. EXPERIMENTAL
A. Sampling and sample preparation
Extensive technical investigations were conducted and certain slurry streams were sampled. It was very important that the sampling was done in such a way that the samples obtained were representative of the whole stream and correctly labeled. The samples were taken at half an hour for four hour time intervals to form composite samples of 4 hours and were submitted to laboratory for assay/chemical analysis. These samples were taken across the feed stream, tailings streams, final product of chrome plant and final concentrator at concentrator thickener underflow to give a general indication of plant performance. The following samples were taken: primary rougher feed (PRF), primary rougher tail (PRT), secondary rougher feed (SRF), secondary rougher tail (SRT), spiral feed (SF), chrome plant final tail (CPT), chemical grade (CG), metallurgical grade (MG) and final concentrator (FC).
The samples were filtered, dried (wet and dry masses recorded), pulverized, blended to obtain a homogenous phase and sub-sampled for analysis. All samples were submitted for chemical/ assay analysis, were prepared in accordance with crocodile river mine standard operating procedure for crushing, sub-sampling and pulverizing. All samples were analyzed for 3e’s and 6e’s by ICP-OES. Chrome and base metals were analyzed by using X-ray fluorescence(XRF) and Az-tech was used to analyze platinum concentrates only.
B. Particles size analysis test work
The objective of this test work was to evaluate the particle size distribution (PSD) being processed in chrome plant feed and spiral concentrators. Material in the size range 2 mm to 100 µm can be readily processed in spirals. In most gravity separators, the more closely size the material being processed, the more efficient the separation [10]. Sieves used for the test were arranged in a stack, with the coarsest sieve on the top and the finest at the bottom. The sieves were arranged as follows: 300, 212, 150, 106, 75, 53, 38 and 25 µm.
The representative sub-sample from the feed stream was taken, filtered, weighed and wet mass recorded, dried in oven to a temperature less than 105ºC, and the dry mass was weighed and recorded. Sample was split on the rotary splitter to obtain a homogenous phase of particles and sent for screen analysis. The sample was screened for 10 minutes. The mass of each screen was weighed and recorded.
C. Sedimentation test
The test work was to determine the settling rates of suspension particles from a liquor stream by gravity settling. Five settling rates tests were performed in this test work. About 0.5 g of flocculant powder was weighed into a dry 120 ml bottle and 5 ml of methanol were added to wet the powder. About 95 ml of tap water was added to the contents of the bottle. The cap was replaced and the bottle was shaken for 5 minutes. Shaking was continued intermittently for two hours until a complete solution was obtained. The resultant 0.5% solution was diluted to 0.055 on site before use. This Perspex wedge gives an arbitrary indication of clarity with 0 being opaque and 48 being clear. Where multiple samples achieved a 48 score but some are visibly clearer than others a (+) sign was added to the number denoting how much clearer they are compared to other samples which also achieved a 48. A 1000 ml measuring cylinder was used, stopwatch to time the settling rates, mixture of solids and water, A drop of flocculants was added, the cylinder was inverted three times and the solids was allowed to settle, to form clear interface with the water. The time at which interface moved past each level on the cylinder was recorded.
D. Cyclone performance (cluster cyclone)
an oven and mixed by using rotary splitter. About 1000 g of the sample was taken and placed on the stack, screened for a period of ten minutes by using root 2 screen size analysis, the top size being 300 µm down to -25 µm, and the weights of individual screens were recorded.
E. Separation efficiency of an elutriator
The samples were taken to determine the separation efficiency of the elutriator. The samples were taken from the elutriator feed both underflow and overflow. The samples were filtered, dried in oven, and mixed using rotary splitter. About 1000 g of the sample was placed on the stack, screened for a period of ten minutes by using root 2 screen size analysis, the top size being 300 µm down to -25 µm, and the weights of the individual screens were recorded.
III. RESULTS AND DISCUSSION
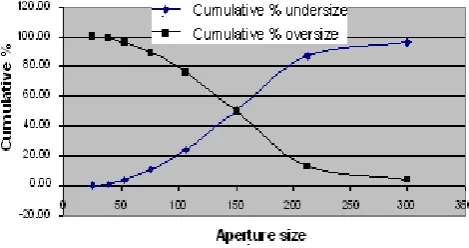
[image:3.595.308.543.110.234.2]Fig. 3 shows that at 85.4% oversize and 4.6% undersize material was achieved at 75 µm. This indicates that the material which reported to the spiral stage was very coarse which is good to meet the objective of recovery by the coarser feed to spirals whilst preventing the PGM losses from 1% to less than 0.9% PGM recoverable. The size range of 2 mm to 100µm can be processed in the spirals to achieve efficient separation.
Fig. 3. Particles size cyclone underflow
[image:3.595.55.294.349.500.2]Fig. 4 shows that at 95.26% oversize and 4.74% undersize material was achieved at 75 µm. This indicates that the material which reported to the underflow was the correct size that can be processed in the spirals section, since the size range of 2 mm to 100 µm can be processed in the spirals to achieve efficient separation.
Fig. 4. Particles size cyclone underflow
Fig. 5 the results in this figure indicates that 1.06% of ore was undersize and 98.84% was oversize at 38 μm. This
shows that most of the material reported to the overflow was the slimes and it also indicates that most of the primary rougher flotation tails was very coarse which is good for spiral concentrators (gravity separation) which is the next stage of concentration.
Fig. 5. Particles size cyclone overflow
Fig. 6 shows that at 53 µm screen size, 99.60% oversize material and 0.40% undersize material were obtained. This shows that the feed contained most of the oversize material which report to the underflow since it has a greater terminal velocity than the velocity of the fluid that is used to separate the particles according to their terminal velocities compared to the velocity of the fluid. This can also indicate that the spirals were performing well since there were less light particles on this screen size on the chemical grade products.
Fig. 6. Particles size elutriator feed
Fig. 7 indicates that 90.74% was retained at 53 µm as oversize material and 6.51% of the material reported to the undersize. 99.60% of the elutriator feed material was oversize and this also indicates that there were few fines reporting to overflow stream. The result also shows that the particle sizes have high probability of reporting to the underflow as its terminal velocity is most likely to be higher than the velocity of the fluid.
[image:3.595.304.549.376.494.2] [image:3.595.58.543.619.741.2]From Fig. 9, it could be seen that at a grind of 44.28 percent the recovery was the highest at 80.77%. Mill grind has a direct influence on PGMs recovery. It is a measure of the degree of liberation of valuable minerals in preparation for selective recovery at the flotation circuit. This is partly because some of the PGMs are enclosed in either base metal sulphide, silicate gangue, in oxides or lay on the grain boundaries of any host material. For flotation, high PGMs losses usually occur at both the coarse and fine ends. Therefore, a general useful objective is to make the product size distribution as narrow as possible. The particles that are not adequately liberated may be lost to tails.
Fig. 9. Primary mill grind versus PGM recovery
[image:4.595.308.548.370.505.2]Fig. 10 shows that the desired grade for the overall plant performance is greater than 170 g/t and the obtained graphical results show that the desired specification has always been met and exceeded at 170 g/t. Due to the stringent or strict specifications imposed by the smelter the requirement above must be adhered to at all times.
Fig. 10. Final Concentrate quality and PGM recovery
Fig. 11 shows that the desired chrome specification in the final concentrate is required to be less than 2.2% for the overall plant performance, and the obtained graphical results show that there exists a fluctuation around the 2.2% borderline but mostly it is kept under 2.2% chrome. If the chromite contents are in excess there will be a buildup of
[image:4.595.48.290.498.687.2]chrome spinels layers in the furnace which impact on the furnace operation hence increasing costs [3].
Fig. 11. Quality chrome in concentrate
Fig. 12 shows that the desired recovery for the overall plant performance is 80%. The obtained graphical results show that in four occasions the desired specification has always been met and exceeded and in three months. There has been under performance in terms of meeting the required recovery value. The PGM recovery can vary from 70 to 90%.
Fig. 12. Final concentrate quality main plant recovery
TABLEI
AVERAGE PGMs AND CHROME FOR ROUGHER FEED AND TAIL FROM CHEMICAL ANALYSIS
Table I shows that chrome levels of 22.3 g/t in the primary feed was reduced to 18.0 g/t in the secondary rougher feed. This is good for the smelter stage because less chrome spinels will form to affect the furnace operation.
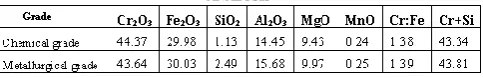
TABLEII
[image:4.595.301.551.570.635.2] [image:4.595.307.549.725.764.2]The results presented on Table II show that the chemical grades of 43.52% Cr2O3 were obtained which falls within the customers’ specifications as outlined in the objectives.
IV. CONCLUSION
Size analysis is very important in assessing the performance of grinding circuit and from the analyses of the results obtained in this study; it is shown that the desired particles sizes for each unit process were obtained for the spirals, hydrocyclones, elutriator and both the primary and secondary roughers. The results from the particle size analysis of the elutriator suggested that installation of an elutriator did assist in obtaining the desired size in the final products by eliminating the fines in the product stream. The installation of the chrome plant in the middle of the flotation circuit yielded high quality products with low chromites levels of less than 2.2% while maintaining PGMs recovery at 80%. The results also showed that the chemical grades of 43.52% Cr2O3 were obtained which meet the customers’ specifications.
ACKNOWLEDGMENT
The authors gratefully acknowledge the financial supports of the National Research Foundation (NRF) and University of South Africa.
REFERENCES
[1] P. Crowson, Statistics and analyses of the world's minerals industry, Mining Journal Books Ltd, Edenbridge, Kent, UK, 2001.
[2] C.H. McClaren, and J.P. De Villiers, The platinum-group chemistry and mineralogy of the UG-2 chromitite layer of the Bushveld complex. Economic Geology 1982, Vol. 77, pp. 1348–1366. [3] R. E. Philips, R.T. Jone and P. Chennells, Commercialization of the
conroast process, Third International Platinum Conference ‘Platinum inTransformation’, SAIMM 2008, pp. 141–148.
[4] C. J. Penberthy, E. J. Oosthyzen, and R.K. Merkle, The recovery of platinum group elements from the UG-2 chromitite,Bushveld complex-a mineralogical perspective. Mineralogy and Petrology, 2000, Vol. 68, pp 213-222.
[5] L. J. Corrans, The recovery of platinum-group metals from ore of the UGZ reef in the Bushveld complex. South African Institute of Mining and Metallurgy 1982, p. 629.
[6] R. Neelameggham, C. Belt, M. Jolly, R. Reddy and J. Yurko, Carbon dioxide and other greenhouse gas reduction metallurgy and waste heat recovery. Energy Technology 2011.
[7] A. M. Edwards and M. H. Silk, Platinum in South Africa. Special Publication 1987, No. 12, Mintek, Randburg.
[8] S. Winkels-Herding, R. Merkle and G. Von Gruenewaldt, Pegmatoidal pockets in the UG2 chromitate, werstan Bushveld complex, ICAM’91, International Congress on Applied Mineralogy, Papers of Mineralogical Association of South Africa,1991, Vol 2, paper 65.p 14.
[9] C.F. Vermaak The platinum-group metals: A global perspective, Mintek, Randburg, South Africa, 1995, p 247.