An Analytical Review of Implementation of Lean
Six Sigma Methodology in Manufacturing Industry
Yashwant Shetty1, Gaurav Sonowane2, Snehal Shende3, Anvay Pathak4 1, 2, 3
Department of Mechanical Engineering, Sinhgad College of Engineering, Pune, Maharashtra 411044, India 4
Department of Mechanical Engineering, D Y Patil College of Engineering, Akurdi, Pune, Maharashtra 411044, India
Abstract: Lean and Six Sigma are considered to be the best methods to increase the productivity of the organisation. The integration of Lean and Six Sigma which is called as Lean Six Sigma not only eliminates the disadvantages of both but also develops synergy. Various techniques and methodologies are used for successful implementation of Lean and Six Sigma like Poka Yoke, Kaizen, 5S, Kanban, DMAIC, DMADV. In the present work, brief description of these processes and successful implementation to improve the productivity and reduce the defects in the manufacturing of square housing pump is discussed. The evaluation of various parameters of the process revealed clear idea about defects in the process. The modification in the process by applying Lean Six Sigma tools and techniques has reduced the defects. The net outcome of work would include improvement in the process, Sigma level, Customer satisfaction, worker satisfaction and reduction in cycle time.
Keywords: Lean, Six Sigma, DMAIC, 5S, Square housing pump.
I. INTRODUCTION
The Six Sigma is a data driven approach used to reduce defects whereas Lean is a data driven approach used to eliminate waste. The integration of Lean and Six Sigma not only eliminates the respective disadvantages but also has synergetic effect. Considering the above fact, Lean Six Sigma methodology is used in the manufacturing industry to increase productivity and improve quality to create world class organization.
II. LITERATURE REVIEW
A. R.S Agrahari et al. [1]
They have discussed a successful implementation of 5S methodology in the small scale industry in their paper. The study comprises of brief introduction of 5S methodology, a tool from lean manufacturing and its case study in small scale industry. The steps of 5S process viz. Seiri, Seiton, Seiso, Seiketsu and Shitsuke were used. Red tags method was used to eliminate unwanted waste. Colours have been used to mark different areas and a daily checklist of all the activities was carried out. After the successful implementation of all 5S process growth, increased efficiency, improvised working conditions, decreased maintenance cost, reduction in injury of workers, better usage of workplace and prevention of losing tools was achieved. PDCA (Plan, Do, Check, Act) cycle is used for continuous improvement of the project.
B. Md Enamul Kabir et al. [2]
They have studied and evaluated the processes of the case organisation to find out current sigma level and finally to improve existing sigma level through productivity management.
This has been done by using Six Sigma DMAIC cycle. By using Six Sigma DMAIC methodology it has been possible to improve productivity by reducing defect rate.
III. PROBLEM STATEMENT
A. To keep workplace clean and make specific arrangements for tools, materials for reducing cycle time
B. To control dimensions of ID and OD of square housing pump within range of 25 µm
C. To avoid dent on surface during operations
D. To achieve parallelism on every surface of square housing pump
E. To reduce tapping error during manual tapping
F. To reduce run out error within the limit of ±15µm
The objective of the project is to apply Lean Six Sigma methodology using 5S and DMAIC approach to control the dimensions of ID and OD, avoid dent, achieve parallelism, reduce tapping errors and run out errors in square housing pump to improve quality and efficiency of the system.
IV. METHODOLOGY
A. Implementation of 5S
The 5S method is a tool for continuous improvement in Lean Manufacturing, whose aim is to create a highly efficient, clean and ergonomic working environment. It is one of the efficiently working tools of lean manufacturing. The 5S is collection of 5 simple rules and at the same time it is a tool that allows you to control the workplace visually. The 5S tool originates from Japanese philosophy, namely from the five basic elements of the system viz. Seiri, Seiton, Seiso, Seiketsu and Shitsuke. The 5S approach has been implemented in the organisation.
1) Seiri (Sort): In the first phase of implementation of the 5S, total process time was calculated. Various wastes in time were found out. Time required to set the jigs and fixture assembly was the major waste. Since the tools jigs and fixtures required for machining operations on Horizontal Machining Centre (HMC) and Vertical Machining Centre (VMC) were not properly placed, the worker has to find each component from different places at the workplace, collect them at one place and then operation was used to perform. Also the offline and online operations on the machining centres were found out.
2) Seiton (Set in order): Seiton is a means by which all equipment are kept in order and labelled. To reduce the cycle time of assembling jigs and fixture to the machining centres, the proper place for the tools, jigs and fixture was made. Because of this, time required to find each component was reduced and everything was available at a glance. Also the offline operations that were required to be done were carried out simultaneously. This resulted into decrease in working hours a respective machining centre.
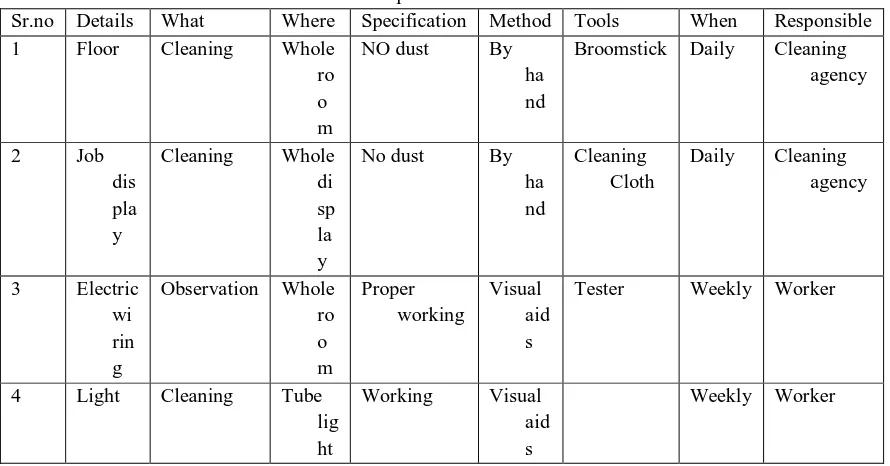
[image:2.612.85.530.503.736.2]3) Seiso (Shine): Seiso is a phase where every element of the workplace is cleaned. A special maintenance sheet was prepared which include the components to be cleaned and processes of cleaning to be applied.
TABLE I- Implementation Sheet of 3S
Sr.no Details What Where Specification Method Tools When Responsible
1 Floor Cleaning Whole
ro o m
NO dust By
ha nd
Broomstick Daily Cleaning
agency
2 Job
dis pla y
Cleaning Whole
di sp la y
No dust By
ha nd
Cleaning Cloth
Daily Cleaning
agency
3 Electric
wi rin g
Observation Whole ro o m Proper working Visual aid s
Tester Weekly Worker
4 Light Cleaning Tube
lig ht
Working Visual
aid s
4) Seiketsu (Standardise): Seiketsu is implementation and maintenance of the previous three stages of the 5S. The introduction of a set of rules resulting from the three steps of selection, systematics, and cleaning will help employees to understand their tasks and the aims to be achieved by the introduction of the 5S method. At this stage it is possible to implement instructions at the workstation. All the members of the organisation are made aware of the philosophy established in the organisation. Monthly meetings are organised in order keep track of the record and changes made in the workplace. Every zone leader is asked to present a report in each meeting and based on the performance special ranking system is allocated. Leaders are given points based on their performance
5) Shitsuke (Sustain): The last phase of 5S implementation is sustain. Sustain is to make a habit of properly maintaining correct procedure and discipline necessary to avoid backsliding. It gives scope for worker participation in the work area, design and maintenance. It gives chance to them to gain appreciation from the management in terms of rewards and incentive
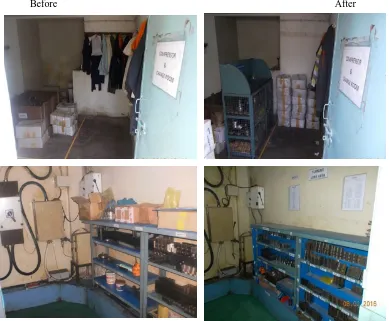
[image:3.612.113.502.223.544.2]Before After
Fig. 1-Implementation of 5S
B. DMAIC Implementation
DMAIC is the data driven quality strategy for improving process in Six Sigma. This methodology is used to improve an existing business process. DMAIC stands for Define, Measure, Analyse, Improve and Control. It is a stepwise approach to eliminate defects. Various tools like Pareto analysis, Project Charter, SIRPORC, fishbone diagram, why-why analysis etc. are used in various phases of DMAIC implementation.
TABLE II- SIRPORC
Supplier Input Process Output Requirement Customer
Vendor Bill of material Raw material from vendor Raw
material
Good strength and casting
Production department
Production department Raw material Design of component Design Clear and
understandable to Station
Station
Production department Raw material and design
Machine process 10(facing, grooving)
Component Proper machining Station 1
Station 1 Component after 1st
machining
Machine process 20(turning, grooving)
Component Proper machining with inspection
Station 2
Station 2 Component after 2nd
machining
Machining process30,40(drill) Component Proper inspection of holes
Station 3
Station 3 Component after 3rd
machining
Machining process 50 Component parallelism checking Station 4
Station 4 Component Finishing and deburring Final
component
No sharp edges and burr
Inspection department
Inspection department component Inspection Defect free
components
Meeting specification Customer
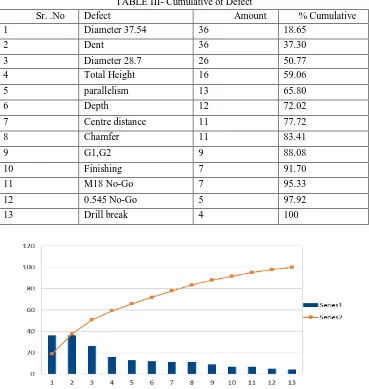
2) Measure: The measure phase involves data collection and evaluation process to find out the critical factors that have high potential impact on the performance of square housing pump. In order to identify the severity of each factor, Pareto chart was used as shown in graph.
TABLE III- Cumulative of Defect
Sr. .No Defect Amount % Cumulative
1 Diameter 37.54 36 18.65
2 Dent 36 37.30
3 Diameter 28.7 26 50.77
4 Total Height 16 59.06
5 parallelism 13 65.80
6 Depth 12 72.02
7 Centre distance 11 77.72
8 Chamfer 11 83.41
9 G1,G2 9 88.08
10 Finishing 7 91.70
11 M18 No-Go 7 95.33
12 0.545 No-Go 5 97.92
[image:4.612.123.492.337.726.2]The Pareto chart reveals various parameters that influence the performance of square housing pump. It is observed from the graph that the defects dia. 37.54, Dent, dia. 28.5, M18 No-Go are having high potential impact on the performance of square housing pump. The DPMO and Six Sigma level of each above critical parameters were calculated to identify the current performance level of the square housing pump.
TABLE IV- DPMO and Sigma Level Calculation
3) Analyse: The purpose of analysis phase is to determine the root cause of the defects which makes an impact on the performance of square housing pump and interpret the data to establish cause and effect relationship and analyse the process map. Non- value added process steps were identified with the help of SIRPORC. In this regard, various sub critical factors were illustrated by Why analysis. Consequently, the brainstorming session were conducted to identify the major critical factor that makes an impact on performance of square housing pump. It was observed from the information gathered through brainstorming that insert used for producing diameter 37.54 has less life and can be improved. From Why-Why analysis of the parameter 3/8 no-go defect, it was observed that during reprocessing more number of manual tapping was given then required and it can be improved. Hence improvement in the above process can enhance the quality of square housing pump.
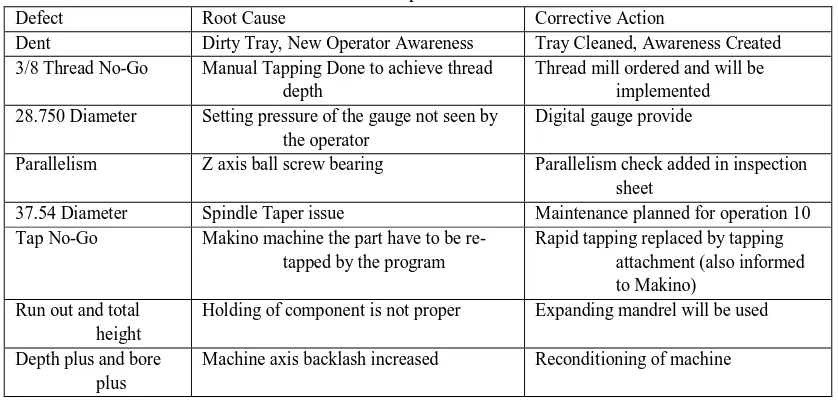
4) Improvement: An Improve phase focuses on embarking the current system configuration, which improves the Six Sigma level. In this regard, the brainstorming session was made up with the charter team that discussed the current status of the system. After fierce investigation, it was revealed that changing the insert having better life of bench-marking for 3/8 No-go during manual tapping is one of the solution to improve the performance level of square housing pump.
TABLE V- Improvement Table
Defect Root Cause Corrective Action
Dent Dirty Tray, New Operator Awareness Tray Cleaned, Awareness Created
3/8 Thread No-Go Manual Tapping Done to achieve thread depth
Thread mill ordered and will be implemented 28.750 Diameter Setting pressure of the gauge not seen by
the operator
Digital gauge provide
Parallelism Z axis ball screw bearing Parallelism check added in inspection sheet
37.54 Diameter Spindle Taper issue Maintenance planned for operation 10
Tap No-Go Makino machine the part have to be re-tapped by the program
Rapid tapping replaced by tapping attachment (also informed to Makino)
Run out and total height
Holding of component is not proper Expanding mandrel will be used
Depth plus and bore plus
Machine axis backlash increased Reconditioning of machine
5) Control: In the control phase the optimum solutions as mentioned above were implemented by the organisation to achieve continuous improvement in the performance of square housing pump. Further improvement in overall performance of square housing pump can also be done by analysing and improving the efficiency of various other critical parameters.
Defects DPMO Sigma level
Diameter 37.540 14348 3.693
Dent 14348 3.693
Diameter 28.75 10362 3.817
Parallelism 5181 4.077
1.40 depth 4782 4.107
[image:5.612.97.516.455.655.2]III. CONCLUSION
The improvement in the workplace, worker satisfaction, clean and ergonomic environment was achieved by using the different phases of 5S viz serie, seiton, seiso, seiketsu, shitsuke. Workplace maintenance sheet was created in 3S phase of implementation. Also before and after images were captured at regular intervals. The reduction in defects like variation in the dimensions of dia 37.54, 3/8 No-go, Dent of square housing pump was achieved by successfully using different phases of DMAIC methodologies viz. define, measure, analyse, improve, control. Various quality tools like SIRPORC, project charter, Pareto analysis, fish bone diagram, why-why analysis were used in the various phases of DMAIC implementation.
TABLE VI- Increased Sigma level and % reduction
Defects Sigma level % reduction
Before After
Diameter 37.54 3.6 3.7 27
Dent 3.6 4.08 72
Diameter 28.75 3.8 3.9 38
3/8 No-go 4.016 4.4 62
Depth 4.11 4.4 50
Total Height 3.9 4 10
Parallelity 4.08 4.15 53
REFERENCES
[1] R.S. Agrahari, P.A. Dangle, K.V. Chandratre, “Implementation of 5S Methodology in the Small Scale Industry: A Case Study, “International Journal of Scientific and Technology Research, Vol-4, Issue 4, April 2015.
[2] Md. Enamul Kabir, S.M. Mahbubul Islam Boby, Mostafa Lufti, “Productivity Improvement by using Six Sigma”, International Journal of Engineering and Technology, Volume 3, No. 12, December, 2013.
[3] R Sundar, “A Review on Lean Manufacturing Implementation Techniques”, 12th Global Congress on Manufacturing and Management, GCMM, 2014.
[4] J. Michalska, “Quality Costs in the Production Process”, Journal of Achievement in Materials and Manufacturing Engineering, Volume 17, pp. 425-428, 2006. [5] S.Suresh, A.L. Moe and A.B. Abu, “Defects Reduction in Manufacturing of Automobile Piston Ring Using Six Sigma”, Journal of Industrial and Intelligent


