950
©IJRASET: All Rights are Reserved
Analysis of Honeycomb Structure
Ms. Poonam Joshilkar1, Prof. R. D. Deshpande2, Prof. R. B. Kulkarni3
1
PG Student, 2, 3Assistant Professor, Dept. of Civil Engineering Gogte Institute of Technology , Belagavi., Visvesvaraya Technological University Belagavi
Abstract: The Honey Comb Sandwich construction is one of the most valued structural engineering innovations developed in the
composite industry. It finds its applications in industries like aerospace, aero plane, transportation, rails etc. The behaviour of honeycombs subjected to three point bending is investigated using Hypermesh and LS-DYNA. The finite element (FE) results like deflection and critical load are verified by theoretical calculation. The honey comb sandwich CAD model is prepared in CATIA software. The core material used in the analysis is copper, steel, aluminium and titanium and the steel material is used for faceplates. The analysis is carried out by varying the thickness of faceplates and core wall of honey comb. The FEA results were obtained and graphs were plotted.
Keyword: Honey comb sandwich, core material, thickness, Hypermesh, LS-DYNA
I. INTRODUCTION
Honeycomb structure is natural or man-made structure. The geometry of a honeycomb minimizes the amount of material used to minimal weight and minimal cost. The geometry of honeycomb structure can vary. The cells are often columnar and hexagonal in shape. In mechanical structures stiffness, strength and weight efficiency are important factors, in such cases the sandwich construction is commonly used. These sandwich panels are used in satellites, Trains, space craft, Aircraft, boats, trucks etc. Core material is selected on the basis of performance low density. For core material hexagonal honeycombs are preferred. The sandwich panel is a composition of face plates bonded on upper and lower sides which are strong and stiff with weak core material. Metal or non-metal materials can be used as the upper and lower surface face sheet material of honeycomb sandwich panels.
The basic principle of the sandwich panel is that the core carries the shear stresses and the faceplate carries the bending stresses. Honeycomb sandwich structures exhibit high stiffness and strength to weight ratios. In the aerospace and transportation industry different types of sandwich core structures are used. Such as foam/solid core type are used in ships and aircrafts, honeycomb types of core are used in aircrafts and satellites, truss core type are used in buildings and bridges and web types of core is manufactured by using a variety of base materials.
A complex shaped core material may be replaced by a simple equivalent volume having elastic orthotropic properties, due to the limitations as Complex and large hexagonal honeycomb core shapes are difficult to model and also difficult to manufacture which are computationally expensive.
Material used for the honeycomb core should be such that it will offer advantages such as good mechanical properties, low dielectric properties, low thermal conductivity coefficients, fluid control, good acoustic properties, excellent crushing properties, small cross-sectional areas and large exposed area within the cells.
II. LITERATUREREVIEW
951
©IJRASET: All Rights are Reserved
aerospace lifting surface as the lifting surface bending stresses will be maximum at top and bottom surface, low at the middle surface. The different materials are used as honeycomb sandwich panel. The three point bending test was carried out to understand the bending behavior of honeycomb sandwich panel. The critical load and the deflection of the honeycomb sandwich panel were calculated theoretically. From three point bending test it was observed that titanium alloy has more strength to weight ratio. The crushing test was also carried out by varying the cell thickness and height of the honeycomb core. From crushing test it was observed that wall thickness of the honeycomb core cell is a critical variable affecting the crushing strength of sandwich panel under lateral crushing loads and the height of honeycomb core is not an influential parameter on crushing behavior[3]. Komal A. Jangavali, et al. carried three point bending and impact test is performed on the honeycomb panel. Aluminium material is used as core with FRP face sheet in honeycomb panel. Also ANSYS is used for Finite element analysis of honeycomb panel. The critical load was found theoretically and compared with experimental results and FEA results. From the impact test the deformation was found and compared with FEA results. For the critical load, it was found 5-6% variation in the experimental and FEA results. The deformation found from experimental result was slightly greater than the deformation found in FEA results[4]. Mohiyuddin. C.S, et al. in this paper Experimental and analytical studies on honeycomb sandwich panels were carried out. The behavior of honeycomb sandwich panels under impact loads is investigated. For the analytical study, the modeling was done in HYPER MESH and analysis was done with the help of LS-DYNA. It is observed that with increase in height of fall, the Impact Residual Strength (IRS) will increases and as the thickness of specimen increases energy absorption will be more. As the height of fall increased; the depth of indentation increases[5].
III.OBJECTIVEANDMETHODOLOGY
Preparing the model of the honeycomb sandwich panel to understand the behaviour of the simply supported honeycomb sandwich panel structure under concentrated load. Comparing the deflections, critical loads and stresses of honeycomb sandwich structure to study the effect of different materials and varying the thickness of faceplates and wall of the honeycomb core cells.
1) Literature review related to the project work.
2) Collection of material properties and constraints.
3) Using CATIA V5 tool 3-D model has been prepared.
4) Finite element model has been created by using Hypermesh tool.
5) Finite element analysis has been carried out by using LS-Dyna tool.
6) Finite element analysis results have been viewed by using LS-prepost tool.
Fig1 3D CAD model of honeycomb structure
Figure 1 shows the CAD model of honeycomb structure prepared in the Catia V5 software. The base plate and honeycomb core are showed in the model. The IGS format of the model is imported to hyperworks for meshing.
A. Meshining
952
©IJRASET: All Rights are Reserved
assigned to the structure. The analysis is carried out and results are obtained in LS-prepost.
Fig2 Meshed FE model of honeycomb structure Fig 3 FEM of honeycomb with loading and boundary condition
To study the behaviour of honeycomb structural we have modelled four main models of size 133mmx96mm by changing the core material of honeycomb and keeping the faceplates material same for all four models. The variation in deflection, critical load and stress are compared by changing the wall thickness of core cell as well as thickness of faceplates. Table 2 shows the different types of models with details of the material used. Table 7 shows the material properties for different material used in honeycomb sandwich structure. Table 3 shows the details of model 1 in terms of change in thickness of core wall and faceplates of the honeycomb structure. Table 4 shows the details of model 2 in terms of change in thickness of core wall and faceplates of the honeycomb structure. Table 5 shows the details of model 3 in terms of change in thickness of core wall and faceplates of the honeycomb structure. Table 6 shows the details of model 4 in terms of change in thickness of core wall and faceplates of the honeycomb structure.
Table 1 Model details in terms of materials of core wall and faceplates of honeycomb structure
Model 1 Model 2 Model 3
Top faceplate material Steel Steel Steel
Core material Copper Steel Aluminium
Base faceplate material Steel Steel Steel
Table 2 Model 1 details in terms of thickness of core wall and faceplates of honeycomb structure Model 1
Model Numbers 1.0 1.1 1.2
thickness of core wall and faceplates 2mm 1.5mm 1mm
Table 3 Model 2 details in terms of thickness of core wall and faceplates of honeycomb structure Model 2
Model Numbers 2.0 2.1 2.2
thickness of core wall and faceplates 2mm 1.5mm 1mm
Table 4 Model 3 details in terms of thickness of core wall and faceplates of honeycomb structure Model 3
Model Numbers 3.0 3.1 3.2
953
[image:4.612.150.462.92.244.2]©IJRASET: All Rights are Reserved
Table 5 Properties of Materials
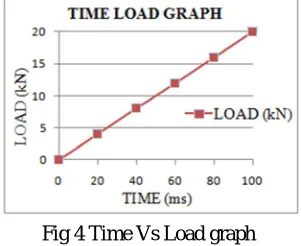
[image:4.612.232.383.289.412.2]The maximum load applied on the honeycomb structure during analysis it can be shown by time load graph which represents the load applied on the honeycomb structure every sec.
Fig 4 Time Vs Load graph
The above graph shows the maximum load in kN applied on the structure in 100ms. The fig 4 shows the max load 20kN applied on mode 1, 2 and 3.
IV.RESULTS
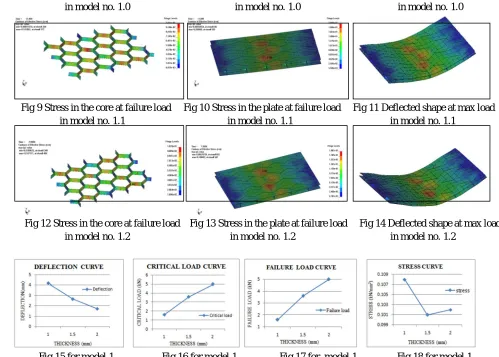
[image:4.612.64.543.550.725.2]Model 1 in which top and base faceplates are of steel material and honeycomb core is having copper material and core height 5mm. The model 1 is subdivided into two models because of change in the thickness of faceplates and wall of honeycomb core cells. In the table 2 it is shown that the thickness is varying as 2mm, 1.5mm, and 1mm. Based on the change in thickness the naming is done. The finite element analysis and theoretical results of three models are shown in the below table 6.
Table 6 Results of model 1
Model no. Analytical Deflection
at maximum load (mm)
Analytical Critical load in the core
(kN)
Analytical Failure load
(kN)
Analytical Stress in the core at failure load
(kN/mm2)
1.0 1.7 5 5 0.102
1.1 2.648 3.6 3.6 0.101
1.2 4.2 1.6 1.6 0.108
Fig 6 Stress in the core at failure load Fig 7 Stress in the plate at failure load Fig 8 Deflected shape at max load Material
Properties
Steel Copper Aluminium
Young’s Modulus(GPa) 210 128 68.3
Poisson’s Ratio 0.29 0.36 0.34
Yield Strength (GPa) 0.215 0.100 0.276
Shear Modulus (GPa) 74 45 26
954
©IJRASET: All Rights are Reserved
in model no. 1.0 in model no. 1.0 in model no. 1.0
Fig 9 Stress in the core at failure load Fig 10 Stress in the plate at failure load Fig 11 Deflected shape at max load in model no. 1.1 in model no. 1.1 in model no. 1.1
Fig 12 Stress in the core at failure load Fig 13 Stress in the plate at failure load Fig 14 Deflected shape at max load in model no. 1.2 in model no. 1.2 in model no. 1.2
[image:5.612.51.550.76.433.2]
Fig 15 for model 1 Fig 16 for model 1 Fig 17 for model 1 Fig 18 for model 1
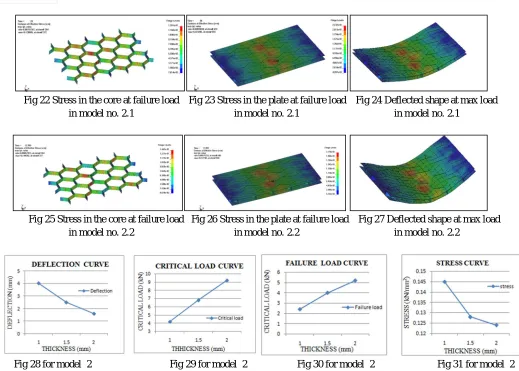
[image:5.612.58.531.526.708.2]Model 2 in which top and base faceplates are of steel material and honeycomb core is also having steel material and core height 5mm. The model 2 is subdivided into two models because of change in the thickness of faceplates and wall of honeycomb core cells. In the table 3 it is shown that the thickness is varying as 2mm, 1.5mm, and 1mm. Based on the change in thickness the naming is done. The finite element analysis and theoretical results of three models are shown in the below table 7.
Table 7 Results of model 2
Model no. Analytical Deflection at
maximum load (mm)
Analytical Critical load in the core
(kN)
Analytical Failure load
(kN)
Analytical Stress in the core at failure load
(kN/mm2)
2.0 1.6 9.2 5.2 0.124
2.1 2.5 6.8 4.0 0.128
2.2 4.03 4.2 2.4 0.145
955
©IJRASET: All Rights are Reserved
Fig 22 Stress in the core at failure load Fig 23 Stress in the plate at failure load Fig 24 Deflected shape at max load in model no. 2.1 in model no. 2.1 in model no. 2.1
[image:6.612.42.561.72.443.2]
Fig 25 Stress in the core at failure load Fig 26 Stress in the plate at failure load Fig 27 Deflected shape at max load in model no. 2.2 in model no. 2.2 in model no. 2.2
Fig 28 for model 2 Fig 29 for model 2 Fig 30 for model 2 Fig 31 for model 2
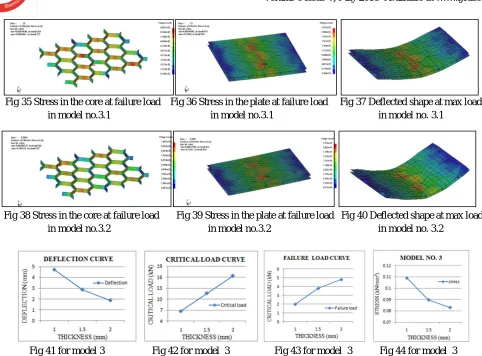
[image:6.612.65.547.529.731.2]Model 3 in which top and base faceplates are of steel material and honeycomb core is having aluminium material and core height 5mm. The model 3 is subdivided into two models because of change in the thickness of faceplates and wall of honeycomb core cells. In the table 4 it is shown that the thickness is varying as 2mm, 1.5mm, and 1mm. Based on the change in thickness the naming is done. The finite element analysis and theoretical results of three models are shown in the below table 8.
Table 8 Results of model 3
Model no. Analytical Deflection
at maximum load (mm)
Analytical Critical load in the core
(kN)
Analytical Failure load
(kN)
Analytical Stress in the core at failure load
(kN/mm2)
3.0 1.88 16.4 4.8 0.0829
3.1 2.88 11.6 3.8 0.0897
3.2 4.725 6.8 2.0 0.109
956
[image:7.612.63.545.59.415.2]©IJRASET: All Rights are Reserved
Fig 35 Stress in the core at failure load Fig 36 Stress in the plate at failure load Fig 37 Deflected shape at max load in model no.3.1 in model no.3.1 in model no. 3.1
Fig 38 Stress in the core at failure load Fig 39 Stress in the plate at failure load Fig 40 Deflected shape at max load in model no.3.2 in model no.3.2 in model no. 3.2
Fig 41 for model 3 Fig 42 for model 3 Fig 43 for model 3 Fig 44 for model 3
To study the effect of different materials used in the honeycomb sandwich structure, comparing the deflection, critical load and stress results of all models and plotting the graph for the models having same thickness of faceplate and honeycomb core wall. Table 10 shows the deflection, critical load and stress results of all models having 2mm thick faceplates and 2mm thick honeycomb core wall.
[image:7.612.94.552.513.716.2]Results for structure having thickness of faceplate and honeycomb core as 2mm:
Table 10 Results of model no.1.0, 2.0 and 3.0
Model no. Analytical Deflection
at maximum load (mm)
Analytical Critical load in
the core (kN)
Analytical Failure load
(kN)
Analytical Stress in the core at failure load
(kN/mm2)
1.0 1.7 5 5 0.102
2.0 1.6 9.2 5.2 0.124
3.0 1.88 16.4 4.8 0.0829
Fig 58 Fig 59 Fig 60 Fig 61
957
©IJRASET: All Rights are Reserved
[image:8.612.87.528.110.198.2]and core wall model no.1.0, 2.0 and 3.0 Results for structure having thickness of faceplate and honeycomb core as 1.5mm:
Table 11 Results of model no.1.1, 2.1 and 3.1
Model no. Analytical Deflection
at maximum load (mm)
Analytical Critical load in the core (kN)
Analytical Failure load
(kN)
Analytical Stress in the core at failure load
(kN/mm2)
1.1 2.648 3.6 3.6 0.101
2.1 2.5 6.8 4 0.128
3.1 2.88 11.6 3.8 0.0897
[image:8.612.63.551.236.344.2]Table 11 shows the deflection, critical load and stress results of all models having 1.5mm thick faceplates and 1.5mm thick honeycomb core wall.
Fig 62 Fig 63 Fig 64 Fig 65
The above fig 62, fig 63, fig 64 and fig 65 shows deflection, critical load, failure load and stress variation for 1.5mm thick faceplates and core wall model no.1.1, 2.1 and 3.1
[image:8.612.70.550.413.635.2]Results for structure having thickness of faceplate and honeycomb core as 1mm:
Table 12 Results of model no.1.2, 2.2 and 3.2
Model no. Analytical Deflection at
maximum load (mm)
Analytical Critical load in the core
(kN)
Analytical Failure load
(kN)
Analytical Stress in the core at failure load
(kN/mm2)
1.2 4.2 1.6 1.6 0.108
2.2 4.03 4.2 2.4 0.145
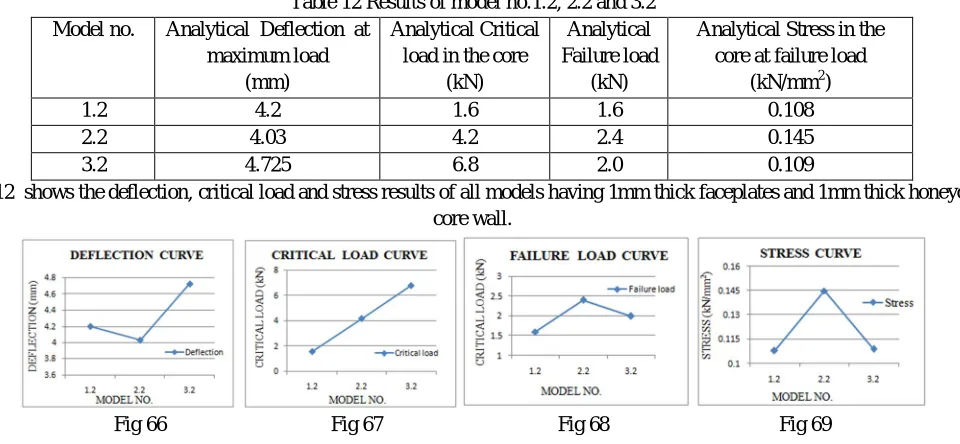
3.2 4.725 6.8 2.0 0.109
Table 12 shows the deflection, critical load and stress results of all models having 1mm thick faceplates and 1mm thick honeycomb core wall.
Fig 66 Fig 67 Fig 68 Fig 69
The above fig 66, fig 67, fig 68 and fig 69 shows deflection, critical load, failure load and stress variation for 1.5mm thick faceplates and core wall model no.1.2, 2.2 and 3.2
V.CONCLUSIONS
958
©IJRASET: All Rights are Reserved
of faceplates and walls of honeycomb core as 2mm, 1.5mm and 1mm were studied. Different parameters such as deflection, critical load and stress were studied. From finite element analysis results it was concluded that,
A. The deflection is decreasing as the thickness of the faceplates and thickness of core wall of honeycomb structure is increasing.
B. Load carrying capacity of core is increasing as the thickness of the faceplates and thickness of core wall of honeycomb structure is increasing.
C. The stress is decreasing as the thickness of the faceplates and thickness of core wall of honeycomb structure is increasing.
D. Deflection is minimum in model 1 and maximum in model 3 and deflection curve trends linearly.
E. Critical load is minimum in model 1 and maximum in model 3 and critical load curve is almost linear.
F. Failure load is nearly same for all the models as the faceplates material is steel in all models.
G. The stress variation at failure load among all the models is very close or almost same as the faceplates material is steel in all models.
VI.FUTURESCOPE
The finite element analysis and theoretically calculation for deflection and critical load of the honeycomb sandwich structure is carried out for different core materials and for the different thickness of faceplates and core wall. The thickness wall faceplates can be kept constant and only the thickness of core wall can be changed to study the behaviour of honeycomb sandwich structure. The analysis can be carried out for different diameter of core cells and also by varying the height of the core of honeycomb sandwich structure for the same combination of materials.
REFERENCES
[1] Abderrahmane Bentouhami, Boualem Keskes “Experimental Analysis And Modeling of The Buckling of a Loaded Honeycomb Sandwich Composite” Original scientific article, March 2014
[2] Banoth Ganesh, B VIjay Kumar, D. Muppala “Design and Structural Analysis of Aircraft Floor Panel” International Journal of Advanced Engineering and Global Technology, Vol-03, Issue-12, December 2015
[3] Ch. Naresh, A. Gopi Chand, K. Sunil Ratna Kumar, P.S.B.Chowdary “Numerical Investigation into Effect of Cell Shape on the Behavior of Honeycomb Sandwich Panel” International Journal of Innovative Research in Science, Engineering and Technology, Vol. 2, Issue 12, December 2013
[4] K.Kantha Rao, K. Jayathirtha Rao A.G.Sarwade, M.Sarath Chandra “Strength Analysis on Honeycomb Sandwich Panels of different Materials” International Journal of Engineering Research and Applications, Vol. 2, Issue 3, May-Jun 2012
[5] Komal A. Jangavali, D. P. Kamble “Finite Element Analysis and Experimental Evolution of Honeycomb Panel” International Journal of Science and Research, Volume 5 Issue 9, September 2016
[6] Kranti S. Jadhav, S. R. Sandanshiv “Analysis of different Polygonal Cellular Structures under Impact Loading” International Journal of Science and Research, Volume 5 Issue 7, July 2016.
[7] Mohiyuddin.C.S, Jayalakshmi Raju, Manjunath Hedge “A Study On Behaviour of Sandwich Panels under Impact Loads” International Journal of Civil Engineering, April 2015.
[8] Murat Yavuz Solmaz, Kadir Turan “Experimental and Numerical Analysis of Critical Buckling Load of Honeycomb Sandwich Panels” Journal of Composite Materials, Vol. 44, No. 24/2010.
[9] Surya Satish Adapa, Janardhan Jaggavarapu and Vijaykumar Vedangi “Structural analysis of copper honeycomb structures” International journal of advances in engineering & technology, Vol. 8, Issue 6, pp. 950-957, Dec 2015.
[10] S. S. Bhavikatti “Finite Element Analysis” second edition.