Research Article
Transcriptional Response of Selenopolypeptide Genes and
Selenocysteine Biosynthesis Machinery Genes in
Escherichia coli
during Selenite Reduction
Antonia Y. Tetteh,
1,2Katherine H. Sun,
3Chiu-Yueh Hung,
1Farooqahmed S. Kittur,
1Gordon C. Ibeanu,
1Daniel Williams,
4and Jiahua Xie
11Department of Pharmaceutical Sciences, Biomanufacturing Research Institute & Technology Enterprise, North Carolina Central University, Durham, NC 27707, USA
2Department of Biochemistry, Kwame Nkrumah University of Science and Technology, Kumasi, Ghana 3School of Geography and Geosciences, University of St Andrews, St Andrews, Fife KY16 9AX, UK 4Department of Biology, North Carolina Central University, Durham, NC 27707, USA
Correspondence should be addressed to Jiahua Xie; jxie@nccu.edu
Received 29 December 2013; Revised 28 February 2014; Accepted 16 March 2014; Published 15 April 2014
Academic Editor: Alfons J. M. Stams
Copyright © 2014 Antonia Y. Tetteh et al. This is an open access article distributed under the Creative Commons Attribution License, which permits unrestricted use, distribution, and reproduction in any medium, provided the original work is properly cited.
Bacteria can reduce toxic selenite into less toxic, elemental selenium (Se0), but the mechanism on how bacterial cells reduce selenite
at molecular level is still not clear. We usedEscherichia colistrain K12, a common bacterial strain, as a model to study its growth
response to sodium selenite (Na2SeO3) treatment and then used quantitative real-time PCR (qRT-PCR) to quantify transcript levels
of threeE. coliselenopolypeptide genes and a set of machinery genes for selenocysteine (SeCys) biosynthesis and incorporation into
polypeptides, whose involvements in the selenite reduction are largely unknown. We determined that 5 mM Na2SeO3treatment
inhibited growth by∼50% while 0.001 to 0.01 mM treatments stimulated cell growth by∼30%. Under 50% inhibitory or 30%
stimulatory Na2SeO3concentration, selenopolypeptide genes (fdnG,fdoG, andfdhF) whose products require SeCys but not SeCys
biosynthesis machinery genes were found to be induced≥2-fold. In addition, one sulfur (S) metabolic geneiscSand two previously
reported selenite-responsive genessodAandgutSwere also induced≥2-fold under 50% inhibitory concentration. Our findings
provide insight about the detoxification of selenite inE. colivia induction of these genes involved in the selenite reduction process.
1. Introduction
Selenium (Se) is a nonmetal element with atomic number 34, which is chemically related to sulfur (S) and tellurium but rarely found in its elemental form in nature. Se is an essential micronutrient for mammals and some bacteria and a component of selenocysteine (SeCys), an amino acid used by a group of proteins [1,2]. InEscherichia coligenome, there are three formate dehydrogenases FdhN, FdhO, and FdhH with each consisting of one selenopolypeptide requiring SeCys [3–6] for the oxidation of formate and carbon dioxide [2]. At elevated concentrations, however, Se can be toxic [7,8]. High Se levels are known to produce reactive oxygen species
that cause DNA damage and various diseases in mammals [8, 9]. Previous studies have shown that some bacteria, unlike mammals and yeasts, can tolerate high levels of Se through the reduction of toxic selenate and selenite to an insoluble, less toxic, red Se element (Se0) [10–13]. In nature, selenate and selenite are two major types of soluble inorganic compounds. Selenite is more toxic than selenate and other forms of Se compounds [14]. Hence, the reduction of selenite by microorganisms has a broad biological importance.
Several bacterial species includingE. colihave the capac-ity to convert selenite to Se0[15–27].E. colistrains can grow in the presence of 9.2 mM selenite and efficiently metabolize selenite into Se0[12]. However, the detailed processes of how
selenite is reduced, what molecular mechanism is utilized, and how bacterial cells respond to selenite are still unknown [13, 28] although the physiological mechanisms of selenite reduction have been studied in several species [12, 15, 26]. It is believed that selenite like selenate may enter the cells through the sulfate permease system controlled bycysA,cysU, andcysW[12]. Selenite may also enter the cells through an alternative system, such as the sulfate transporter, because disruption of sulfate permease expression did not completely block its uptake [12]. After entry into the cells, selenite may be reduced to selenide [12], followed by oxidation to Se0 [29]. Further study on the molecular mechanism involved in selenite reduction is necessary, which will assist in understanding the detoxification of selenite.
Currently, the knowledge concerning the molecular mechanism involved in selenite reduction inE. coliis lim-ited to four genes that have been identified to respond to sodium selenite (Na2SeO3) treatment. Three of them are oxidative stress stimulonssodA,gor, andtrxB, encoding the manganese superoxide dismutase, glutathione reductase, and thioredoxin reductase, respectively, which are upregulated ≥5-fold by 2 mM Na2SeO3treatment [30]. The fourth gene isgutS(or calledyhfC) that encodes the GutS polypeptide, a homolog of membrane transport proteins, which can be induced by 0.03–0.06 mM Na2SeO3 and 0.002 mM sodium tellurite [31]. Microarray analysis was employed to investigate transcript changes genome-wide in Caulobacter crescentus cells treated with 0.3 mM Na2SeO3; only 12 genes were found to be upregulated about 2- to 5-fold [32]. However, all of these genes were also induced by chromium and cadmium [32], suggesting that they are more likely to be general stress induced genes rather than specifically responding to selenite. No homologous genes of the aforementioned four selenite-induced genes involved in oxidative stress [30] and membrane transport [31] were found to be upregulated by Na2SeO3 inC. crescentus[32]. Therefore, in depth analysis is essential to understand whether any additional genes in bacterial genome are responsible for selenite reduction.
InE. coli, there are only three proteins FdhN, FdhO, and FdhH that each contains one polypeptide requiring SeCys residue for their activities [3–6]. The gene fdnG encodes a 110 kD selenopolypeptide, 𝛼 subunit of FdhN. ThefdoG encodes another 110 kD selenopolypeptide for FdhO while the fdhF encodes a 80 kD selenopolypeptide of FdhH. In addition, there is a group of SeCys biosynthesis and incor-poration machinery genes for the biosynthesis of SeCys and selenopolypeptides such as selA (selenocysteine synthase), selB(selenocysteinyl-tRNA-specific translation factor),selC (tRNA specific for selenocysteine), selD (selenophosphate synthase) [6, 33],ybbB (selenophosphate-dependent tRNA 2-selenouridine synthase) [34], and sufS (PLP-dependent selenocysteine lyase) [35]. We questioned how these genes respond during selenite reduction. To evaluate the changes in transcript levels of Se metabolic genes, Na2SeO3 concen-trations that are 30% stimulatory and 50% inhibitory on bacterial cell growth were determined and used to study their expressions by quantitative real-time PCR (qRT-PCR). In addition, microarray analysis was also used to screen selenite-responsive genes besides above selected genes.
2. Materials and Methods
2.1. Bacterial Strain and Growth Conditions. E. colistrain K12 was used in this study. Bacterial cells were grown in Luria-Bertani (LB) medium in 14-mL polystyrene round-bottom tubes. A final volume of 3 mL was used for cultures and incubated at 37∘C in a rotary shaker at 225 rpm for different periods of time depending on the experiment.
2.2. Screening Inhibitory and Stimulatory Concentrations. To determine which concentrations of Na2SeO3 inhibited and stimulated bacterial growth, an overnight culture of K12 adjusted to the optical density at 600 nm (OD600) of 1 was used as bacterial stock solution for testing. Na2SeO3 (Sigma-Aldrich) was dissolved in ddH2O to prepare 1 M selenite stock solution. Initially, each 20𝜇L of bacterial stock solution was inoculated into 3 mL LB medium containing Na2SeO3 with a final concentration of 0, 25, 50, 75, 100, or 125 mM. The experiment was performed on three biological replicates in triplicate for each concentration tested. After 14 h of growth, the extent of selenite to Se0 reduction as indicated by the degree of red color in each culture was determined qualitatively and photographs were compared. Since reduced red Se0 can interfere with optical density measurements, bacterial growth was determined by counting viable cell numbers. Cells were diluted using LB medium and then 20𝜇L of diluted culture was spread onto a LB agar and incubated at 37∘C overnight. The serial dilutions were done in triplicate for each culture. Thus, the colony-forming units (CFUs) were calculated from nine plates for each treatment.
After the initial test, 0, 5, 10, 15, 20, 25, and 30 mM Na2SeO3 were used to determine the concentration that would inhibit the bacterial growth. Another experiment using lower concentrations (0, 0.0001, 0.001, 0.01, 0.05, 0.1, 0.5, 1, 5, and 10 mM) was performed to determine which concentration stimulated bacterial growth. Both experiments were performed on three biological replicates in triplicate for each concentration tested.
2.3. Determining a Time Point of Significant Growth Difference between 5 mM Na2SeO3 Treated and Untreated Cultures. After screening the inhibitory selenite concentration, cultures were treated with selected 5 mM Na2SeO3 to determine when cells should be harvested for RNA extraction at which significant difference in bacterial growth between treated and untreated control could be observed. The same culture conditions were used as previously mentioned; treated and untreated cultures were incubated at 37∘C for 0, 2, 4, 6, 8, 10, 12, or 14 h. Colony forming units were recorded as previously mentioned for each time point. Three biological replicates done in triplicate were done for each culture.
Table 1: Primers used for qRT-PCR.
Gene name Forward primer Reverse primer
fdnG 5-CCGAAGTGGGACCAGACCTA-3 5-TGACTTTGCCTTCATCCATCAT-3
fdoG 5-GCAGATCCGCAGGGTAACC-3 5-CTTAGTGCCGTCCCATTTCAG-3
fdhF 5-TTCTGTACGTGAAGCGACGAA-3 5-GCGATGGGCCATGTCATTAT-3
selA 5-CCGAAACGCGTTCCCTCTA-3 5-GGAGCTATCGCGCAATAAGC-3
selB 5-TCGCGTGCCTGGTTTTATC-3 5-GCCAGCATGTTGGAAAGAAACT-3
selD 5-ATAACGCTGGTGCCATTGC-3 5-GTAATGAAACCCGCGACGAT-3
sufS 5-CCGCGTAGCCATGACGATA-3 5-CAGAAACCGAGCCAGGTGAT-3
ybbB 5-CGTACGCGTGGGTAAAATCA-3 5-TGAGCGCCTGAACGAAGAGT-3
sbp 5-CCACCGTGTGACTGACGAAT-3 5-AGCGCCCACTGGAAACAG-3
thiP 5-AGGGTGCGGAAATCATCGT-3 5-GCTGTCGATTGGTGATTTTGG-3
iscsS 5-GGCCGGGTTACCAAAGGTT-3 5-GCGTGTTGCCGAGAAAATG-3
gor 5-ATCGGAAGAGAAGATTGTCGGTAT-3 5-CCCTGCAACATTTCGTCCAT-3
sodA 5-TCTCCGCTGATGGGTGAAG-3 5-CACATCCAGGCCCATAATCG-3
trxB 5-TGCCGGTCTGTTTGTTGCT-3 5-GCCCTTCGAAAATCGCAGTA-3
gutS 5-TGGAAATCGTCCCGTTGAA-3 5-GCCAGCACCATCAGGAGAAA-3
16S 5-TTTACGCCCAGTAATTCCGATT-3 5-CCAGCAGCCGCGGTAATA-3
glmM 5-AGCGGCGATCCACTTGAG-3 5-CCAGCGCAGCTTCAACCT-3
rfaP 5-GCGGATGCCCGTTTTG-3 5-CATCACTCAGGCGATGAATAGC-3
yegB 5-GGTTGGCATGGCGGTATTAA-3 5-TCAGCGGCGATAAACCTGTA-3
ydbA 5-CGCCATATGCGGGTGTAAA-3 5-GCATTGCGCTCCTGATAGC-3
ynbC 5-CGTCTGCGTGGTCTGTTTTTT-3 5-GCCGATCGTGGGTCAAATAG-3
phnI 5-TTTTGGCTTATTGGTGGATGTG-3 5-TTACCGCAGAGCCGTTTTTT-3
nfi 5-CGTCGGCGAACTGCTGAT-3 5-CGGCGGGTCGATAAAACC-3
culture periods, cells were precultured to first reach OD600of 0.2, 0.4, and 0.8; then, these were served as initial inoculant concentrations for culturing for 0.5, 1, 1.5, 2, 2.5, and 3 h. The cell density of each culture was recorded by measuring OD600 value. Three biological replicates with triplicate assay for each time point were done for the entire experiment.
2.5. RNA Isolation. Total RNA was isolated using the RiboPure-Bacteria RNA Isolation Kit (Applied Biosys-tems/Ambion, USA) and treated with DNase I (Applied Biosystems/Ambion, USA) to remove any DNA contamina-tion. RNA concentration was quantified using a NanoDrop ND 1000 spectrophotometer. The quality of the RNA was visualized on a 1.2% agarose gel. For microarray analysis, RNA quality was further checked using a dual beam spec-trophotometer and an Agilent Bioanalyzer 2100 Lab-on-a-Chip system.
2.6. qRT-PCR Analysis. Three selenopolypeptide genes (fdnG,fdoG, andfdhF) and five machinery genes (selA,selB, selD, ybbE, and sufS) for SeCys biosynthesis and insertion were selected to quantify their expression levels in response to selenite treatments. The selC was not selected because its sequence (95 bp) is too short to meet the requirement of primer design software Primer Express 3.0 (Applied Biosystems/Ambion, USA) for designing a pair of primers. Previously reported four selenite-induced genes (gor,sodA, trxB, andgutS) [30,31] and three S metabolism related genes
(sbp, sulfate transporter subunit,thiP, thiamine transporter membrane protein, andiscS, cysteine desulfurase) [36–38] were included for comparison. Bacterial cells untreated and treated either with 0.01 or 5 mM Na2SeO3 were used for RNA isolation. Equal amounts of RNA for each sample were used to synthesize first-strand of cDNA with a High Capacity cDNA Reverse Transcription kit and random primers (Applied Biosystems, USA). PCR was carried out with the Power SYBR Green mix (Applied Biosystems, USA). Primer design and ΔΔCt calculation were carried out as described previously [39]. Sequences of selected genes were retrieved from strain K12 genome (accession no. AC 000091) deposited in NCBI (http://www.ncbi.nlm.nih.gov/) for designing primers. The16S rRNAwas used as an endogenous control. 16S rRNA primers were designed based on 719 bp conserved region of seven members (rrsA,B,C,D,E,G, and H) also retrieved from strain K12 genome. Each sample was assayed in triplicate and the experiment was repeated with three biological replicates. Detailed primer information for each gene is listed inTable 1.
0 25 50 75 100 125
Cell number
∗
∗ ∗
∗ ∗
1.0E + 00 1.0E + 02 1.0E + 04 1.0E + 06 1.0E + 08 1.0E + 10
Na2SeO3(mM)
(a)
0 25 50 75 100 125
Na2SeO3(mM)
(b)
0 5 10 15 20 25 30
Cell number
∗
∗ ∗ ∗ ∗ ∗
1.0E + 06 1.0E + 07 1.0E + 08 1.0E + 09 1.0E + 10
Na2SeO3(mM)
(c)
0 5 10 15 20 25 30
Na2SeO3(mM)
[image:4.600.71.530.72.352.2](d)
Figure 1: Effect of Na2SeO3treatment onE. colicell growth and selenite reduction. The number of bacterial cells under 0 to 125 mM Na2SeO3
treatments (a) and 0 to 30 mM Na2SeO3treatments (c). The experiment was performed with three biological replicates and each Na2SeO3
treated sample was analyzed in triplicate. Data plotted was the average of cell numbers±SD. A representative of change in color of cultures
treated with 0 to 125 mM Na2SeO3(b) and 0 to 30 mM Na2SeO3(d). ∗𝑃 ≤ 0.05.
20,366 genes in the K12 strain and three otherE. colistrains. The RNA quality control analysis, standardization, cRNA labeling, and array hybridization were processed at Genome Explorations Inc. (http://www.genome-explorations.com/, USA). Raw signals (CEL files) were normalized and trans-formed into log2values by MAS 5 (scaled to TGT = 250). For statistical analysis, the significance analysis tool set in gene traffic was employed to perform multiclass ANOVA. Pairwise comparisons were made between untreated control and 0.01 or 5 mM treatment. All probe sets having comparisons reach-ing absolute fold change≥1.5 and𝑡-test𝑃values≤0.05 were selected for further qRT-PCR confirmation. Aforementioned qRT-PCR conditions and endogenous control were used. Sequences of related genes were retrieved from strain K12 genome. Detailed primer information for each gene is listed inTable 1.
2.8. Statistical Analysis. For the comparison of cell numbers between untreated control and Na2SeO3treatments, Student’s 𝑡-test was used.
3. Results
3.1. Na2SeO3 Concentration Causing 50% Inhibitory Effects. To examine Na2SeO3inhibitory effects on bacterial growth, E. coliK12 was cultivated in the presence of high concen-tration of Na2SeO3at 0, 25, 50, 75, 100, or 125 mM. Results
showed that all these selenite treatments caused more than 50% inhibition of E. coli growth (Figure 1(a)). Overnight treatment using 25 mM selenite inhibited bacterial growth about 8-fold compared to untreated cultures (Figure 1(a)) and led the culture to turn red (Figure 1(b)), indicating that selen-ite reduction has occurred. When 50 mM or higher selenselen-ite concentrations were used, cell numbers drastically decreased and these cultures turned slightly but not completely red. This suggests that selenite reduction was decreased under high selenite concentrations, which could be due to extremely low number of bacterial cells.
A narrower range of Na2SeO3 (0 to 30 mM with a 5 mM interval) was used to determine a concentration of Na2SeO3 that would inhibit bacterial growth by 50%. We found that 5 mM Na2SeO3treatment reduced cell numbers by 53% and turned cultures red (Figures1(c)and1(d)). When concentrations of 10 to 30 mM were used, cell numbers were reduced by 79–97% and all these cultures still turned red, especially at 10 and 15 mM. These results are consistent with the previous observations that selenite can be reduced to red Se0byE. coli[12,30] and indicate that the selenite reduction occurred efficiently inE. coliK12 cells treated with 5 to 30 mM Na2SeO3.
C
ell n
u
m
b
er (100%)
∗ ∗
∗ ∗
∗
Na2SeO3(mM)
0.0
0.0001 0.001 0.005 0.01 0.05
0.1 0.5 1.0 5.0 10.0
180 160 140 120 100 80 60 40 20 0
(a)
Na2SeO3(mM)
0.0
0.0001 0.001 0.005 0.01 0.05
0.1 0.5 1.0 5.0 10.0
(b)
Figure 2: Effect of low concentrations of Na2SeO3 treatment onE. colicell growth and selenite reduction. (a) The effect of 0 to 10 mM
Na2SeO3on cell growth rates. The experiment was performed with three biological replicates and each Na2SeO3treated sample was analyzed
in triplicate. Data plotted was the average of growth±SD. The concentrations (0, 0.01, and 5 mM) that were marked in blue were used to
prepare RNA samples for microarray analysis. (b) Color change in cultures after treatments with 0 to 10 mM Na2SeO3.∗𝑃 ≤ 0.05.
growth, 0 to 10 mM Na2SeO3 was tested. Compared to the untreated control, 0.0001 to 0.1 mM Na2SeO3 treatments could stimulate K12 cell growth (Figure 2(a)). The stimulatory effects were increased from 10% to 30% when the concentra-tions were increased from 0.0001 to 0.001 mM. However, no significant color changes were observed in 0.0001 to 0.01 mM treated cultures, indicating no or very low levels of selenite reduction occurring (Figure 2(b)). The stimulatory effects of selenite on the cell growth were decreased with increasing in Na2SeO3concentrations (Figure 2(a)). When 0.05 to 0.5 mM treatments were used, the cultures turned red (Figure 2(b)) but the stimulatory effects of these treatments on bacterial growth were slight (Figure 2(a)). Consistently, more than 50% inhibitory effects with clear red color in cultures were observed in this experiment when Na2SeO3 concentrations reached as high as 5 and 10 mM. Based on the above results, 0.01 mM was selected as a stimulatory concentration for further studies.
3.3. Expression Levels of Selected Genes under Inhibitory and Stimulatory Conditions. To investigate how selenopolypep-tide genes and machinery genes for SeCys biosynthesis and insertion respond to Na2SeO3concentrations that cause 30% stimulatory or 50% inhibitory to bacterial cell growth, their transcript levels were quantified by qRT-PCR. For compari-son, harvesting Na2SeO3-treated and untreated cultures at a time point where the most significant difference in growth is important. To this end, a∼50% inhibitory concentration of 5 mM Na2SeO3was used for cultures and bacterial growth was monitored every 2 h for 14 h. Cell densities were sig-nificantly different between treated and untreated cultures after being grown for 2 and 4 h (Figure 3(a)). The number of cells in treated culture was reduced during the first 2 h of growth, which suggests that some cells may have died during the initial culture stage. Those survival cells gradually caught up the growth and reached the highest cell numbers at 10 h. The untreated cultures, on the other hand, reached stationary
phase early at 6 h, but the highest cell numbers were also at 10 h. Therefore, 6 h was selected as a time point to harvest cells for quantifying gene expression levels.
To investigate the expression of selenite-responsive genes at different culture time point, previously reported growth times of 0.5 [30,32] and 2 h [30,31] were also used as well as 6 h treatment. However, the number of cells could be too low to isolate a usable quality and quantity of RNA after growing for 0.5 and 2 h if the same 20𝜇L bacterial stock solution (OD600= 1) is inoculated into 3 mL LB medium. To determine which initial culture concentration would allow the culture to reach log phase after culturing for 0.5 to 3 h, a pretest culture experiment was performed with initial OD600of 0.2, 0.4, and 0.8. The results showed that OD600 values increased from initial 0.2, 0.4, and 0.8 to 0.4, 0.6, and 0.9 after culturing for 0.5 h and to 0.9, 1.1, and 1.2 after culturing for 2 h, respectively (Figure 3(b)). Based on these observations, bacterial growths reached to log phase after 0.5 and 2 h cultures when the initial OD600of 0.4 was used. Therefore, cultures with initial OD600 of 0.4 treated with 0.01 or 5 mM Na2SeO3for either 0.5 or 2 h were used to study gene expression.
Cell num
bers
(h)
Untreated control
0 2 4 6 8 10 12 14 16
1.0E + 05 1.0E + 06 1.0E + 07 1.0E + 08 1.0E + 09 1.0E + 10
5mM Na2SeO3
(a)
(min)
OD
600
values
1.6
1.4 1.2
1 0.8
0.6 0.4
0.2 0
0 50 100 150 200
0.8 0.4 0.2
[image:6.600.62.542.76.297.2](b)
Figure 3: The growth curve of bacterial cells. The growth curve of cells cultured with or without 5 mM Na2SeO3(a). The growth curve of
cells cultured with initial culture concentrations of OD600values of 0.2, 0.4, and 0.8 (b). Each experiment was performed with three biological
replicates and each treatment was assayed in triplicate. Data plotted was the average±SD.
Table 2: Hybridization signals of average of all probe sets and seven selected probe sets and fold changes of seven selenite-responsive candidate genes from microarray analysis.
Probe set IDa Gene name Signals/encoding enzymes Microarray hybridization signals
b Fold changesc
0 0.01 mM 5 mM 0.01 mM 5 mM
Average of all probe sets 554.2±2.3 557.0±1.9 560.2±1.8
1762328 glmM Phosphoglucosamine mutase 61.0±15.4 64.3±6.8 32.0±4.7 1.1 −1.9
1764010 rfaP Lipopolysaccharide core biosynthesis protein rfaP 33.7±1.7 51.8±9.5 49.4±1.6 1.5 1.5
1764732 yegB Multidrug efflux system protein MdtE 27.0±10.5 55.4±3.7 48.9±16 2.2 1.8
1767270 ydbA Hypothetical protein 144.8±17.6 90.4±3.8 135.3±18.2 −1.6 1.1
1768816 ynbC Hypothetical protein 55.5±4.6 32.0±9 42.6±6.1 −1.8 1.3
1768993 phnL PhnI protein 50.6±10.1 70.1±14.2 90.7±15 1.4 1.8
1768842 nfi Endonuclease V 43.9±6.3 72.1±15 43.3±11.3 1.6 1.0
aSelected probe sets corresponding to selenite-responsive candidate genes have absolute fold changes≥1.5 and𝑡-test𝑃values≤0.05 either in 0.01 or 5 mM
Na2SeO3treatment.bHybridization signals of average of all 10,208 probe sets and seven probe sets. Mean values±SD(𝑛 = 3). Average of background signals are
39.7±2.3, 45.8±1, and 47.4±0.4 for 0, 0.01 and 5 mM, respectively.cFold changes of selenite-responsive candidate genes from microarray analysis comparing
to untreated control. “−” means reduced expression.
the other treatments (Figure 4(d)). The expression levels of the other two genes (gorandtrxB) did not meet the 2-fold cutoff under either 0.01 or 5 mM treatment, which is not in agreement with previous report by B´ebien et al. [30].
3.4. Identification of Additional Selenite-Responsive Genes by Microarray Analysis. Microarray analysis is a powerful approach to study differential gene expression by genome-wide screening simultaneously. In order to identify genes besides above selected genes that are responsive to cur-rent selenite treatment conditions, microarray analysis was performed to compare transcript levels of genes in whole genome between untreated cells and 0.01 or 5 mM and 6 h
[image:6.600.53.548.383.508.2]0 2 4 6 8 10 12
14 Three selenopolypeptide genes
0.5 2 6 0.5 2 6 0.5 2 6
fdoG
fdnG fdhF
Rela
tive expression (fold)
(h)
(a)
Five machinery genes
selD selB
selA 0 0.5 1 1.5 2 2.5
ybbB (h)
sufS
0.5 2 6 0.5 2 6
0.5 2 6 0.5 2 6
0.5 2 6
Rela
tive expression (fold)
(b)
0 0.5 1 1.5 2 2.5 3 3.5
Three sulfur metabolic genes
0.5 2 6
iscS thiP
sbp
Rela
tive expression (fold)
0.5 2 6 0.5 2 6 (h)
0mM
0.01mM
5mM
(c)
Four reported selenite induced genes
0 1 2 3 4 5 6
0.5 2 6 0.5 2 6
0.5 2 6
0.5 2 6 (h)
gor sodA trxB gutS
Rela
ti
ve
exp
re
ssio
n (f
o
ld)
0mM
0.01mM
5mM
[image:7.600.66.539.71.477.2](d)
Figure 4: Transcript levels of selected genes quantified by qRT-PCR. (a) Three selenopolypeptide genes:fdnG,fdoG,andfdhF. (b) Five
machinery genes for SeCys biosynthesis and insertion:selA,selB,selD,ybbE, andsufS. (c) Three S metabolic genes:sbp,thiP, andiscS. (d)
Four previously reported selenite-induced genes:gor,sodA,trxB, andgutS. The RNA samples were isolated from bacteria cells grown under
0, 0.01, or 5 mM Na2SeO3for 0.5, 2, or 6 h. Data shown are fold changes calculated as transcript levels of selenite treated samples compared
to untreated (defined as 1). Data represent an average of three biological replicates±SD. Each replicate was assayed in triplicate.
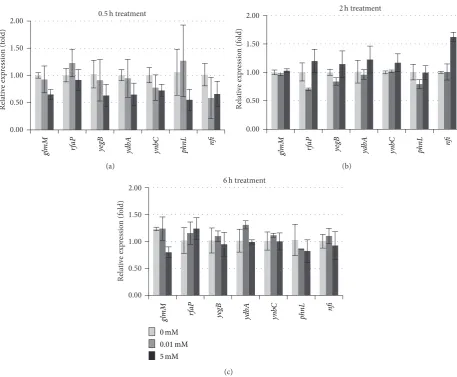
surprising to note that transcript levels of all above selenite-responsive genes detected by qRT-PCR did not display dif-ference between treated and control. Only expression levels ofyegB(probe set ID 1764732) were induced 2.2- and 1.8-fold by 0.01 and 5 mM treatments, respectively (Table 2), but its average hybridization signal in control group was 27.0, which is below the background signal 39.7 (Table 2).
Using absolute fold change ≥1.5 and𝑃 values ≤0.05 as a standard, three genes in K12 genome were induced in their expressions while two genes were inhibited by 0.01 mM Na2SeO3 treatment for 6 h (Table 2). When K12 cells were treated with 5 mM for 6 h, only two genes were induced while one was inhibited in their expressions. Among these identified selenite-responsive candidate genes, theyegBwas induced≥1.5 by both 0.01 and 5 mM treatments. However, all these candidate genes had relatively low hybridization signals
(Table 2). When qRT-PCR was used to confirm expression levels of these selenite-responsive candidate genes in cells treated with 0.01 or 5 mM selenite for 0.5, 2, or 6 h, none of them had their expression level changed more than 1.5-fold under either stimulatory or inhibitory conditions (Figure 5).
4. Discussion
Rela
ti
ve
exp
re
ssio
n (f
o
ld)
0.00 0.50 1.00 1.50
2.00 0.5h treatment
glm
M
rf
a
P
yegB ydbA ynb
C
ph
n
L nfi
(a)
Rela
ti
ve
exp
re
ssio
n (f
o
ld)
0.00 0.50 1.00 1.50
2.00 2h treatment
gl
mM rfa
P
yegB ydbA ynb
C
ph
n
L nfi
(b)
Rela
ti
ve
exp
re
ssio
n (f
o
ld)
0.00 0.50 1.00 1.50
2.00 6h treatment
gl
mM rfa
P
yegB ydbA ynb
C
ph
n
L nfi
0mM
0.01mM 5mM
[image:8.600.69.527.69.446.2](c)
Figure 5: Transcript levels of seven selenite-responsive candidate genes quantified by qRT-PCR. The RNA samples were isolated from bacteria
cells grown under 0, 0.01, or 5 mM Na2SeO3treatment for (a) 0.5, (b) 2, or (c) 6 h. Data shown are fold changes calculated as transcript levels
of selenite treated samples compared to untreated (defined as 1). Data represent an average of three biological replicates±SD. Each replicate
was assayed in triplicate.
but never affects cell growth until it reaches 0.08 mM [41,42]. At higher concentrations (>5 mM), selenite becomes toxic via the mechanism of oxidative stress [30]. In the present study, 0.001 to 0.01 mM sodium selenite concentrations were found to promote bacterial growth approximately by 30% (Figure 2(a)). The trend of all four concentrations used for stimulatory effect was the same although 0.001 and 0.05 mM treatments did not have significantly stimulatory effects. Meanwhile, 5 mM treatment inhibited cell growth steadily by more than 50% (Figures1(c),2(a), and3(a)). The results of our growth studies are consistent with previous reports [4,30,41,42] which lay a foundation for further investigating selenite-responsive genes.
Using qRT-PCR analysis, we found that all three selenopolypeptide genes fdnG, fdoG, and fdhF encod-ing selenopolypeptides for FdhN, FdhO, and FdhH were induced more than 2-fold by both 0.01 and 5 mM Na2SeO3 (Figure 4(a)), which have not been reported previously. E. coli has only these three proteins with each containing
selenopolypeptide genes are either directly or indirectly involved in selenite reduction.
Moreover, we also found that one sulfur metabolic gene iscSand two previously reported selenite-induced genessodA and gutSwere induced only by 5 mM (Figure 4(d)), which indicate these genes are also involved in selenite reduction. Under 5 mM Na2SeO3treatment, bacterial cells were already under toxic condition with more than 50% growth inhibition even though the selenite reduction was still active as judged from the accumulation of Se0(Figures1and2). It is known that under the toxic conditions, the reduction of selenite involves reactions with sulfhydryl groups of thiol-containing molecules, such as glutathione, and some of these reactions produce reactive oxygen species: hydrogen peroxide and superoxide [12,30]. Both hydrogen peroxide and superoxide can cause damage to cell membranes and DNA [46]. There-fore, the gene like sodA encoding the antioxidant enzyme [30] is induced in response to oxidative stress. However, it is not clear why previously reported selenite inducible genesgorandtrxB, encoding antioxidant proteins glutathione reductase and thioredoxin reductase, respectively [30], could not be induced by selenite treatment in the present study. Induced expression of gutS by selenite was similar to the previous report [31]. ThegutS gene product may allow Se to permeate into cells because it shares homology with membrane transport proteins. Induction of iscS under the selenite toxic conditions (Figure 4(c)) may be due to its dual function in both S and Se metabolisms. Unlike the other two sulfur metabolic genes, the iscS is also required for biosynthesis of 2-selenouridine in tRNA and FdhH [47].
In the present study, we also made an attempt to iden-tify selenite-responsive genes genome-wide by microarray screening. Surprisingly, this screening did not yield any selenite-responsive genes in cells treated with 50% inhibitory or 30% stimulatory Na2SeO3 concentration. Our results of microarray experiment are similar to those reported by Hu and coworkers [32], in which only a few general stress-induced genes were identified in their microarray screening. Although underestimation of the fold changes of differen-tially expressed genes in a microarray assay was reported previously in comparison with the qRT-PCR analysis [48], Hu and coworkers (2005) [32] could still use microarray analysis to identify chromium and cadmium (but not Se) induced genes in bacterium. Our current microarray results in conjunction with microarray screening results reported by Hu et al. (2005) [32] from selenite treated bacterial cells suggest that selenite reduction may result from minor contributions from a small set of genes with slight changes at transcript levels and that microarray analysis may not be sensitive enough to identify those selenite-responsive genes, which could be identified by qRT-PCR.
5. Conclusions
We have comprehensively studied the bacterial growth under various concentrations of Na2SeO3 and determined that 0.001 to 0.01 mM promoted bacterial growth approximately by 30%, whereas 5 mM treatment inhibited cell growth
by more than 50%. Although microarray analysis was not sensitive enough to identify these selenite-responsive genes in bacteria, we were able to determine that genes encod-ing selenopolypeptides and some antioxidant proteins were involved in selenite reduction. Our findings will help to further elucidate the mechanism responsible for selenite reduction.
Conflict of Interests
The authors declare that there is no conflict of interests regarding the publication of this paper.
Acknowledgments
This work was supported by a United States Department of Agriculture-Cooperative State Research, Education, and Extension Service grant (no. 2009-35318-05032), a Biotech-nology Research grant (no. 2007-BRG-1223) from the North Carolina Biotechnology Center, and a startup fund from the Golden LEAF Foundation to the Biomanufacturing Research Institute and Technology Enterprise (BRITE).
References
[1] M. Birringer, S. Pilawa, and L. Floh´e, “Trends in selenium
biochemistry,”Natural Product Reports, vol. 19, no. 6, pp. 693–
718, 2002.
[2] V. N. Gladyshev, “Selenoproteins and selenoproteomes,” in
Selenium: Its Molecular Biology and Role in Human Health, D. L. Hatfield, M. J. Berry, and V. N. Gladyshev, Eds., pp. 99–114, Springer, New York, NY, USA, 2nd edition, 2006.
[3] F. Zinoni, A. Birkmann, T. C. Stadtman, and A. Bock, “Nucleotide sequence and expression of the selenocysteine-containing polypeptide of formate dehydrogenase
(formate-hydrogen-lyase-linked) fromEscherichia coli,”Proceedings of the
National Academy of Sciences of the United States of America, vol. 83, no. 13, pp. 4650–4654, 1986.
[4] F. Zinoni, A. Birkmann, W. Leinfelder, and A. Bock, “Cotrans-lational insertion of selenocysteine into formate dehydrogenase fromEscherichia colidirected by a UGA codon,”Proceedings of the National Academy of Sciences of the United States of America, vol. 84, no. 10, pp. 3156–3160, 1987.
[5] G. Sawers, J. Heider, E. Zehelein, and A. Bock, “Expression and
operon structure of the sel genes ofEscherichia coliand
identi-fication of a third selenium-containing formate dehydrogenase
isoenzyme,”Journal of Bacteriology, vol. 173, no. 16, pp. 4983–
4993, 1991.
[6] W. Leinfelder, K. Forchhammer, F. Zinoni, G. Sawers, M.
A. Mandrand-Berthelot, and A. B¨ock, “Escherichia coligenes
whose products are involved in selenium metabolism,”Journal
of Bacteriology, vol. 170, no. 2, pp. 540–546, 1988.
[7] K. Schwarz and C. M. Foltz, “Selenium as an integral part of
factor 3 against dietary necrotic liver degeneration,”Journal of
the American Chemical Society, vol. 79, no. 12, pp. 3292–3293, 1957.
[8] M. Vinceti, E. T. Wei, C. Malagoli, M. Bergomi, and G. Vivoli,
“Adverse health effects of selenium in humans,” Reviews on
[9] A. Berken, M. M. Mulholland, D. L. LeDuc, and N. Terry, “Genetic engineering of plants to enhance selenium
phytore-mediation,”Critical Reviews in Plant Sciences, vol. 21, no. 6, pp.
567–582, 2002.
[10] G. S. Ahluwalia, Y. R. Saxena, and H. H. Williams, “Quantitative
studies on selenite metabolism inEscherichia coli,”Archives of
Biochemistry and Biophysics, vol. 124, pp. 79–84, 1968. [11] T. L. Gerrard, J. N. Telford, and H. H. Williams, “Detection of
selenium deposits inEscherichia coliby electron microscopy,”
Journal of Bacteriology, vol. 119, no. 3, pp. 1057–1060, 1974. [12] R. J. Turner, J. H. Weiner, and D. E. Taylor, “Selenium
metabolism inEscherichia coli,”Biometals, vol. 11, no. 3, pp. 223–
227, 1998.
[13] J. F. Stolz, P. Basu, J. M. Santini, and R. S. Oremland, “Arsenic
and selenium in microbial metabolism,” Annual Review of
Microbiology, vol. 60, pp. 107–130, 2006.
[14] J. W. Doran, “Microorganisms and the biological cycling of
selenium,” inAdvances in Microbial Ecology, K. L. Marshall, Ed.,
pp. l–32, Plenum Press, New York, NY, USA, 1982.
[15] C. Garbisu, S. Gonzalez, W.-H. Yang et al., “Physiological mechanisms regulating the conversion of selenite to elemental
selenium byBacillus subtilis,”Biofactors, vol. 5, no. 1, pp. 29–37,
1995.
[16] A. Yamada, M. Miyashita, K. Inoue, and T. Matsunaga, “Extra-cellular reduction of selenite by a novel marine photosynthetic
bacterium,”Applied Microbiology and Biotechnology, vol. 48, no.
3, pp. 367–372, 1997.
[17] R. S. Dungan and W. T. Frankenberger Jr., “Reduction of selenite
to elemental selenium byEnterobacter cloacaeSLD1a-1,”Journal
of Environmental Quality, vol. 27, no. 6, pp. 1301–1306, 1998. [18] J. Kessi, M. Ramuz, E. Wehrli, M. Spycher, and R. Bachofen,
“Reduction of selenite and detoxification of elemental
sele-nium by the phototrophic bacteriumRhodospirillum rubrum,”
Applied and Environmental Microbiology, vol. 65, no. 11, pp. 4734–4740, 1999.
[19] W. J. Hunter and L. D. Kuykendall, “Identification and
char-acterization of anAeromonas salmonicida (synHaemophilus
piscium) strain that reduces selenite to elemental red selenium,”
Current Microbiology, vol. 52, no. 4, pp. 305–309, 2006.
[20] W. J. Hunter, “AnAzospira oryzae(synDechlorosoma suillum)
strain that reduces selenate and selenite to elemental red
selenium,” Current Microbiology, vol. 54, no. 5, pp. 376–381,
2007.
[21] W. J. Hunter and L. D. Kuykendall, “Reduction of selenite to
elemental red selenium byRhizobiumsp. strain B1,”Current
Microbiology, vol. 55, no. 4, pp. 344–349, 2007.
[22] W. J. Hunter, L. D. Kuykendall, and D. K. Manter, “Rhizobium
selenireducens sp. nov.: a selenite-reducing 𝛼-Proteobacteria
isolated from a bioreactor,”Current Microbiology, vol. 55, no. 5,
pp. 455–460, 2007.
[23] W. J. Hunter and D. K. Manter, “Bio-reduction of selenite
to elemental red selenium by Tetrathiobacter kashmirensis,”
Current Microbiology, vol. 57, no. 1, pp. 83–88, 2008.
[24] C. I. Pearce, V. S. Coker, J. M. Charnock et al., “Microbial man-ufacture of chalcogenide-based nanoparticles via the reduction
of selenite usingVeillonella atypica: an in situ EXAFS study,”
Nanotechnology, vol. 19, no. 15, Article ID 155603, 2008.
[25] W. J. Hunter and D. K. Manter, “Pseudomonas
seleniipraecipita-tussp. nov.: a selenite reducing𝛾-Proteobacteriaisolated from
Soil,”Current Microbiology, vol. 62, no. 2, pp. 565–569, 2011.
[26] M. Kabiri, M. A. Amoozegar, M. Tabebordbar, K. Gilany, and G. H. Salekdeh, “Effects of selenite and tellurite on growth, phys-iology, and proteome of a moderately halophilic bacterium,”
Journal of Proteome Research, vol. 8, no. 6, pp. 3098–3108, 2009. [27] P. Bao, H. Huang, Z. Y. Hu et al., “Impact of temperature,
CO2fixation and nitrate reduction on selenium reduction, by a
paddy soilClostridiumstrain,”Journal of Applied Microbiology,
vol. 114, no. 3, pp. 703–712, 2013.
[28] N. Yee, “Geomicrobiology of selenium: life and death by
selenite,”Applied Geochemistry, vol. 26, pp. S324–S325, 2011.
[29] R. S. Dungan, S. R. Yates, and W. T. Frankenberger Jr.,
“Transformations of selenate and selenite byStenotrophomonas
maltophiliaisolated from a seleniferous agricultural drainage
pond sediment,”Environmental Microbiology, vol. 5, no. 4, pp.
287–295, 2003.
[30] M. B´ebien, G. Lagniel, J. Garin, D. Touati, A. Verm´eglio, and J. Labarre, “Involvement of superoxide dismutases in the response ofEscherichia colito selenium oxides,”Journal of Bacteriology, vol. 184, no. 6, pp. 1556–1564, 2002.
[31] J. Guzzo and M. S. Dubow, “A novel selenite- and
tellurite-inducible gene inEscherichia coli,”Applied and Environmental
Microbiology, vol. 66, no. 11, pp. 4972–4978, 2000.
[32] P. Hu, E. L. Brodie, Y. Suzuki, H. H. McAdams, and G. L. Andersen, “Whole-genome transcriptional analysis of heavy
metal stresses inCaulobacter crescentus,”Journal of Bacteriology,
vol. 187, no. 24, pp. 8437–8449, 2005.
[33] G. Sawers, “The hydrogenases and formate dehydrogenases of
Escherichia coli,”Antonie van Leeuwenhoek, vol. 66, no. 1–3, pp. 57–88, 1994.
[34] M. D. Wolfe, F. Ahmed, G. M. Lacourciere, C. T. Lauhon, T. C. Stadtman, and T. J. Larson, “Functional diversity of the
rhodanese homology domain: theEscherichia coliybbB gene
encodes a selenophosphate-dependent tRNA 2-selenouridine
synthase,”Journal of Biological Chemistry, vol. 279, no. 3, pp.
1801–1809, 2004.
[35] H. Mihara, M. Maeda, T. Fujii, T. Kurihara, Y. Hata, and
N. Esaki, “A nifS-like gene, csdB, encodes anEscherichia coli
counterpart of mammalian selenocysteine lyase. Gene cloning, purification, characterization and preliminary X-ray
crystallo-graphic studies,”Journal of Biological Chemistry, vol. 274, no. 21,
pp. 14768–14772, 1999.
[36] R. Kambampati and C. T. Lauhon, “IscS is a sulfurtransferase
for the in vitro biosynthesis of 4- thiouridine inEscherichia coli
tRNA,”Biochemistry, vol. 38, no. 50, pp. 16561–16568, 1999.
[37] A. D. Hollenbach, K. A. Dickson, and M. W. Washabaugh,
“Thiamin transport inEscherichia coli: the mechanism of
inhi-bition by the sulfhydryl-specific modifierN-ethylmaleimide,”
Biochimica et Biophysica Acta: Biomembranes, vol. 1564, no. 2, pp. 421–428, 2002.
[38] M. Riley, T. Abe, M. B. Arnaud et al., “Escherichia coliK-12: a
cooperatively developed annotation snapshot—2005,”Nucleic
Acids Research, vol. 34, no. 1, pp. 1–9, 2006.
[39] C.-Y. Hung, Y.-H. Sun, J. Chen et al., “Identification of a Mg-protoporphyrin IX monomethyl ester cyclase
homo-logue, EaZIP, differentially expressed in variegatedEpipremnum
aureum“Golden Pothos” is achieved through a unique method
of comparative study using tissue regenerated plants,”Journal of
Experimental Botany, vol. 61, no. 5, pp. 1483–1493, 2010. [40] F. R. Blattner, G. Plunkett III, C. A. Bloch et al., “The complete
genome sequence ofEscherichia coliK-12,”Science, vol. 277, no.
[41] D. B. Cowie and G. N. Cohen, “Biosynthesis byEscherichia coli
of active altered proteins containing selenium instead of sulfur,”
Biochimica et Biophysica Acta, vol. 26, no. 2, pp. 252–261, 1957. [42] T. Tuve and H. H. Williams, “Metabolism of selenium by
Escherichia coli: biosynthesis of selenomethionine,”The Journal of Biological Chemistry, vol. 236, pp. 597–601, 1961.
[43] M. Jormakka, B. Byrne, and S. Iwata, “Formate
dehydro-genase—a versatile enzyme in changing environments,”Current
Opinion in Structural Biology, vol. 13, no. 4, pp. 418–423, 2003. [44] J. C. Boyington, V. N. Gladyshev, S. V. Khangulov, T. C.
Stadt-man, and P. D. Sun, “Crystal structure of formate dehydrogenase H: catalysis involving Mo, molybdopterin, selenocysteine, and
an Fe4S4cluster,”Science, vol. 275, no. 5304, pp. 1305–1308, 1997.
[45] W. B. Whitman and C. Jeanthon, “The methanococcales,” inThe
Prokaryotes, M. Dworkin, S. Falkow, E. Rosenderg et al., Eds., pp. 257–273, Springer, New York, NY, USA, 3rd edition, 2006.
[46] D. Touati, “Iron and oxidative stress in bacteria,”Archives of
Biochemistry and Biophysics, vol. 373, no. 1, pp. 1–6, 2000. [47] H. Mihara, S.-I. Kato, G. M. Lacourciere et al., “The iscS gene
is essential for the biosynthesis of 2-selenouridine in tRNA and the selenocysteine-containing formate dehydrogenase H,”
Proceedings of the National Academy of Sciences of the United States of America, vol. 99, no. 10, pp. 6679–6683, 2002. [48] T. Yuen, E. Wurmbach, R. L. Pfeffer, B. J. Ebersole, and S. C.
Seal-fon, “Accuracy and calibration of commercial oligonucleotide
and custom cDNA microarrays,”Nucleic Acids Research, vol. 30,
Submit your manuscripts at
http://www.hindawi.com
Hindawi Publishing Corporation
http://www.hindawi.com Volume 2014
Anatomy
Research International
Peptides
Hindawi Publishing Corporation
http://www.hindawi.com Volume 2014
Hindawi Publishing Corporation http://www.hindawi.com
International Journal of
Volume 2014
Zoology
Hindawi Publishing Corporation
http://www.hindawi.com Volume 2014 Molecular Biology International
Hindawi Publishing Corporation
http://www.hindawi.com Volume 2014
The Scientific
World Journal
Hindawi Publishing Corporationhttp://www.hindawi.com Volume 2014
Hindawi Publishing Corporation
http://www.hindawi.com Volume 2014
Bioinformatics
Advances inMarine Biology
Journal ofHindawi Publishing Corporation
http://www.hindawi.com Volume 2014 Hindawi Publishing Corporation
http://www.hindawi.com Volume 2014
Signal Transduction
Journal of Hindawi Publishing Corporationhttp://www.hindawi.com Volume 2014
BioMed
Research International
Evolutionary Biology International Journal of
Hindawi Publishing Corporation
http://www.hindawi.com Volume 2014
Hindawi Publishing Corporation
http://www.hindawi.com Volume 2014
Biochemistry Research International
Archaea
Hindawi Publishing Corporationhttp://www.hindawi.com Volume 2014
Hindawi Publishing Corporation
http://www.hindawi.com Volume 2014
Genetics
Research International
Hindawi Publishing Corporation
http://www.hindawi.com Volume 2014
Advances in
Virology
Hindawi Publishing Corporation http://www.hindawi.com
Nucleic Acids
Journal ofVolume 2014
Stem Cells
International
Hindawi Publishing Corporationhttp://www.hindawi.com Volume 2014
Hindawi Publishing Corporation
http://www.hindawi.com Volume 2014
Enzyme
Research
Hindawi Publishing Corporation
http://www.hindawi.com Volume 2014