https://www.scirp.org/journal/fns ISSN Online: 2157-9458
ISSN Print: 2157-944X
DOI: 10.4236/fns.2019.1012100 Dec. 17, 2019 1400 Food and Nutrition Sciences
Optimization of a Tiger Nut-Based Yoghurt
Formulation by Response Surface Methodology
Bou Ndiaye
1,2, Mama Sakho
1,2, Nicolas Cyrille Ayessou
1,2, Omar Ibn Khatab Cisse
1,2,
Mady Cisse
1,2, Codou Mar Diop
1,21Laboratory of Electrochemistry and Membrane Processes, Polytechnic High School of Dakar, Cheikh Anta Diop
University, Dakar, Sénégal
2Center for Studies on Food Safety and Functional Molecules (CESAM-RESCIF), Dakar, Sénégal
Abstract
Tiger nut is a comestible tuber which offers many under products such as yoghurt. The parameters influencing the quality of yoghurt being numerous, response surface methodology was used to optimize the formulation in order to reach a low intake of milk powder. The volume of tiger nut milk, mass milk powder and sugar mass are the factors monitored while the titratable acidity (AT), pH, dry soluble extract (ESS), ash, viscosity and color are the expected responses in these tests. The data are processed with a degree of confidence p < 0.05 associated with statistical analysis by the software Statgraphic Centurion XVI version 16.2.04. The different tests show that the factors have overall significant effects (p < 0.05) on the acidity, the ashes and the Whiteness index. The linear and quadratic factors of tiger nuts milk as well as those linears of the milk powder have significant effects (p < 0.05) on the pH and the ashes. The linear factors of milk powder have significant effects on DSE, AT and pH. The optimal formulation yielded a volume of ti-ger nut milk equal to 3.7 L/kg, a mass of powder milk of 63.4 g and 75 g of sugar for one kilogram of yogurt. With a desirability of 75%, this model is apt to explain the results and the experimental values fit with the predicted ones and are within the norms. The proximate analysis of optimal yoghurt formu-lation shows that fat and proteins contents are respectively 5.67% and 2.2%. Calcium, magnesium and potassium contents are respectively 160, 40 and 180 mg in 100 g of yoghurt.
Keywords
Optimization, Tiger Nut, Yoghurt
How to cite this paper: Ndiaye, B., Sakho, M., Ayessou, N.C., Cisse, O.I.K., Cisse, M. and Diop, C.M. (2019) Optimization of a Tiger Nut-Based Yoghurt Formulation by Response Surface Methodology. Food and Nutrition Sciences, 10, 1400-1418.
https://doi.org/10.4236/fns.2019.1012100
Received: May 13, 2019 Accepted: December 14, 2019 Published: December 17, 2019
Copyright © 2019 by author(s) and Scientific Research Publishing Inc. This work is licensed under the Creative Commons Attribution International License (CC BY 4.0).
http://creativecommons.org/licenses/by/4.0/
DOI: 10.4236/fns.2019.1012100 1401 Food and Nutrition Sciences
1. Introduction
The inadequacy of the distribution of plant resources around the world and the lack of processing of available resources in some parts of the world mean that today a large part of the world’s population still suffers from the consequences of malnutrition. The latter remains a real scourge and one of the major public health problems in the world despite the considerable progress made. It is thought to be responsible for almost 55% of all deaths among children aged from 0 to 5 years, and this proportion is higher in poor countries; particularly in Africa. Nowadays, one of the axes of research in the field of food sciences is the
development of functional foods that provide health benefits [1][2] [3]. Tiger
nut is one of the underused tubers in West Africa, which presents an interesting
amino acids profile [4] [5], displaying high levels of essential fatty acids [5],
soluble fibers, vitamins, minerals [6][7] and phytochemicals such as isoflavones,
flavonoids, terpenoids, alkaloids and saponins [8][9]. The latter are known for
their biological properties. Recent studies have proved the biological effects ex-hibited by the tiger nut tubers, such as anti-diabetic, cholesterol-lowering,
hepa-toprotective, aphrodisiac [10] [11] [12] [13], antibacterial [9] and galactogenic
[14]. The diversity of tiger nuts based-products allows populations to benefit
from its properties. In fact, the development of new fermented products based on tiger nut would procure specific healthy advantages for populations, com-pared to the conventional yogurts sold in the market. For the sake of minimising the powdered milk input during the production of this tiger nut-based yogurt, this study has been performed by varying the required volume of the tiger nut milk from a constant mass (tiger nut milk concentration) and adding sugar us-ing design of experiments to optimize the process of tiger nut-based yogurt.
2. Material and Methods
2.1. Plant Material
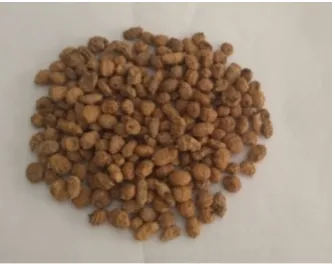
The tiger nut tubers (Cyperus esculentus) represent the basic raw material for
this present study (Figure 1). Tiger nut samples were obtained from local market.
[image:2.595.291.459.575.707.2]The samples were separated from stalks and stem and washed thoroughly under running water to remove dirt and weighed.
DOI: 10.4236/fns.2019.1012100 1402 Food and Nutrition Sciences
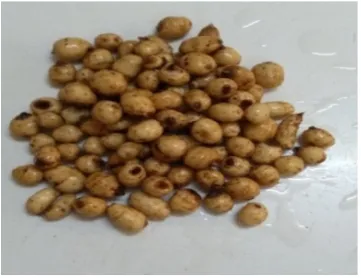
2.2. Extraction of the Tiger Nut Milk
[image:3.595.284.465.570.709.2]The tiger nut tubers and the powdered milk used in this work were bought from the local market. The tubers have been cleaned many times with tap water before being soaked in water for twelve hours. Tubers after soaking are represented in
Figure 2. Various concentrations have been set following the formulations. The milk is obtained by using a mixer of the brand Moulinex (France) at the maximum vitesse for 40 s three times, mixing the tubers with water. The blended mixture is then filtering throught a muslin cloth two times.
2.3. Preparation of the Yoghurt
The extracted tiger nut milk has been mixed with a mass of milk and sugar according to the different formulations described by the design of experiments in order to obtain a final mass of 1 kg of yogurt. The pasteurization is carried out at 75˚C during 5 minutes and then the mix is transferred into jars for fermentation at 45˚C during 4 hours in an incubator and they are removed to be cooled.
2.4. Experimental Design and Statistical Analysis
Box-Behnken design are used in this study for the conception of the design of experiments. The response surface methodology (RSM) has been applied to
optimize the factors and study the influences of the volume of tiger nut milk (X1)
(concentration), of the mass of powdered milk (X2) and the mass of sugar (X3)
on the responses. The tiger nut milk volume extracted from 1 kg of tiger nut tuber ranges from 2 liter to 5 liter, the masse of milk powder varies between 20 g and 120 g and sugar mass ranges from 50 g to 75 g. These values are taken in order to produce a firm yoghurt. The pH, titratable acidity, total soluble dry extract (SDE), viscosity, ashes content and color of the yogurt from the different formulations were evaluated as responses for the factors studied. The real levels
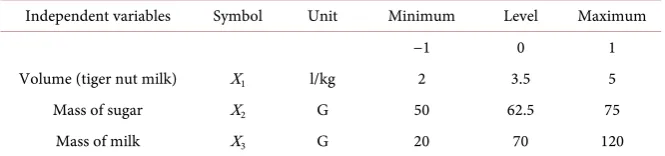
of the variables are indicated in Table 1. Statgraphic centurion XVI Version
16.2.04 (32-bits) software was used for analysis. A second order polynomial regression model was applied to express the dependent variables as a function of
the independent variables where Y is the measured response associated to each
DOI: 10.4236/fns.2019.1012100 1403 Food and Nutrition Sciences Table 1. Level and code of independent variables, volume (tiger nut milk), mass of suga-rand, mass of milk level used for Box-Behnken experimental design.
Independent variables Symbol Unit Minimum Level Maximum
−1 0 1
Volume (tiger nut milk) X1 l/kg 2 3.5 5
Mass of sugar X2 G 50 62.5 75
Mass of milk X3 G 20 70 120
Note: X1 (A), X2 (B), X3 (C), X1X2 (AB), X1X3 (AC), X2X3 (CB), X11 (AA), X22 (BB) and X33 (CC). X1, X2 and
X3 mean respectively the letter A, B and C in the response surface and PARÉTO graphic.
combination of factor levels; β0 is a constant; βi is the regression coefficient
calculated from the observed experimental values of Yi. The terms Xi, XiXj and
2
i
X represent the interaction and the quadratic terms, respectively.
Physicochemical Analysis
1) pH and titratable acidity
The samples were analysed to get pH and titratable acidity as described by
Olubamiwa et al. (2006). A pH-meter of the brand Hanna HI-98128 was utilized
to evaluate the pH of the different formulations of yogurt. The acidity has been measured by titration of 10 ml of yogurt with NaOH 0.1 N; and was expressed in equivalent gram of lactic acid/100g.
2) Viscosity and color
Yoghurt samples were gently stirred with a plastic spoon prior to viscosity measurements. The viscosity was measured at 7˚C using a Brookfield digital viscometer and is expressed in Cp. The color was measured with a colorimeter (CM-3600d, MINOLTA Co.; Japan) of the model D25A-9. The coordinates CIE Lab was obtained with the illuminating observer D65/10˚. The color parameters
such as L, a*, b*, c* and h* were given by the colorimeter directely and are used
to calculate the whiteness index (WI) and total color (TC) according to [15] and
[16],
(
)
2 2 2WI=100− 100−L +a∗ +b∗ (1)
2 2 2
TC= L +a∗ +b∗ (2)
3) Physicochemical properties analysis
The ash content was determined according the [17] method. Two grams of the
sample flours were weighed into the crucible and the weight taken. The crucible containing the samples were placed into the muffle furnace and ignited at 550˚C. This temperature was maintained for three hours. The dry soluble extract was determined by using refractometer (ATAGO B024889 JAPON). Fat was determined in the soxhlet apparatus (AOAC, 1990) using hexane as the solvent of extraction. The Kjeldahl procedure based on the AOAC (1990) method was used for the protein content determination.
4) Resultats and discussion
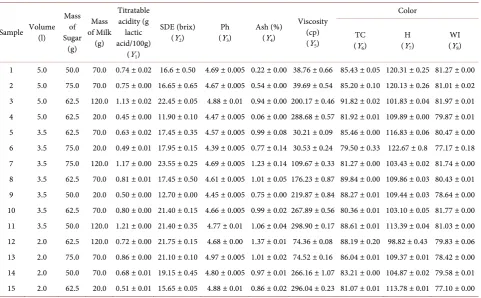
DOI: 10.4236/fns.2019.1012100 1404 Food and Nutrition Sciences Table 2. The experimental design and obtained values of the responses.
Sample Volume (l) Mass of Sugar (g) Mass of Milk (g) Titratable acidity (g lactic acid/100g)
(Y1)
SDE (brix) (Y2)
Ph (Y3)
Ash (%) (Y4)
Viscosity (cp) (Y5)
Color
TC (Y6)
H (Y7)
WI (Y8)
1 5.0 50.0 70.0 0.74 ± 0.02 16.6 ± 0.50 4.69 ± 0.005 0.22 ± 0.00 38.76 ± 0.66 85.43 ± 0.05 120.31 ± 0.25 81.27 ± 0.00 2 5.0 75.0 70.0 0.75 ± 0.00 16.65 ± 0.65 4.67 ± 0.005 0.54 ± 0.00 39.69 ± 0.54 85.20 ± 0.10 120.13 ± 0.26 81.01 ± 0.02 3 5.0 62.5 120.0 1.13 ± 0.02 22.45 ± 0.05 4.88 ± 0.01 0.94 ± 0.00 200.17 ± 0.46 91.82 ± 0.02 101.83 ± 0.04 81.97 ± 0.01 4 5.0 62.5 20.0 0.45 ± 0.00 11.90 ± 0.10 4.47 ± 0.005 0.06 ± 0.00 288.68 ± 0.57 81.92 ± 0.01 109.89 ± 0.00 79.87 ± 0.01 5 3.5 62.5 70.0 0.63 ± 0.02 17.45 ± 0.35 4.57 ± 0.005 0.99 ± 0.08 30.21 ± 0.09 85.46 ± 0.00 116.83 ± 0.06 80.47 ± 0.00 6 3.5 75.0 20.0 0.49 ± 0.01 17.95 ± 0.15 4.39 ± 0.005 0.77 ± 0.14 30.53 ± 0.24 79.50 ± 0.33 122.67 ± 0.8 77.17 ± 0.18 7 3.5 75.0 120.0 1.17 ± 0.00 23.55 ± 0.25 4.69 ± 0.005 1.23 ± 0.14 109.67 ± 0.33 81.27 ± 0.00 103.43 ± 0.02 81.74 ± 0.00 8 3.5 62.5 70.0 0.81 ± 0.01 17.45 ± 0.50 4.61 ± 0.005 1.01 ± 0.05 176.23 ± 0.87 89.84 ± 0.00 109.86 ± 0.03 80.43 ± 0.01 9 3.5 50.0 20.0 0.50 ± 0.00 12.70 ± 0.00 4.45 ± 0.005 0.75 ± 0.00 219.87 ± 0.84 88.27 ± 0.01 109.44 ± 0.03 78.64 ± 0.00 10 3.5 62.5 70.0 0.80 ± 0.00 21.40 ± 0.15 4.66 ± 0.005 0.99 ± 0.02 267.89 ± 0.56 80.36 ± 0.01 103.10 ± 0.05 81.77 ± 0.00 11 3.5 50.0 120.0 1.21 ± 0.00 21.40 ± 0.35 4.77 ± 0.01 1.06 ± 0.04 298.90 ± 0.17 88.61 ± 0.01 113.39 ± 0.04 81.03 ± 0.00 12 2.0 62.5 120.0 0.72 ± 0.00 21.75 ± 0.15 4.68 ± 0.00 1.37 ± 0.01 74.36 ± 0.08 88.19 ± 0.20 98.82 ± 0.43 79.83 ± 0.06 13 2.0 75.0 70.0 0.86 ± 0.00 21.10 ± 0.10 4.97 ± 0.005 1.01 ± 0.02 74.52 ± 0.16 86.04 ± 0.01 109.37 ± 0.01 78.42 ± 0.00 14 2.0 50.0 70.0 0.68 ± 0.01 19.15 ± 0.45 4.80 ± 0.005 0.97 ± 0.01 266.16 ± 1.07 83.21 ± 0.00 104.87 ± 0.02 79.58 ± 0.01 15 2.0 62.5 20.0 0.51 ± 0.01 15.65 ± 0.05 4.88 ± 0.01 0.86 ± 0.02 296.04 ± 0.23 81.07 ± 0.01 113.78 ± 0.01 77.10 ± 0.00 Note: Y1 (Soluble dry extracts), Y2 (titratable acidity), Y3 (pH), Y4 (ashes), Y5 (viscosity), Y6 (total color), Y7 (angle h), Y8 (whiteness index). DSE (dry soluble
extract), gram (g).
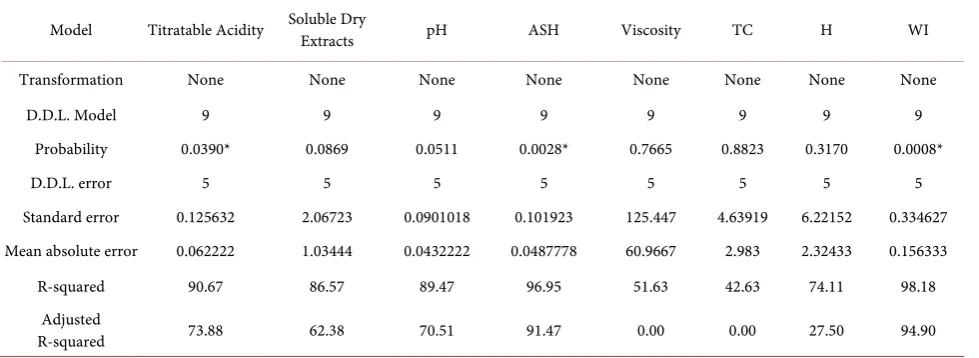
of the parameters studied. The results obtained from the ANOVA are shown in
Table 3. R2 Values range from 42.63% to 98.18% and was established in Table 3.
Responses on witch factor have global significant effects (linear, interaction, or
quadratic) are marked (*) (Table 3). The p-values below 0.05 indicate that the
quadratic model of the yoghurt formulation is statistically significant at a 95% confidence interval. Titratable acidity, soluble dry extract, pH, ash, viscosity,
total color, hue, and whiteness index are described respectively by Y1, Y2, Y3, Y4,
Y5, Y6, Y7 and Y8 which are regression equation predicting the relationship
between the factors (Table 4).
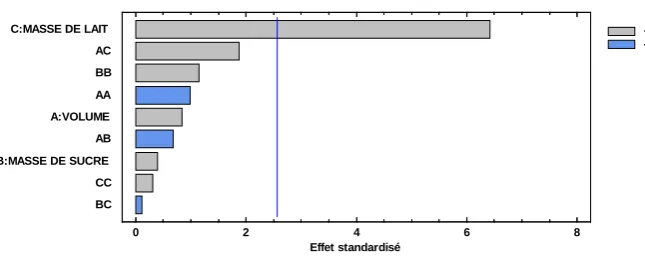
5) Titratable acidity
Titratable acidity is a very important factor in the characterization and acceptability of fermented dairy products. The variance analysis of the regression
models gives a R2 value of 90.67%. The titratable acidity varies from 0.45% to
1.21%. Response surface plot of the relationship is shown as Figure 3. The effect
of independent variables is represented in Figure 4. The high value is found in
DOI: 10.4236/fns.2019.1012100 1405 Food and Nutrition Sciences Table 3. ANOVA for the experimental variables.
Model Titratable Acidity Soluble Dry Extracts pH ASH Viscosity TC H WI
Transformation None None None None None None None None
D.D.L. Model 9 9 9 9 9 9 9 9
Probability 0.0390* 0.0869 0.0511 0.0028* 0.7665 0.8823 0.3170 0.0008*
D.D.L. error 5 5 5 5 5 5 5 5
Standard error 0.125632 2.06723 0.0901018 0.101923 125.447 4.63919 6.22152 0.334627
Mean absolute error 0.062222 1.03444 0.0432222 0.0487778 60.9667 2.983 2.32433 0.156333
R-squared 90.67 86.57 89.47 96.95 51.63 42.63 74.11 98.18
Adjusted
R-squared 73.88 62.38 70.51 91.47 0.00 0.00 27.50 94.90
*Significant at 0.05.
Table 4. Equation of regression of response.
Y1
2 2
1 1 2 3 1 2
2
3 1 2 1 3 2 3
1.58198 0.257926 0.05016 0.000177 0.028704 0.000483 0.000008 0.002267 0.00156667 0.000012
= + − − − +
+ − + −
Y X X X X X
X X X X X X X (3)
Y2
2
2 1 2 3 1 1 2
2 2
1 3 2 2 3 3
16.6632 2.67398 0.318867 0.085675 0.500926 0.0253333 0.0268333 0.00470667 0.00124 0.000240833
= + − + − −
+ + − −
Y X X X X X X
X X X X X X (4)
Y3
2 2
3 1 2 3 1 2
2
3 1 2 1 3 2 3
5.54418 0.536037 0.00286 0.00192833 0.0714815 0.000053 0.000019 0.002533 0.00203 0.000008
= − + − + +
− − + −
Y X X X X X
X X X X X X X (5)
Y4
2
4 1 2 3 1 1 2
2 2
1 3 2 2 3 3
0.878881 0.186537 0.0549 0.00486 0.101481 0.00373333 0.001233 0.000533 0.00006 0.000016
= − + + − − +
+ − + +
Y X X X X X X
X X X X X X (6)
Y5
2
5 1 2 3 1 1 2
2 2
1 3 2 2 3 3
66.0527 198.462 26.6765 5.203 0.723889 2.5676 0.4439 0.330872 0.000044 0.0233325
= − + − − +
+ − + +
Y X X X X X X
X X X X X X (7)
Y6
2
6 1 2 3 1 1 2
2 2
1 3 2 2 3 3
60.0084 1.218 0.815993 0.00922833 0.115 0.0354667 0.00926667 0.006904 0.000572 0.0000795
= + + − + −
+ − + −
Y X X X X X X
X X X X X X (8)
Y7
2 2
7 1 2 3 1 2
2
3 1 2 1 3 2 3
167.815 8.15278 3.01338 0.551525 0.536111 0.031656 – 0.0010575 0.0624 0.023 0.009276
= + − + − +
− + −
Y X X X X X
X X X X X X X (9)
Y8
2 2
8 1 2 3 1 2
2
3 1 2 1 3 2 3
74.6532 0.2445 0.11616 0.005905 0.011667 0.002072 0.000281 0.012 0.0021 0.001272
= + + − − −
− + − +
Y X X X X X
X X X X X X X (10)
*Co-efficient are significant (p < 0.05).
fermentation and therefore in the production of lactic acid and acidic compounds. As such, it plays a key role in the acidity of yogurts. The lactose contained milk is an ideal substrate for yogurt cultures. These microorganisms use milk lactose to release more lactic acid, which leads to the influence of milk
on acidity. Similar results were found by [18], it was found that the addition of
[image:6.595.61.539.303.586.2]DOI: 10.4236/fns.2019.1012100 1406 Food and Nutrition Sciences Figure 3. Titratable acidity response surface.
Figure 4. Pareto graph of the effects on titratable acidity.
influence the shelf life. However, given the fiber content of the tiger nut milk, it has been reported that the hydrolysis of these compound during the fermentation could increase glucose and maltose levels, which are converted into organic acids or alcohols by microbial activity and which directly influences the acidity of the
environment [19]. On the other hand, pH and acidity can be affected by several
factors such as the initial microbial load of milk, milk and handling hygiene
conditions [20] but also the amount and type of materials solid, culture activity
and fermentation period [21]. As for the volume of tiger nut milk, it has very
little influence on the lactic acid content (p > 0.05). The less the volume of tiger nut milk is concentrated, the lower the lactic acid content, because the tiger nut
milk itself has a low lactic acidity of the order of 0.15% [22]. Interactions between
milk nutmeg and milk powder, and sugar interactions, are also important but not significant (p > 0.05). The co-efficient of determination predicting the mean
score for aroma explained up to 92.41% (Table 3) variability in data. The regression
Equation (3) predicting the relationship between titratable acidity and independent
variables is established in Table 4.
6) Soluble dry extract
ANOVA indicates an R2 equal to 86.58% on the variability of soluble solids
content. Its adjusted R2 is 62.38%. The various yogurt samples have dry soluble
extract contents ranging between 11.90% to 23.55%. However, the milk powder
Graphique de Pareto standardisé pour ACIDITE TITRABLE
0 2 4 6 8
Effet standardisé BC
CC B:MASSE DE SUCRE AB A:VOLUME AA BB AC
C:MASSE DE LAIT +
-DOI: 10.4236/fns.2019.1012100 1407 Food and Nutrition Sciences
mass remains the only factor with a significant (p < 0.05) positive influence on the dry soluble extract content. Nevertheless, the linear factor of the sugar mass and the interaction between the volume and the mass of powdered milk and the concentration of the tiger nut milk have less significant (p > 005) but positive
effects. A visual illustration of the relationship is shown in Figure 5 and its
mathematical relationship expressed in Equation (4) is established in Table 4.
The high value of soluble dry extract is found in formulation (3.5 l; 75 g; 120 g) and the lowest value in formulation (5 l; 62.5 g; 20 g). The higher the milk powder mass, the higher the soluble solids content. Tiger nut milk dry soluble extract would be important the more the volume is important because of the insolubility of certain compounds. If the milk is highly concentrated, it cannot extract the maximum of soluble compounds and the process can increase the
amount of insoluble compounds [18]. From the foregoing, it is apparent that the
amount of dry soluble extract of a sample is correlated with the quantities of
milk powder, sugar and the concentration of milk (Figure 6). These results
[image:8.595.211.538.388.527.2] [image:8.595.208.534.578.707.2]would be due to as much to the milk used to bacteriological activities. The milk used during the formulation is instant milk powder, thus containing a high content of soluble solids. As for lactic acid bacteria, the lactic acid they produce during fermentation is an organic acid that preserves and concentrates the dry matter of milk.
Figure 5. Soluble dry extract response surface plot.
Figure 6. Pareto graph of the effects on soluble dry extract.
Graphique de Pareto standardisé pour EXTRAIT SEC SOLUBLE
0 1 2 3 4 5
Effet standardisé AB
CC BB BC AA A:VOLUME B:MASSE DE SUCRE AC
C:MASSE DE LAIT +
-DOI: 10.4236/fns.2019.1012100 1408 Food and Nutrition Sciences
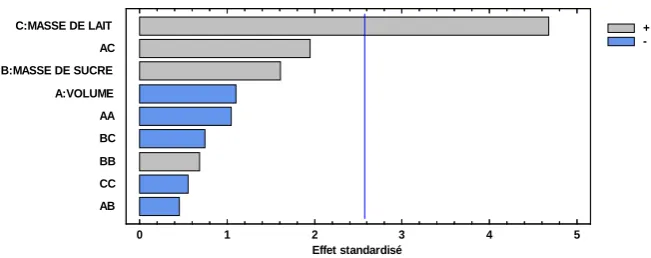
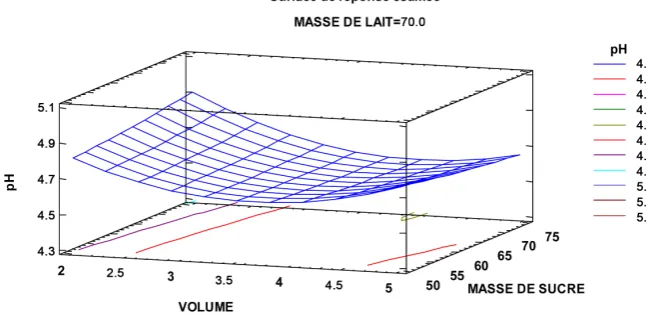
7) pH
Using a multiple regression analysis of the experimental results, the pH is
obtained by the second-order polynomial Equation (5) (Table 4) which
describes the interaction between the three independents factors. The analysis of
variance of the coefficient of determination R2 indicates that the model accounts
for 89.47% of the pH variability. The adjusted R-squared is 70.51%. A visual
illustration of pH relationship with idependent wariables is shown in Figure 7
and its mathematical relationship expressed in Equation (5) is established in
Table 4. The effects of the quadratic factors of the concentration of the tiger nut milk and the interaction factors of the concentration of the tiger nut milk and the milk powder mass positively and significantly (p < 0.05) affect the yogurt pH (Figure 8). The effect of the sugar mass was not significant (P > 0.05) on the pH
value (Figure 8). The pH of the various tiger nut yogurts varies from 4.39 to
4.97. The highest value was recorded in formulation (2 l; 75 g; 70 g) while the formulation (3.5 l; 75 g; 20 g) had the lowest pH. The tiger nut milk is very little acid but during fermentable combined with milk powder, the production of lactic acid intensifies, the medium acidifies where the pH drop to values around
[image:9.595.209.533.363.522.2] [image:9.595.209.537.484.698.2]4. These results are on the other hand below those of [23], for yoghurt based on
Figure 7. pH response surface.
Figure 8. Pareto graph of the effects on the pH.
Graphique de Pareto standardisé pour pH
0 1 2 3 4
Effet standardisé B:MASSE DE SUCRE
BC BB CC AB A:VOLUME C:MASSE DE LAIT AC
AA +
-DOI: 10.4236/fns.2019.1012100 1409 Food and Nutrition Sciences
pure yellow tiger nut with a pH equal to 6.10, yoghurt mixed yam and soybean for a pH 6.32 and yoghurt mixed soya and coconut of pH 6.58. These reported pH values are dependent on tiger nut milk which has a pH of plus or minus 6.6
[22]. The pH is an essential factor for dairy products such as yoghurt; it plays a large
role in consumer acceptance of the product and good microbiological quality. A non-standard pH would result in a finished product unfit for consumption. The values reported during this experiment are therefore acceptable and thus demonstrate compliance with the various manufacturing steps: pasteurization, incubation time and sufficient lactic ferments, to reach the appropriate pH.
8) Ash
Analysis of variance (ANOVA) of the R2 indicates that the model accounts for
96.95% (Table 3) of the ash rate variability. The results of analysis carried out,
reveal that the total ash content of yoghurt ranges from 0.06% to 1.37%. The highest value of 1.37% was found in formulation (3.5 l; 75 g; 120 g) while the
lowest value was found in formulation (5 l; 62.5 g; 20 g) (Table 2). These values
are moderately higher than those found by [24] Chukwuma et al. (2016), for
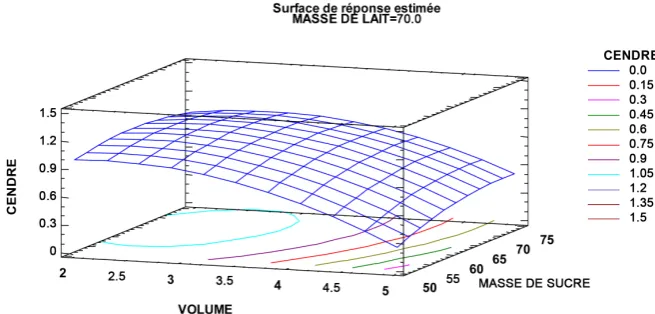
yoghurts made from pure sapling (0.43%), coconut (0.36%), cow’s milk (0.73%) and coconut mix and tiger nut (0.68%). The interaction of the variables of the formulation is described in the following three-dimensional response surface (Figure 9) and the mathematical function (Equation (6)) was the best to describe
the relationship between the ashes and the factors and (Table 4). The results
show that milk mass (p < 0.05), volume (p < 0.05) and the effect of quadratic
factors of volume (p < 0.05) are significant variables (Figure 10). The effect of
the sugar mass is not significant (p > 0.05) (Figure 10) on the ash content. The
[image:10.595.207.535.546.703.2]ash rate could be important when the tiger nut is concentrated in addition to the milk supply. Factors with a significant influence (p < 0.05) on the ash content of the samples are the volume of tiger nut milk, which has a negative impact, inversely proportional to the ash content, as well as its interactions and milk powder mass, which has a positive impact. It has been found that the mass of ash increases with the elevation of the mass of milk.
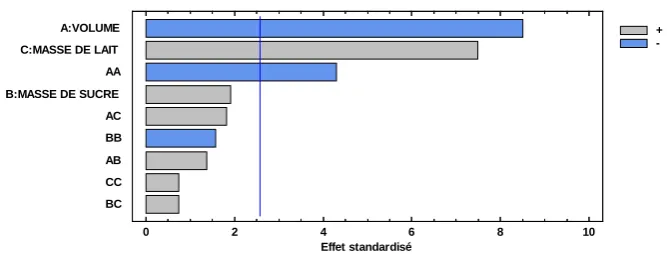
DOI: 10.4236/fns.2019.1012100 1410 Food and Nutrition Sciences Figure 10. Pareto graph of the effects on the ash content.
9) Viscosity
The R2 statistic analysis indicates that the model explains 51.6314% of the
variability of the viscosity. Values reported for viscosity range from 296.04 to 30.21 Cp. A visual illustration of the relationship between the viscosity and
independent variables is shown in Figure 11 and its mathematical relationship
expressed in Equation (7) is established in Table 4. These are influenced mainly
by the sugar mass and milk powder interactions, although not significant (p >
0.05) (Figure 12). The mass of sugar has a negative influence on the viscosity of
yogurts. The more it increases and the less yoghurt is viscous. Indeed, lactic acid bacteria proliferate at 45˚C and metabolize sugars to acids. This increased acidity causes denaturation of the proteins and forms a gel resulting from the viscous nature characteristic of yogurts. However, a high sugar intake in yogurt would contribute to the proliferation of acidic compounds and thus to a drop in viscosity. The low protein yogurts tend to have low viscosity because of the low water retention capacity of coagulum. These variations in viscosity could be explained by the protein rearrangements that take place where the protein-protein interactions are favored by the low energy bonds, which would lead to an
increase in viscosity [25]. As a result, the gel network is even more important
that the proportion of protein in yogurt is important. Also, the degradation of lactose into lactic acid leads to a drop in pH then gelling the medium with
irreversible changes [26]. Similarly, proteolysis of caseins is induced during
technological processes by the addition of lactic acid bacteria producing their proteases. This phenomenon brings about changes in the viscosity of the product and in the consistency with the production of amino acids and peptides. However, for some tests, huge differences in values could be observed. These differences could be attributed not only to the imprecise amounts of ferments incorporated during production. Similarly, during heat treatments, a complex between casein and protein is formed, but the degree of formation of this complex depends on the temperature and the treatment time, as well as the
amount of whey protein present in the whey protein milk [27]. The formation of
this complex has an influence on the hydrophilic and hydration properties of the casein micelle and therefore on the rheological properties of yoghurt, in
Graphique de Pareto standardisé pour CENDRE
0 2 4 6 8 10
Effet standardisé BC
CC AB BB AC B:MASSE DE SUCRE AA C:MASSE DE LAIT
A:VOLUME +
-DOI: 10.4236/fns.2019.1012100 1411 Food and Nutrition Sciences Figure 11. Viscosity response surface.
Figure 12. Pareto graph for the viscosity.
particular its viscosity. 10) Color parameters
In food science, color is one of the main assets of a product that can lead to
the purchase by the consumer [28]. It is an important parameter in the making
and sometimes tracking of certain products. It can be used as a quality control parameter during storage and its degradation can be attributed to possible reactions. Indeed, different sub-parameters fall into the measure of the color
such as the h angle, the chromacy c and the variables a* (green to red), b* (blue
to yellow), L* or clarity (black to white) which make it possible to calculate the
total color TC and the whiteness index WI. 11) Total color
The analysis results give total color values ranging from 79.5 to 91, 82. These observed variations can be attributed to different opacity levels, related to the level of aggregation of particles. The high value is found in formulation (3.5 l; 50 g; 120 g) and the lowest value in formulation (3.5 l; 75 g; 20 g). The co-efficient of determination predicting the mean score for total color explained up to
42.63% (Table 3) variability in data. The regression Equation (8) predicting the
relationship between total color and process variables is established in Table 4
DOI: 10.4236/fns.2019.1012100 1412 Food and Nutrition Sciences Figure 13. Surface response for the total color.
values, the higher the opacity, the lower the chromium, which also corresponds to a higher brightness index. No factors had a significant influence on the total
yoghurt color (p > 0.05) (Table 3). However, the total color of the samples
predominate when the mass of milk powder increases and the tiger nut dilution (Figure 14). The results of analysis obtained are in agreement with those of [29], who studied color change as affected by the addition of casein. The addition of proteins significantly affected the yoghurt color. As a result, high milk powder content would mean high milk protein content and thus better protein coagulation. Protein coagulation affects the structure and surface properties of
yoghurt and improves the absorption of light [30].
12) Hue tint angle
Statistical analysis of the coefficient of determination R2 indicates that the
model accounts for 74.11% of the variability of Hue. The adjusted R2 is 27.50%.
The regression Equation (9) predicted the relationship between Hue value and
independent variables is established in Table 4. H value increase with increasing
the tiger volume obtain for on kilogram of tuber and decrease with the milk
mass (Figure 15). No factor has a significant effect (Figure 16). However, the
effects of the linear and interaction factors are much more pronounced (p < 0.05) on the H-hue angle but negative. On the other hand, the linear factor of the tiger nut volume and the quadratic factor of the sugar mass have insignificant influence but positive effects on the hue angle.
13) Whiteness index (WI)
The whiteness index (WI), which measures the overall whiteness of the food
product or its deviation from the white color, ranges from 77.10 to 81.97 (Table
2). Variance analysis of the coefficient of determination R2 indicates that the
model explains 98.18% of the variability of WI however the adjusted R2 is 94.90%. The regression Equation (10) predicting the relationship between
whiteness and process variables is established in Table 4 and the interaction of
the variables of the formulation is described by the three-dimensional response
DOI: 10.4236/fns.2019.1012100 1413 Food and Nutrition Sciences Figure 14. Pareto graph for the total color.
Figure 15. Hue angle response surface.
Figure 16. Pareto graph for the hue angle.
62.5 g and 120 g) and the low respectively for tiger nut volume, sugar mass and milk mass. The linear factors of milk mass (p < 0.001), and of tiger nut milk volume (concentration) (p < 0.0001) are the most factors witch have the most significant effect, the interactive factor of sugar and milk masses (p < 0.05) and the quadratic factor of the milk mass have significant influences on the whiteness
index of yogurts (Figure 18). The increase in volume (concentration) causes a
DOI: 10.4236/fns.2019.1012100 1414 Food and Nutrition Sciences Figure 17. WI response surface.
Figure 18. Pareto graph of the index WI.
to brightness L. A high value of L in the case of yogurt is a good quality factor
however a drop in L can be attributed to color degradation [31] and can be
encouraged by the oil content. The variations in the whiteness index of yogurts are due to the physico-chemical properties of the various components and the pretreatment carried out during production, in particular pasteurization which could cause the gelatinization of the starch contained in the tiger nut milk but also non-enzymatic browning reactions and thus interactions between sugar
reducing sugars and milk proteins. It has been found that all values of a* are
negative thus revealing the presence of green compounds in yoghurt if it is known that tiger nut contains family B vitamins and certain phytochemicals.
These findings were made by [32] and attributed these negative values by the
presence of tryptophan, tyrosine and riboflavin. 14) Optimization
Multi-response optimization of RSM was applied to determine the optimal combination in yoghurt preparation. The optimum formulation predicted by the regression model is the follows: for tiger nut milk volume (3.77 l), for milk mass (63.84 g) and 75 g for sugar mass. These conditions were tested and compared to the predicted optimal response. Yoghurt optimal sample were prepared using the derived optimum formulation conditions to check the validity of surface
Graphique de Pareto standardisé pour WI
0 2 4 6 8 10 12
Effet standardisé AA
AC B:MASSE DE SUCRE AB BB CC BC A:VOLUME
C:MASSE DE LAIT +
-DOI: 10.4236/fns.2019.1012100 1415 Food and Nutrition Sciences Table 5. Optimal values of process variables.
Factors Optimal value Responses Desirability Prevision Experimental measures Inferior limit at 95.0%
Superior limit at
95.0%
Titrable
acidity 1 0.80 0.66 ± 0.06 0.596 1.004
Volume
(liter) 3.77 dry extract Soluble 0.739 20.03 18 ± 0.1 16.66 23.39
pH 0.625 4.59 4.5 ± 0.004 4.44 4.74
Ash 0.662 0.89 1.25 0.726 1.06
Mass of powdered
milk (g) 63.84 WI 0.623 79.93 75.24 ± 0.003 79.38 80.47
H 0.766 117.37 115. 27 ± 0.145 107.26 127.49 Mass of sugar 75.0 CT 0.746 82.63 80.41 ± 0.19 75.08 90.17
(g) Viscosity 0.886 43.17 36.4 −160.87 247.23
Table 6. Proximate analysis of optimal yoghurt.
Parameter (/100g) Content
Proteins % 2.2
Fat % 5.67
Calcium (mg) 160
Magnesium (mg) 20
Potassium (mg) 180
response model. The experimental data were compared with predicted values in
order to verify adequacy of final reduced flour (Table 5). The overall desirability
is 75% and this shows that is fit to explain this study. The results of the proximate
composition of the tiger nut yoghurt are presented in Table 6. Protein and fat
content are respectively 2.5% and 5.67%. Calcium, magnesium and potassium content are respectively are 160 mg, 40 mg and 180 mg in 100 g of the optimal yoghurt.
3. Conclusion
[image:16.595.208.537.343.437.2]DOI: 10.4236/fns.2019.1012100 1416 Food and Nutrition Sciences
conditions of optimized product use. Finally, the production, utilization, and consumption of tigernut-based yoghurt should be encouraged because such product will be helpful in providing nutritious, safe and wholesome food for the poor and malnourished populations in developing country.
Conflicts of Interest
The authors declare no conflicts of interest regarding the publication of this pa-per.
References
[1] Yilmaz-Ersan, L. and Kurdal, E. (2014) The Production of Set-Type-Bio-Yoghurt with Commercial Probiotic Culture. International Journal of Chemical Engineering
and Applications, 5, 402‑408. https://doi.org/10.7763/IJCEA.2014.V5.418
[2] Sengupta, S., Chakraborty, A. and Bhowal, J. (2014) Production and Evaluation of Yogurt with Watermelon (Citrullus lanatus) Juice. Journal of International Academic
Research for Multidisciplinary, 2, 249-257.
[3] Aboulfazli, F. and Baba, A.S. (2015) Effect of Vegetable Milk on Survival of Probiotics in Fermented Ice Cream under Gastrointestinal Conditions. Food Science and
Technology Research, 21, 391-397. https://doi.org/10.3136/fstr.21.391
[4] Oladele, A.K. and Aina, J.O. (2007) Chemical Composition and Functional Properties of Flour Produced from Two Varieties of Tigernut (Cyperus esculentus).
African Journal of Biotechnology, 6, 2473-2476.
https://doi.org/10.5897/AJB2007.000-2391
[5] Shaker, M.A., Ahmed , M.G., Amany, M.B. and Shereen, L.N. (2009) Chufa Tubers
(Cyperus esculentus L.): As a New Source of Food. World Applied Sciences Journal,
7, 151-156.
[6] Emurotu, J.E. (2017) Comparison of the Nutritive Value of the Yellow and Brown Varieties of Tiger Nut. IOSR Journal of Applied Chemistry, 10, 29-32.
[7] Ndiaye, B., Cissé, O.B.K., Ayessou, N., Baldé, S., Cissé, M., Diop, C.M., et al. (2018) Potentialités technologiques par l’évaluation biochimique de la farine des tu-bercules du souchet Cyperus esculentus L. Afrique Science, 14, 209-214.
[8] Imam, T., Aliyu, F. and Umar, H. (2013) Preliminary Phytochemical Screening, Elemental and Proximate Composition of Two Varieties of Cyperus esculentus
(Tiger Nut). Nigerian Journal of Basic and Applied Sciences, 21, 247-251.
https://doi.org/10.4314/njbas.v21i4.1
[9] Prakash, N. and Ragavan, B. (2009) Phytochemical Observation and Antibacterial Activity of Cyperus esculentus L. Ancient Science of Life, 28, 16-20.
[10] El-Naggar, E. (2017) Biological Effect of Tiger Nut (Cyperus esculentus L.) Oil on Healthy and Hypercholesterolemia Rats. Syrian Journal of Agricultural Research, 4, 133-147.
[11] Ebojele, F.O. and Ezenwanne, E.B. (2014) The Effect of Aqueous Extract of Cyperus
esculentus on Some Liver Functional Indices in Rabbit. International Journal of
Basic, Applied and Innovative Research IJBAIR, 3, 8-13.
[12] Allouh, M.Z., Daradka, H.M. and Ghaida, J.H.A. (2015) Influence of Cyperus
esculentus Tubers (Tiger Nut) on Male Rat Copulatory Behavior. BMC Complementary
and Alternative Medicine, 15, 1-7. https://doi.org/10.1186/s12906-015-0851-9
DOI: 10.4236/fns.2019.1012100 1417 Food and Nutrition Sciences of Hydro-Methanolic Extract of Tiger Nut (Cyperus esculentus l.) on Pentylenete- Trazole Induced Seizures in Mice. Nature and Science, 14, 57-62.
[14] Ndiaye, B., Ayessou, N.C., Balde, S.R.W., Mady, C., Diop, C.M., et al. (2018) Propriétés galactogènes des tubercules de souchet Cyperus esculentus. International
Journal of Innovation and Scientific Research, 39, 1-6.
[15] AFNOR French Association of Normalization (2011) Colorimetry Part 4: Chromatic Space L*a*b CIE 1976. Paris, 8.
[16] Bernat, N., Cháfer, M., Chiralt, A. and González-Martínez, C. (2015) Development of a Non-Dairy Probiotic Fermented Product Based on Almond Milk and Inulin.
Food Science and Technology International, 21, 440-453.
https://doi.org/10.1177/1082013214543705
[17] AOAC (Prénom) (1990) Official Method of Analysis Association of Official Analytical Chemists. AOAC International Publisher, Gaithersburg.
[18] Kizzie-Hayford, N., Jaros, D., Zahn, S. and Rohm, H. (2016) Effects of Protein Enrichment on the Microbiological, Physicochemical and Sensory Properties of Fermented Tiger Nut Milk. LWT, 74, 319-324.
https://doi.org/10.1016/j.lwt.2016.07.067
[19] Granito, M. and Alvarez, G. (2006) Lactic Acid Fermentation of Black Beans
(Phaseolus vulgaris): Microbiological and Chemical Characterization. Journal of the
Science of Food and Agriculture, 86, 1164-1171. https://doi.org/10.1002/jsfa.2490
[20] Schuck, P., Mahaut, M., Jeantet, R. and Brulé, G. (2000) Les produits industriels laitiers. Lavoisier TEC et DOC Editions.
[21] Imbachí-Narváez, P.C., Sepúlveda-Valencia, J.U. and Rodriguez-Sandoval, E. (2017) Effect of Modified Cassava Starch on the Rheological and Quality Properties of a Dairy Beverage Prepared with Sweet Whey. Food Science and Technology, 39, 134-142. https://doi.org/10.1590/1678-457x.28017
[22] Ogbonna, A.C., Abuajah, C.I. and Ukeme, E.A. (2013) Quality Comparison of Flavoured and Non-Flavoured Yoghurts from Animal and Vegetable Milk Sources.
Food Biology, 2, 24-28.
[23] Ajibade, D., Olusegun, F. and James, O. (2015) An Evaluation of the Nutritional Qualities of Yoghurt Prepared from Different Plant Milk Sources. African Journal of
Agriculture and Food Security, 3, 142-144.
[24] Ezeonu, C.S., Tatah, V.S., Nwokwu, C.D. and Jackson, S. (2016) Quantification of Physicochemical Components in Yoghurts from Coconut, Tiger Nut and Fresh Cow Milk. Advances in Biotechnology & Microbiology, 1, Article ID: 555573.
https://doi.org/10.19080/AIBM.2016.01.555573
[25] Abu-Jdayil, B. and Mohameed, H. (2002) Experimental and Modelling Studies of the Flow Properties of Concentrated Yogurt as Affected by the Storage Time.
Journal of Food Engineering, 52, 359-365.
https://doi.org/10.1016/S0260-8774(01)00127-3
[26] Kora, E.P. (2004) Interactions physico-chimiques et sensorielles dans le yaourt brassé aromatisé: Quels impacts respectifs sur la perception de la texture et de la flaveur? PhD Thesis, INAPG (AgroParisTech).
[27] Corredig, M. and Dalgleish, D.G. (1999) The Mechanisms of the Heat-Induced Interaction of Whey Proteins with Casein Micelles in Milk. International Dairy
Journal, 9, 233-236. https://doi.org/10.1016/S0958-6946(99)00066-7
DOI: 10.4236/fns.2019.1012100 1418 Food and Nutrition Sciences
Veteriner Fakultesi Dergisi, 23, 691-697. https://doi.org/10.9775/kvfd.2016.17298
[29] González-Martınez, C., Becerra, M., Cháfer, M., Albors, A., Carot, J. and Chiralt, A. (2002) Influence of Substituting Milk Powder for Whey Powder on Yoghurt Quality. Trends in Food Science & Technology, 13, 334-340.
https://doi.org/10.1016/S0924-2244(02)00160-7
[30] Mor-Mur, M. and Yuste, J. (2003) High Pressure Processing Applied to Cooked Sausage Manufacture: Physical Properties and Sensory Analysis. Meat Science, 65, 1187-1191. https://doi.org/10.1016/S0309-1740(03)00013-5
[31] Sengupta, S. and Bhowal, J. (2017) Optimization of Ingredient and Processing Parameter for the Production of Spirulina Platensis Incorporated Soy Yogurt Using Response Surface Methodology. Journal of Microbiology, Biotechnology and Food
Sciences, 6, 1081-1085. https://doi.org/10.15414/jmbfs.2017.6.4.1081-1085