Janine Muldoon Kate Levin
Winfried van der Sluijs Candace Currie
Child and Adolescent Health Research Unit (CAHRU) The University of Edinburgh
Validating mental well-being items of the Scottish Health
Behaviour in School-aged Children (HBSC) Survey
2
Validating mental well-being items of the Scottish Health Behaviour in
School-aged Children (HBSC) Survey
Contents
Acknowledgements 3
Executive summary 3
1. Introduction 5
1.1 Background 5
1.2 Aims & objectives 6
1.3 The questions to be validated 6
1.4 Key aspects of validation 7
2. Methodology 9
2.1 The sample 9
2.2 Stages in the research process 9
2.3 The survey and ‘think aloud’ technique 10
2.4 The focus groups 11
3. Analysis of data 13
3.1 Data entry 13
3.2 Assessing reliability 13
3.3 Assessing validity 13
3.4 Presentation of data in Results section 14
4. Results 15
4.1 Happiness 15
4.2 Confidence 21
4.3 Left out 27
4.4 Helplessness 33
4.5 Life satisfaction 40
4.6 Assessing the validity and reliability of the SDQ 43
4.7 Comparing our sample against national norms using the SDQ 43
5. Summary & discussion 44
5.1 Summary of findings 44
5.2 Discussion 45
Appendix 1: the pupil survey 47
Appendix 2: analysis of focus group material (example excerpts) 53
3
Acknowledgments
This research was funded by NHS Health Scotland as a developmental part of the national HBSC study. We also wish to thank all the pupils and teachers who helped us with this study. We are also indebted to Jo Stilwell at the Moray House School of Education for transcribing all of our focus groups and interviews and administrative staff at the Child and Adolescent Health Research Unit, for assisting the team with data entry procedures.
Executive summary
• The aim of this project was to test the face validity, construct validity (convergent and divergent) and reliability of five items in the Scottish HBSC survey to assess their suitability for measuring mental well-being of young people.
• Three items related to perceived happiness, confidence and feelings of helplessness have been used in four Scottish HBSC surveys (which have taken place every four years since 1994). Feeling left out has been included since 1998. Trend data suggests an improvement over time in these indicators of mental well-being. A measure of life satisfaction, an adapted form of the Cantril ladder (Cantril, 1965) and used within the 2002 and 2006 surveys has not been validated extensively; therefore we also included this item within the study.
• Three methods were employed in the study. First, a survey was administered to P7 pupils. At the same time, the ‘think aloud technique’ was used with one pupil per class. Finally, focus groups were carried out with 11 and 13-year-olds in P7 (last year of primary school) and S2 (second year of secondary school).
• The survey sample was selected on the basis of previous participation in the HBSC study, locality (urban/rural) and socio-economic status (area deprivation). All participating schools were located on the east coast of Scotland.
• Face validity of the first four mental well-being items was assessed through focus groups with young people in P7 and S2; two of the year groups surveyed with the HBSC instrument. Focus groups involved a number of activities designed to prompt explanations and aid our understanding of the ways in which children and young people interpret our questions.
• Reliability (or stability over time) was assessed using survey data collected from P7 pupils twice with an intervening period of four weeks.
• Construct validity was assessed through comparison of data from the Scottish HBSC items with established measures widely accepted within different academic disciplines: the Strengths and Difficulties Questionnaire (SDQ, Goodman, 1997; 2001) and the Student Life Satisfaction Scale (SLSS, Huebner, 1991).
• The happiness question showed moderate test-retest reliability while the left out and life satisfaction questions showed high test-retest reliability. Conversely, the confidence and helpless questions showed lower test-retest reliability. This may reflect a difference between measures of ‘trait’ (relatively stable characteristics) and ‘state’ (which are subject to change). A far higher percentage of scores that were initially positive remained stable after the 4 week interval, suggesting that the more positive you score on these mental well-being questions, the more stable your responses.
4
scale and associated sub-scales. However, there was a stronger relationship between the left out measure and the two SDQ sub-scales measuring peer problems and emotional symptoms. This link is logical and was further confirmed by pupil explanations in the focus groups. There was also a higher correlation between helpless and the total difficulties scale than those with happiness and confidence, explained by a higher correlation with peer problems.
• The Cantril ladder measure of life satisfaction had very good test-retest reliability and was compared with an established measure; the SLSS. However, the SLSS did not prove to be as reliable with our sample.
• Analysis of test-retest reliability suggests that caution needs to be exercised in relation to the re-coding of data (in our case, into binary variables). Happiness, feeling left out and life satisfaction, show moderate reliability in the binary form, while confidence and helplessness show lower reliability.
• Analysis of the focus group data suggests that three of the four mental well-being items performed reasonably well as measures of distinct aspects of mental well-being in young people aged 11 and 13. Strong similarities in interpretations were apparent across age groups. Helpless was far more complex and potentially problematic due to multiple interpretations and lack of familiarity with the word/concept. Due to its lower reliability and problems with face validity, it is recommended that this measure be used with caution.
• Measures of mental well-being for national use with young people are currently being developed and once constructed will provide a means of monitoring and evaluating the mental health of the Scottish population. In this respect, the HBSC study is a potentially useful resource to draw on. The validation work discussed within this report also provides a more comprehensive methodological understanding of the questions we ask young people.
• Although the items included in HBSC are single-item measures, which are often viewed as less robust than multiple-item measures of subjective well-being, the life satisfaction literature has shown single-item global measures to be reliable and perhaps even preferable, given that they leave the evaluation of importance to the person who is being evaluated.
5
1. Introduction
1.1 Background
The mental well-being of young people is affected by experiences of school and learning (Inchley, Todd, Currie, Levin, Smith & Currie, 2007), friendships and peer relations (Settertobulte & Gaspar de Matos, 2004) and family life and relationships (Levin, Todd, Inchley, Currie, Smith & Currie, 2007). Adolescence can also bring emotional problems as a result of biological and psychological changes associated with puberty (Kaltiala-Heino, Marttunen, Rantanen & Rimpela, 2003; Mendle, Turkheimer & Emery, 2007). These often occur in conjunction with external changes such as school transitions and alterations within peer and friendship networks or family structure and relationships. Parental separation and re-partnering often result in further upheavals in the home environment such as parent-child conflict, economic hardship and family disorganisation. Good emotional and physical health enables young people to deal with these challenges and eases the transition through adolescence (Petersen, Leffert, Graham, Alwin & Ding, 1997). Promoting young people’s health can therefore have long-term benefits for individuals and society.
Previous research has shown that emotional and mental health problems in childhood and adolescence are predictors of risk behaviours such as smoking (Dierker, Vesel, Sledjeski, Costello & Perinne, 2007), drinking (Verdurmen, Monshouwer, van Dorsselaer, Ter Bogt & Vollebergh, 2005), eating disorders (Beato-Fernandez, Rodriguez-Cano, Belmonte-Llario & Martinez-Delgado, 2004) and violence (Craig & Harel, 2004). Mental well-being and behavioural problems during childhood and adolescence may also persist into adulthood (Aalto-Setala, Marttunen, Tuulio-Henriksson, Poikolainen & Lonnqvist, 2002; Roza, Hofstra, van der Ende & Verhulst, 2003). Early intervention to promote mental well-being and prevent mental health problems among adolescents is therefore beneficial in the long, as well as short, term.
The Scottish Government’s National Programme for Improving Mental Health and Well-Being (Scottish Executive, 2003) focuses on the following: promotion and prevention; supporting those experiencing problems; reducing inequalities, and eliminating the stigma associated with mental ill health. One of its six priority areas is children and young people. Work is underway within Scotland to establish indicators of mental well-being for use with young people as currently there are few nationally or internationally recommended measures (Parkinson, 2009). However, a recent review commissioned by NHS Health Scotland as part of the indicators work, highlights factors that children and young people feel are important to their mental health (Shucksmith, Spratt, Philip & McNaughton, 2009).
6 1.2 Aims & objectives
The project aimed to:
• assess the validity of five items in the HBSC Scotland survey designed to measure aspects of mental well-being,
• explore how different methods can be utilised in the validation process, and
• privilege children’s interpretations and explanations in assessing the validity of our measures.
Objectives in respect of validation:
• to establish the face validity of four mental well-being items through discussion with children and young people,
• to investigate the reliability of the items (the degree to which responses remain stable over time), and
• to assess the performance of these four items and the life satisfaction measure against other validated scales designed to assess similar concepts (convergent validity) and those that represent the opposite (divergent validity).
1.3 The questions to be validated
The five items that were the focus of this validation study are presented below.
HAPPINESS:
In general, how do you feel about your life at the moment?
c I feel very happy
c I feel quite happy
c I don’t feel very happy c I’m not happy at all
CONFIDENCE:
How often do you feel confident in yourself?
c Never c Hardly ever c Sometimes
c Often
c Always
FEELING LEFT OUT:
How often do you feel left out of things?
c Never
c Hardly ever c Sometimes
c Often
7 FEELING HELPLESS:
How often do you feel helpless?
c Never c Hardly ever
c Sometimes
c Often c Always
LIFE SATISFACTION:
Please read the next question carefully
c
10 Best possible lifec
9c
8c
7c
6c
5c
4c
3c
2c
1Here is a picture of a ladder.
The top of the ladder ‘10’ is the best possible life for you and the bottom ‘0’ is the worst possible life for you.
In general, where on the ladder do you feel you stand at the moment?
Tick the circle next to the number that best describes where you stand.
c
0 Worst possible life1.4 Key aspects of validation
Reliability
Reliability demonstrates the degree to which the items are free from random error. Using test-retest reliability, we are able to assess whether the items show appropriate levels of stability over time. This technique involves the same people completing the same questionnaires at different points in time.
Validity
8 Susceptibility to bias
9
2. Methodology
2.1 The
sample
The survey was undertaken with 12 P7 classes corresponding to the youngest age group surveyed within the HBSC international study (11-year-olds). These children were attending 9 schools (5 urban and 4 rural from a range of socio-economic backgrounds), all of whom had participated in a previous national HBSC survey. The think aloud technique was used with one pupil per class visited while the remainder of the class completed the survey. This was administered twice with a 4-week intervening period in order to assess test-retest reliability. The number of pupils completing each survey across each school is presented in Table 2.1a. A total of 296 pupils completed Survey 1, while Survey 2 was completed by 281 pupils. For each of the five items of interest, between 270 and 280 responses were obtained on both surveys.
Table 2.1a: The survey sample
Girls Boys School Survey 1 Survey 2 Survey 1 Survey 2
1 22 21 23 21
2 29 27 31 29
3 9 8 15 13
4 25 24 23 23
5 11 11 17 16
6 6 6 8 8
7 15 15 11 10
8 15 15 20 20
9 9 8 7 6
Total 141 135 155 146
Single sex focus groups were undertaken with children and young people in P7 and S2 (13-year-olds) to extend our understanding of young people’s conceptions of mental well-being as well as any age-related changes. A total of 13 groups were held with P7 pupils in three schools and 7 with those in S2. The focus groups in the primary schools were an add-on to the survey and thus took place in a sub-sample of the survey schools, whereas all of the S2 focus groups were undertaken in one secondary school. The number of groups and pupils within each age group is presented in Table 2.1b. 20 focus groups were undertaken with 77 pupils in total.
Table 2.1b: The focus group sample
Girls Boys Total
Age group N groups N pupils N groups N pupils N groups N pupils
11-year-olds 6 24 7 27 13 51
13-year-olds 4 14 3 12 7 26
Total 10 38 10 39 20 77
2.2 Stages in the research process
10
teachers. Prior to visiting the schools, pupil information sheets and letters/consent forms for parents were issued with the Project Coordinator’s contact details for queries and fieldwork was carried out between March and June 2008. Within each school, one researcher administered the survey to a whole P7 class. Children were encouraged to ask questions and highlight any questions/wording they did not understand. Each query was recorded by the researcher, who also gauged children’s immediate reactions to questions by asking those who queried the meaning of a question to have a guess (i.e., ‘what do you think it means? What pops into your head when you read that question?’. This process took approximately 20 minutes.
At the same time as the survey was being administered, another researcher worked with one volunteer from the class who was asked to talk through their answers to the four mental well-being questions (using the ‘think aloud technique’). Their explanations were recorded using a digital recorder and were transcribed in full.
Finally, following administration of the survey, focus groups were held (with four pupils per group in most cases) to assess, in more depth, children’s perceptions of our questions and their definitions of the concepts encapsulated in our measures. One aspect of mental well-being (i.e., one of the four items) was covered in each group and a range of activities was employed to prompt explanations from the children. A sample of S2 pupils was also recruited to check for age differences.
2.3 The survey and ‘think aloud’ technique
A copy of the survey used is included in Appendix 1. This included background questions relating to the pupil’s age, gender and year group; the five mental well-being items used in HBSC (happiness, confidence, left out, helpless and life satisfaction), and the scales with which we were to compare our items. The Student Life Satisfaction Scale (SLSS, Huebner, 1991) and the Strengths and Difficulties Questionnaire (SDQ, Goodman, 1997; 2001) were chosen due to their widespread use and acceptability by researchers working in different academic fields.
Huebner (1994) reports a coefficient alpha of 0.82 for the SLSS, test-retest reliability across a one-to-two week period as 0.74 and expected correlations with parental estimates of children's life satisfaction and teacher perceptions of classroom behaviour problems. It is comprised of seven items with a six-point response scale ranging from ‘strongly disagree’ to ‘strongly agree’.
The SDQ is described as a ‘behavioural screening questionnaire about 3 to 16-year-olds’ (www.sdqinfo.com/b1.html). The self-report version (designed for 11-16-year-olds) includes 25 items and uses a three-point response scale (‘not true’, ‘somewhat true’ and ‘certainly true’). There are four sub-scales (each with five items) that combine to assess ‘difficulties’: emotional symptoms; conduct problems, hyperactivity/ inattention and peer relationship problems. A further sub-scale assesses prosocial behaviour (also with five items). Goodman (2001) reports satisfactory reliability of the SDQ with a coefficient alpha of 0.73 and test-retest reliability after 4 to 6 months of 0.62.
All questions involved children choosing from one of the responses by ticking the box that represented them best. Two surveys were distributed, which differed in one respect. In one questionnaire, children were asked to provide an explanation for their answers to two of the mental-wellbeing questions (happiness and feeling left out); the second questionnaire provided response boxes for the two other questions (confidence and helplessness).
11
they answered each of the four well-being questions. Pupils were always asked ‘so why did you pick that answer?’ and ‘how would you describe what that means?’ (i.e., happy, confident, left out or helpless). Where necessary, prompts were used, such as ‘why did you choose sometimes confident and not always confident?’ or ‘can you think of a time when you felt like that?’
2.4 The focus groups
Two members of the research team facilitated the focus groups; one acting as moderator while the other was responsible for a sub-set of the questions and for taking notes on the process. All focus groups with P7 pupils lasted 30 minutes, whilst those with S2 pupils lasted approximately 45 minutes. At the start of the S2 focus groups, participants were given the HBSC items to answer privately (as they had not taken part in the main survey).
In order to facilitate participation, enable all pupils to take part and protect participants’ privacy, a range of ‘activity sheets’ was designed. Each pupil was encouraged to respond to our questions on the sheets without recourse to others in the group. This was subsequently discussed by those who wanted to talk about their answers. A brainstorming activity was introduced to keep momentum going and reach those pupils who were less comfortable with written activities. Finally, vignettes were used to prompt discussion. Below, there is a brief description of each section of the focus group. These are presented in the sequence used within each group.
Identifying ‘confidence/happiness’
Pupils were asked to first identify someone they thought was a ‘happy’ or (in a separate group) ‘confident’ person. This could be a family member, a friend, a teacher or someone famous. When they had decided, they were asked to explain why they thought that person was happy or confident (i.e., how did they know?). This technique was not used for helpless and left out due to ethical concerns.
Constituents of confidence, happiness, left out, helpless (vignettes)
Two vignettes were presented to children in each group as a prompt to examine constituents of the four aspects of mental well-being. These vignettes centred on a person of the same sex feeling happy or confident (or the opposite), helpless or left out in particular situations (at school, at home, on the way home, with a group of people the same age). Pupils were asked to think about the reasons why the person might be feeling that way.
Word association
This task was usually undertaken as a brainstorming activity but pupils could write down their answers if they wished. They were asked to write down or shout out any words of feelings they think of when they hear the words ‘happy’, ‘confident’, left out’ or ‘helpless’.
Gender differences
12 Definition
Having covered a number of different ways of looking at the concept of interest, pupils were then asked to provide their own definition (like a dictionary) of the word.
Contributory factors
Once pupils were comfortable with the researchers and nearing the end of the groups, we asked them to think about the kind of things that made them (or people their age) feel happy, confident, left out or helpless.
Associated behaviours
Similarly, we then asked how people usually behave if they’re feeling happy, confident, left out or helpless and what they might do if they found themselves in that situation or wanted to prevent feeling that way.
Opposites
13
3. Analysis of data
3.1 Data
entry
Data were entered by an Administrative Assistant at the Child and Adolescent Health Research Unit. The entire dataset was subsequently checked by the research team and any corrections made. The focus groups and ‘think aloud’ interviews were transcribed by an Administrator (experienced in transcription) within the Moray House School of Education at The University of Edinburgh and then checked by the research team.
3.2 Assessing
reliability
Test-retest reliability was assessed through examination of Pearson correlations between Time 1 (Survey 1 responses) and Time 2 (Survey 2 responses) for each scale or single item measure. Acceptable test-retest reliability is dependent on the test carried out. Generally, 0.6 is used as a level of acceptability with more than 0.8 representing good reliability. However, this is dependent on the measure under examination and the length of time between occasions when measurements are taken. The longer the interval between measurements, the smaller the reliability measure is likely to be. Furthermore, single-item measures have lower reliability values than multiple-item measures (Diener & Lucas, 2000; Schimmack & Oishi, 2005) and measures of “trait” are likely to have lower test-retest validity scores than intelligence and other cognitive abilities. Canivez and Watkins (1998), for example, reported reliability of greater than 0.85 for intelligence among schoolchildren aged 9-12 years, while Roberts and DelVecchio (2000) found reliability of personality traits for the same age group to fall below 0.5. This might explain why test-retest correlations are often cited as acceptable when they fall as low as 0.4 (Andrews & Withey, 1976; Kammann & Flett, 1983; Watson, 2004). Research has also shown that reliability correlations for personality increase with age (Roberts & DelVecchio, 2000), so we might expect test-retest reliability in the current study to drop below the preferred level of 0.6 for some measures.
3.3 Assessing
validity
To assess how well our items measure aspects of mental well-being, Pearson correlations were calculated between our items and the SLSS and subscales of the SDQ. The face validity of the items was assessed through examination of children’s queries whilst completing the survey; categorisation of the children’s responses to the open-ended questions on the survey, and through a detailed analysis of the focus group and think aloud data.
14
3.4 Presentation of data in Results section
Within the Results section, each item (happy, confident, feeling left out, feeling helpless and life satisfaction) is discussed in turn and the quantitative data are considered first. Comparisons are drawn between Survey 1 and 2 responses and between our sample and the much larger sample involved in the 2006 national HBSC survey in Scotland. Gender differences are also highlighted before correlational data from the comparison of each HBSC item with the established measures (the SDQ and the SLSS). We also examine the data in binary form, to represent high versus low levels of well-being, often preferred in analysis and interpretation of results. A binary measure ‘‘has the advantage of not relying on differences in reported intensity’’ (Diener & Biswas-Diener, 2002 pp. 124).
15
4. RESULTS
4.1 Happiness
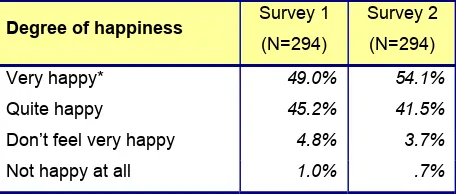
[image:15.595.86.314.194.291.2]Table 4.1a presents data on the percentage of children choosing particular responses to the question relating to happiness in Survey 1 and 2.
Table 4.1a: Responses to the happiness question: ‘In general, how do you feel about your life at the moment?’
Degree of happiness Survey 1
(N=294)
Survey 2 (N=294)
Very happy* 49.0% 54.1%
Quite happy 45.2% 41.5%
Don’t feel very happy 4.8% 3.7%
Not happy at all 1.0% .7%
* Gender difference at Survey 1
[image:15.595.94.427.438.552.2]The girls in our sample were more likely than boys to report feeling very happy at the time of Survey 1 (56% versus 43% respectively, p=.028) but there was no difference at the time of Survey 2 (59% versus 49% respectively, p=.109). Comparison of our data with those from the last national HBSC survey suggest that there were more boys in our sample that were not as happy, or were less likely to admit to feeling very happy, than would be the case in the general population of boys in Scotland (see Table 4.1b).
Table 4.1b: Comparison of our sample’s responses in Survey 1 with the findings from the national 2006 HBSC survey (happiness measure)
Girls Boys
Scale Our
sample (N=140)
HBSC 2006* (N=888)
Our sample (N=154)
HBSC 2006* (N=812)
Very happy 55.7% 58.6% 42.9% 61.1%
Quite happy 38.6% 33.2% 51.3% 34.0%
Don’t feel very happy 5.0% 6.5% 4.5% 3.7%
Not happy at all 0.7% 1.7% 1.3% 1.2%
*11-year-olds (Currie, Levin & Todd, 2008)
Test-retest reliability (survey)
16
Table 4.1c: Comparison of responses to the measure of happiness at Survey 1 & 2 Survey 2
Very happy Quite happy
Don't feel very
happy Not happy at all
How do you feel about your life at the moment?
Total
N* N % N % N % N %
Very happy 136 114 83.8 21 15.4 1 .7 0 .0
Quite happy 126 34 27.0 84 66.7 7 5.6 1 .8
Don't feel very happy 14 1 7.1 10 71.4 3 21.4 0 .0 Survey 1
Not happy at all 2 1 50.0 0 .0 0 .0 1 50.0
*Total N of cases with responses on Survey 1 and Survey 2 = 278
Construct validity (convergent/divergent)
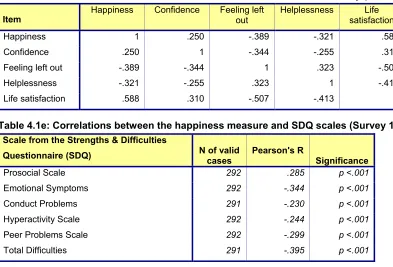
[image:16.595.87.480.369.636.2]Correlations between the five mental well-being items included in the HBSC study in Scotland are displayed in Table 4.1d. These were all significant at the 1% level and were in the expected direction. Happiness, confidence and life satisfaction were all positively related to one another and negatively related to feeling left out and helplessness. Happiness was most strongly associated with life satisfaction as measured by the Cantril Ladder (positive relationship) and feeling left out (negative relationship). In spite of this, the correlation with the Student Life Satisfaction Survey (SLSS) measure was very low (.19, p<.01). However, there appeared to be problems with the validity of this measure with our sample (see Section 4.5). Fairly low correlations were also found between the happiness measure and the SDQ Total Difficulties Scale and the various sub-scales (Table 4.1e).
Table 4.1d: Correlations between the five items included in the HBSC survey (Survey 1)
Item Happiness Confidence Feeling left out
Helplessness Life satisfaction
Happiness 1 .250 -.389 -.321 .588
Confidence .250 1 -.344 -.255 .310
Feeling left out -.389 -.344 1 .323 -.507
Helplessness -.321 -.255 .323 1 -.413
Life satisfaction .588 .310 -.507 -.413 1
Table 4.1e: Correlations between the happiness measure and SDQ scales (Survey 1)
Scale from the Strengths & Difficulties
Questionnaire (SDQ) N of valid cases Pearson's R Significance
Prosocial Scale 292 .285 p <.001
Emotional Symptoms 292 -.344 p <.001
Conduct Problems 291 -.230 p <.001
Hyperactivity Scale 292 -.244 p <.001
Peer Problems Scale 292 -.299 p <.001
Total Difficulties 291 -.395 p <.001
17
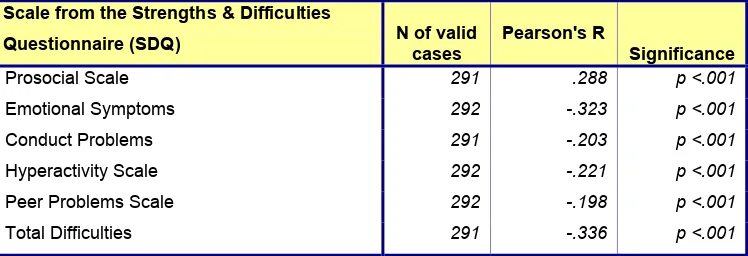
Table 4.1f: Correlations between the binary happiness measure and SDQ scales (Survey 1)
Scale from the Strengths & Difficulties
Questionnaire (SDQ) N of valid cases Pearson's R Significance
Prosocial Scale 291 .288 p <.001
Emotional Symptoms 292 -.323 p <.001
Conduct Problems 291 -.203 p <.001
Hyperactivity Scale 292 -.221 p <.001
Peer Problems Scale 292 -.198 p <.001
Total Difficulties 291 -.336 p <.001
Face validity (children’s understanding of ‘happy’)
Survey responses
There were only two queries on this question during the administration of the survey; one pupil asked if it meant how happy are you at school and the other asked if they were supposed to respond in terms of how they were feeling at the moment. Figure 4.1a and 4.1b present data on the categories generated from examination of the open-ended responses. 226 reasons were derived from the explanations given by 170 cases. The most common reasons given for feeling happy related to positive relationships either with friends or parents/family at home. 42% of the explanations included reference to these relationships. Although the absence of these positive relations was highlighted in the explanations children gave for not feeling happy (i.e., problems with peers and lack of support at home), specific negative or stressful events were most commonly referred to (in 28% of the reasons given for not feeling happy).
Figure 4.1a: Reasons for feeling happy (% of responses where child used explanation)
0
5
10
15
20
25
30
Positive friendships
Supportive home life
Enjoyment of school
Nothing wrong
Positive self
‐
perceptions
Positive events
Interests/fun
No explanation (just am)
Nice place to live
Healthy
Don't know
[image:17.595.81.467.449.657.2]18
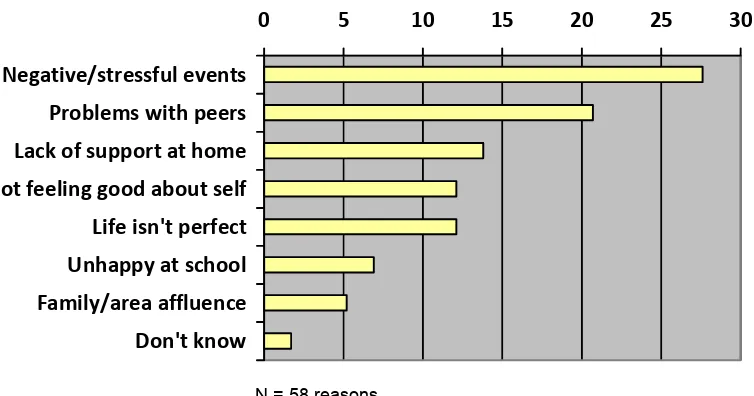
Figure 4.1b: Reasons for not feeling happy (% of responses where child used explanation)
0
5
10
15
20
25
30
Negative/stressful events
Problems with peers
Lack of support at home
Not feeling good about self
Life isn't perfect
Unhappy at school
Family/area affluence
Don't know
N = 58 reasons
Together, over 40% of the responses highlighted positive friendships and a supportive family life as important in determining happiness, supporting the positive correlation between happiness and the Prosocial Scale of the SDQ. Equally, the negative correlations with the SDQ scales assessing ‘difficulties’ (i.e., particularly emotional symptoms and peer problems) are supported by the data above in relation to some of the factors that children say make them feel unhappy (e.g., problems with peers, not feeling good about self).
Focus group/think aloud data
Identifying ‘happiness’
Children most often referred to family members or friends and explained their happiness in terms of them always smiling or laughing, being fun or funny or always in a good mood. One group of S2 girls explained that their choice of ‘happy’ person had lots of support or love from others. Two boys chose David Beckham and described his happiness in terms of things he has: money; talent, a wife and kids.
Constituents of happiness
In response to the vignette where children had to explain why the person was feeling happy in different circumstances, references were made to being with family or good friends, enjoying a subject or it being the last day of school (school context), sunny weather, seeing new born baby, being in a good mood, or something positive happening that day (won football match, got a job, won the lottery, good news). Reasons provided for the person in the vignette who was not feeling happy included having had an argument with or fallen out with someone, being bullied, a family member being ill, someone having died, being dumped and getting expelled.
Word association/contributory factors
19
keeping yourself entertained, sleeping if unhappy, thinking about things that make you laugh, not doing things that upset you, buying yourself something, getting a boyfriend, eating chocolate, watching TV or listening to music.
Definition
Definitions included words that they had used within the word association task (e.g., cheerful, joyful, good mood, laughing and smiling). However, children also used expressions such as ‘feeling good about yourself’, ‘feeling alive’, ‘when someone or something feels good’, ‘someone who has a good life’ and ‘warm glow inside’.
Associated behaviours
Behaviours associated with feeling happy were described most often as ‘going hyper’, smiling and laughing, dancing and cheering/singing. Other behaviours included being more likely to do things (doing more than usual), bursting with energy, running about, being talkative, having bright eyes, jumping up and down and not being bothered about making a fool of yourself.
Opposites
Most commonly, children referred to feeling down/sad/upset/miserable as being the opposite of happy. Three groups described the opposite as being related to anger or depression and less commonly individuals referred to being worried/scared, disappointed or stressed, not being confident, feeling lonely, impatient or being hurt.
Susceptibility to bias (gender differences)
To assess participants’ views, thereby highlighting bias, the groups were asked who they thought was more likely to report being happier, boys or girls. Interestingly, in spite of the girls in our sample being more likely than boys to report feeling very happy in the survey, there was majority agreement from both sexes that boys were more likely to report being happier. Boys described this tendency in terms of girls’ fall-outs being permanent (compared with boys who fall out for a day and make up), girls not having guts and being bothered if they drop something or fall, or girls having more to do than boys (getting up earlier to do their hair). Some girls explained how boys ‘play’ more and ‘don’t think about things’. They felt that boys ‘shrug things off, whereas girls have more feelings’ and are more sensitive. Boys, they explained, are less serious and more physical. Significantly, some girls felt that boys did not answer this question honestly, ‘they just tick anything and want to look good’. Boys were scared, these girls explained, to say that they are not happy and it is not as acceptable for them to talk about their feelings, whereas girls are allowed (alluding to societal norms). They explained how boys are supposed to be ‘protectors’ and not show any sign of weakness.
20
Box 4.1: Main and sub-themes relating to ‘happiness’
(1) Meaning of happiness (from think aloud, survey and focus group definitions)
(1.1) Happy as an emotion
(1.1)1. Cheerful, joyful, good mood (1.1)2. Excited
(1.1)3. Laughter, smiling
(1.2) Feeling good about yourself
(1.2)1. Warm glow, wonder within self, feeling alive (1.2)2. Feeling of success
(1.3) Feeling good/positive about life (1.3)1. Enjoyment
(1.3)2. Being carefree/not worrying
(1.3)3. Being satisfied/having everything you want
(2) Contributing factors (from Word Association/constituents/contributory factors in the focus groups)
(2.1) Self-perceptions
(2.1)1. Being good at something (2.1)2. Being ‘sorted’
(2.2) Companionship
(2.2)1. Being with friends/girlfriends (2.2)2. Being with/having family
(2.2)3. Being with other people who are happy (2.2)4. Being included
(2.3) Particular events/times
(2.3)1. Holidays, birthdays, parties, moving, getting a job, Christmas, Summer, surprises (2.3)2. Having a good day/being in good mood
(2.3)3. Last day of school/last period (2.3)4. Getting your own way
(2.4) Hobbies/activities (Football, bikes, watching TV, pool, shooting range, mini moto, playing, eating, sleeping)
(2.5) Getting things (Presents, money, new clothes, winning something)
(2.6) Environment
(2.6)1. Sunny weather/summer/heat
(2.6)2. Healthy surroundings, roads, trees, waters
(3) Associations
(3.1) General associations (3.1)1. Friendliness (3.1)2. Fun (3.1)3. Sharing (3.1)4. Colour (yellow) (3.1)5. Animals (3.1)6. Celebrities
(3.2) Similar feelings
(3.2)1. Cheerful, joyful, ecstatic, elated (3.2)2. Excited
(3.2)3. Wonder
(3.2)4. Feeling good inside
(3.2)5. Expressions (Smile, laughter)
(3.3) Opposites
When you don’t smile, feel down/sad/upset/unhappy/miserable, droopy, worried/scared, disappointed about something, not confident, failing a subject in school, tired, anger/rage/annoyed, depression, stress, when things are boring, unsociable, dull (like dark cloud has passed over you), lonely, moody/narky, impatient, you have been hurt/people bullying you
21
4.2 Confidence
[image:21.595.88.316.149.260.2]Table 4.2a presents data on the percentage of children choosing particular responses to the question relating to confidence in Survey 1 and 2.
Table 4.2a: Responses to the confidence question ‘How often do you feel confident in yourself?’
Frequency of feeling confident
Survey 1 (N=294)
Survey 2 (N=294)
Always 12.9% 23.1%
Often 52.4% 52.0%
Sometimes 26.9% 20.7%
Hardly ever 6.1% 3.7%
Never 1.7% .3%
*No gender differences
[image:21.595.92.425.380.509.2]There were no gender differences at the time of Survey 1 or 2. Comparison of our data with those from the last national HBSC survey suggest that there were more boys and girls in our sample that were not as confident, or were less likely to admit to always feeling confident, than would be the case in the general population of 11-year-olds in Scotland (see Table 4.2b).
Table 4.2b: Comparison of our sample’s responses in Survey 1 with the findings from the national 2006 HBSC survey (confidence measure)
Girls Boys
Scale Our
sample (N=140) HBSC 2006* (N=891) Our sample (N=154) HBSC 2006* (N=812)
Always 10.7% 23.9% 14.9% 32.9%
Often 51.4% 37.8% 53.2% 39.9%
Sometimes 30.0% 23.0% 24.0% 16.6%
Hardly ever 7.1% 9.8% 5.2% 6.0%
Never 0.7% 5.5% 2.6% 4.6%
*11-year-olds (Currie, Levin & Todd, 2008)
Test-retest reliability
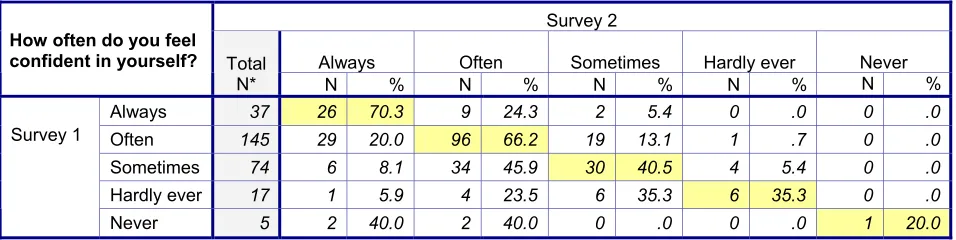
[image:21.595.85.563.625.745.2]The confidence question showed lower test-retest reliability then happiness (r=0.47, p<.001) and the correlation decreased when the items were recoded into a binary variable, ‘always confident’ against all other responses (r=0.44, p<.001). Table 4.2c shows the percentage agreement between Survey 1 and 2 for each response category.
Table 4.2c: Comparison of responses to the measure of confidence at Survey 1 & 2
Survey 2
Always Often Sometimes Hardly ever Never
How often do you feel
confident in yourself? Total
N* N % N % N % N % N %
Always 37 26 70.3 9 24.3 2 5.4 0 .0 0 .0 Often 145 29 20.0 96 66.2 19 13.1 1 .7 0 .0 Sometimes 74 6 8.1 34 45.9 30 40.5 4 5.4 0 .0 Hardly ever 17 1 5.9 4 23.5 6 35.3 6 35.3 0 .0 Survey 1
Never 5 2 40.0 2 40.0 0 .0 0 .0 1 20.0
22
Overall, 57% of the pupils chose the same response at both time points, but 70% of those who reported feeling ‘always confident’ in Survey 1, opted for the same response in Survey 2. 66% also chose ‘often’ at both time points, again suggesting that responses are likely to be more stable if they are positive to begin with.
Construct validity (convergent/divergent)
[image:22.595.87.473.241.374.2]As noted previously, confidence was positively correlated with happiness and life satisfaction (although these were fairly low) and negatively correlated with feeling left out and helplessness (see Table 4.1d). Fairly low correlations were also found between the confidence measure and the SDQ Total Difficulties Scale and the various sub-scales (Table 4.2d). When used as a binary measure ‘always confident’ against all other responses, correlations were lower for most sub-scales (Table 4.2e).
Table 4.2d: Correlations between the confidence measure and SDQ scales (Survey 1)
Scale from the Strengths & Difficulties
Questionnaire (SDQ) N of valid cases Pearson's R Significance
Prosocial Scale 292 .182 p =.002
Emotional Symptoms 292 -.371 p <.001
Conduct Problems 291 -.123 p <.001
Hyperactivity Scale 292 -.199 p <.001
Peer Problems Scale 292 -.211 p <.001
Total Difficulties 291 -.327 p <.001
Table 4.2e: Correlations between the binary confidence measure and SDQ scales (Survey 1)
Scale from the Strengths & Difficulties
Questionnaire (SDQ) N of valid cases Pearson's R Significance
Prosocial Scale 292 .183 p =.002
Emotional Symptoms 292 -.165 p <.001
Conduct Problems 291 -.064 p <.001
Hyperactivity Scale 292 -.199 p <.001
Peer Problems Scale 292 -.107 p <.001
Total Difficulties 291 -.151 p <.001
[image:22.595.84.470.402.532.2]23
Face validity (children’s understanding of ‘confident’)
Survey responses
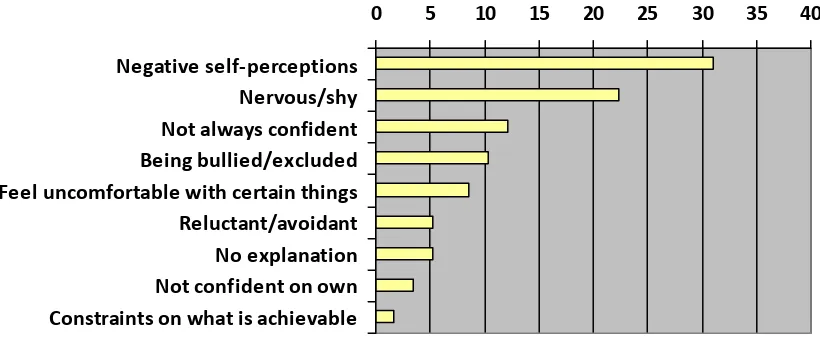
[image:23.595.89.496.318.504.2]There were only two queries on this question during the administration of the survey, both children asking what ‘confident’ meant. Figure 4.2a and 4.2b present data on the categories generated from examination of the open-ended responses. 156 reasons were derived from the explanations given by 135 cases. The most common reasons given for feeling confident related to the individual’s perception that they tried hard to feel this way or that they were competent at particular things. A greater proportion of responses to the survey question (compared with happiness) gave no particular explanation for their response, just a reference to being confident. Support from others was mentioned in 11% of the responses and social influence is implied in the references to not being shy. However, in the main, confidence appeared to be viewed as something inherently individual/psychological (i.e., more ‘trait’ than ‘state’). This is confirmed in the reasons children gave for not feeling confident, where the majority of the explanations related to negative self-perceptions or being nervous/shy (evident in 53% of the reasons given for not feeling confident).
Figure 4.2a: Reasons for feeling confident (% of responses where child used explanation)
0 5 10 15 20 25
Makes efforts to be confident No explanation (because I am) Good at particular things Supported Knows what to do/able to do things Not shy/speaks out Self‐belief Happy with life Don't know Doing well/goal setting
N = 98 reasons
Figure 4.2b: Reasons for not feeling confident (% of responses where child used explanation)
0 5 10 15 20 25 30 35 40
Negative self‐perceptions
Nervous/shy Not always confident Being bullied/excluded Feel uncomfortable with certain things Reluctant/avoidant No explanation Not confident on own Constraints on what is achievable
[image:23.595.83.493.556.725.2]24 Focus group/think aloud data
Identifying ‘confidence’
Children tended to choose family members or friends as people they thought were confident. Interestingly, boys tended to choose males (dad, granddad, brother, male friend/cousin) and girls females (aunt, sister, female friend/cousin). These people were described most often as ‘up for anything’ (phrase used six times), although frequent references were also made to them saying how they feel, putting themselves forward, and not being scared to talk to people and ask for help. One P7 girl chose Johnny Depp (filmstars were deemed to be confident, he had done embarrassing things and had positive reviews), while one S2 boy chose Ronaldo (footballer) because he was never scared to try something different and do things that no one else does, he is not shy and doesn’t hide away. Superman was also mentioned in one of the boys’ groups. Some of the choices and explanations suggest that confident may sometimes be confused with achieving.
Constituents of confidence
In response to the vignette, where children had to explain why the person was feeling confident in different circumstances, most often reference was made to being happy with family life. Other comments related to being happy with life in general, being praised, having no hassles, never being in trouble, doing well at school and being good at something. One group of girls referred to the person having lots of friends, going somewhere after school or there being something good on TV, suggesting parallels with happiness and perhaps a lack of understanding of confidence. Within this same group, there was also some confusion between feeling confident in yourself and confident that something might happen (e.g., getting more pocket money). This should not pose any problems within the survey, where the wording is clear (‘how often do you feel confident in yourself?’). Reasons provided for the person in the vignette who was not feeling very confident tended to evolve mainly around being bullied/abused (lack of attention at home, mum and dad putting them down, people
‘slagging them off’). References were also made to them not having a good time at home, feeling sad, struggling with school work, having a big test forthcoming or difficult homework to be in the next day.
Word association/contributory factors
The most common words children chose to convey confidence or list things that made them feel confident were: happy/smiley; unafraid; excitement, feeling good about yourself and brave. Other words/phrases used less frequently included ‘big ego’, stressfree, content, boldness, amazement, willing to do things, proud, positive, motivated, strong, able to stand up in front of a big crowd and XFactor. When asked what made them feel confident personally, the most popular responses were: someone saying good things about you/encouragement, previous success/winning something and doing a talk/speech in front of the class (only boys). To keep feeling confident, they explained, you could hope for the best, believe in yourself and recognise that everyone needs help.
Definition
25
much and appear big-headed, ‘up yourself’, a ‘show off’, cocky or arrogant and not see anything wrong with you. Others mentioned the possibility that confidence might backfire on you. You might take on something you think you can do but then not be able to and therefore embarrass yourself.
Associated behaviours
Behaviours associated with being confident were described most often as people saying ‘this is easy’, being the first to volunteer to do something, engaging more (in conversations, activities, saying how you feel) and ‘jumping about’. Two of the boys’ groups tended to focus on the negative, drawing attention to a ‘swagger’ and
‘bragging’.
Opposites
Most commonly, children referred to being shy/nervous, hiding yourself, keeping things to yourself and not thinking you can do something as the opposite of confident. In this sense, it appears that confidence is associated with being open and somehow larger than life, with less recognition of being quietly confident. There were references to being worried, scared, unsure, no self-belief, not wanting to try new things and being sad or unhappy.
Susceptibility to bias (gender differences)
There were no gender differences in our sample’s responses to the question on confidence. However, to highlight possible bias within the general population reporting, each group was asked who, in general, they thought was more likely to report being more confident, boys or girls. There was majority agreement from both sexes (as with happiness) that boys were more likely to report being more confident. Only one of the girls thought girls were more confident as they had more people around them to talk to and two boys thought that boys and girls did not differ. The rest of the boys explained that boys shouted more, got more involved in activities, were more active, louder and would talk to anyone. Girls, they explained, were unwilling to volunteer in class (as they got embarrassed, particularly in front of boys) and less likely to get involved. Girls similarly described boys as not being afraid of anything, being more hyper and more willing to do things. Girls felt that their sex was more likely to keep things to themselves and tended to have more fears.
26 Box 4.2: Main and sub-themes relating to ‘confidence’
(1) Meaning of confidence (from think aloud, survey and focus group definitions)
(1.1) Confident as an attitude/approach to life (1.1)1. Up for anything
(1.1)2. Not fearful/nervous (1.1)3. Being proud of yourself
(1.1)4. Helping yourself and others to get on
(1.1)5. Being prepared for something/thinking positively (1.1)6. Standing up for yourself
(1.1)7. Not being put off by thoughts of what others might think (1.1)8. Willing to try things
(1.2) Competence
(1.2)1. Being able to respond to people
(1.2)2. You know you can do something/being sure of yourself (1.2)3. Form of strength
(1.2)4. Being able to speak out/get up in front of people
(1.3) Feeling positive about life (1.3)1. Happy/content (1.3)2. Not being scared/fearful
(1.3)3. Being satisfied/having everything you want
(1.4) Having a big ego (sometimes negative)
(2) Contributing factors (from Word Association/constituents/contributory factors in the focus groups)
(2.1) Support
(2.1)1. From friends and family (give you a ‘boost’, praise you, having a laugh) (2.1)2. Knowing that others love and care about you
(2.1)3. Having lots of friends
(2.2) Personal attributes
(2.2)1. Positive attitude - see (1.1) (2.2)2. Big ego
(2.2)3. Being a ‘performer’ (enjoying performing)
(2.3) Prior success/expectations (2.3)1. Doing well at school
(2.3)2. Familiarity with something (2.3)3. Winning competition
(2.3)4. Friend succeeding at something
(3) Associations
(3.1) General associations (3.1)1. Happy/smiley (3.1)2. Friends/family
(3.1)3. Brave/boldness/strong (3.1)4. Willing to do things (3.1)5. Positive/motivated
(3.1)6. Being able to stand up in front of a big crowd/X Factor (3.1)7. School/lessons/going to high school
(3.2) Similar feelings (3.2)1. Happy
(3.2)2. Unafraid/not scared (3.2)3. Proud
(3.2)4. Excited/jumping about/amazement (3.2)5. Content
(3.2)6. Feeling good about yourself
(3.3) Opposites
Worried, unconfident, scared, unsure, not thinking you can do something, getting put down by someone, shy/keep things to self/hide yourself, doesn’t believe in self, don’t want to do things they did before, not wanting to try new things, sad/unhappy/upset, embarrassed, nervous, not being able to stand up in front of a big crowd
27
4.3 Left out
[image:27.595.84.315.152.264.2]Table 4.3a presents data on the percentage of children choosing particular responses to the question relating to feeling left out in Survey 1 and 2.
Table 4.3a: Responses to the left out question ‘How often do you feel left out?’
Frequency of feeling left out
Survey 1 (N=295)
Survey 2 (N=294)
Never 13.2% 17.7%
Hardly ever 40.3% 45.6%
Sometimes 34.9% 30.6%
Often 9.8% 6.1%
Always 1.7% .0%
*No gender differences
[image:27.595.92.425.375.504.2]There were no gender differences at the time of Survey 1 or 2. Comparison of our data with those from the last national HBSC survey suggests that fewer of the boys and girls in our sample never feel left out than is the case in the general population of 11-year-olds in Scotland (see Table 4.3b).
Table 4.3b: Comparison of our sample’s responses in Survey 1 with the findings from the national 2006 HBSC survey (left out measure)
Girls Boys
Scale Our
sample (N=141) HBSC 2006* (N=890) Our sample (N=154) HBSC 2006* (N=812)
Never 10.6% 22.6% 15.6% 32.9%
Hardly ever 40.4% 41.7% 40.3% 39.4%
Sometimes 36.2% 25.5% 33.8% 20.6%
Often 11.3% 8.2% 8.4% 6.2%
Always 1.4% 2.0% 1.9% 1.0%
*11-year-olds (Currie, Levin & Todd, 2008)
Test-retest reliability
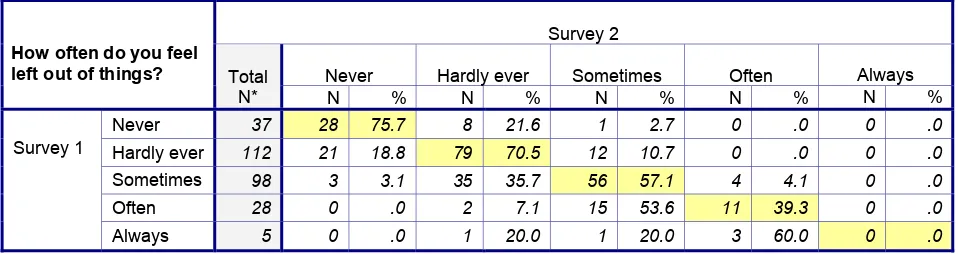
[image:27.595.84.563.630.757.2]The left out question showed high test-retest reliability (r=0.72, p<.001). However, the correlation decreased when the items were recoded into a binary variable, ‘never feel left out’ against all other responses (r=0.57, p<.001). Table 4.3c shows the percentage agreement between Survey 1 and 2 for each response category.
Table 4.3c: Comparison of responses to the measure of feeling left out at Survey 1 and 2
Survey 2
Never Hardly ever Sometimes Often Always
How often do you feel
left out of things? Total
N* N % N % N % N % N %
Never 37 28 75.7 8 21.6 1 2.7 0 .0 0 .0
Hardly ever 112 21 18.8 79 70.5 12 10.7 0 .0 0 .0 Sometimes 98 3 3.1 35 35.7 56 57.1 4 4.1 0 .0 Often 28 0 .0 2 7.1 15 53.6 11 39.3 0 .0 Survey 1
Always 5 0 .0 1 20.0 1 20.0 3 60.0 0 .0
28
Overall, 62% of the pupils chose the same response at both time points, but 76% of those who chose ‘never feel left out’ and 71% of those choosing ‘hardly ever’ in Survey 1, also reported feeling the same in Survey 2.
Construct validity (convergent/divergent)
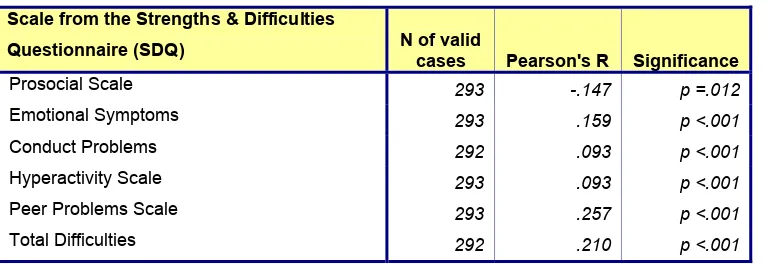
[image:28.595.87.467.268.399.2]Feeling left out was positively correlated with helplessness and negatively correlated with happiness, confidence and life satisfaction in particular (see Table 4.1d). Fairly low correlations were found between the left out measure and the Prosocial, Hyperactivity and Conduct Scales of the SDQ. However, unlike the happiness and confidence items, there were higher correlations between left out and the two SDQ sub-scales measuring peer problems and emotional symptoms. This increases the correlation between left out and Total Difficulties to .56 (Table 4.3d). When used as a binary measure ‘never left out’ against all other responses, correlations were substantially lower for most sub-scales (Table 4.3e).
Table 4.3d: Correlations between the left out measure and SDQ scales (Survey 1)
Scale from the Strengths & Difficulties
Questionnaire (SDQ) N of valid cases Pearson's R Significance
Prosocial Scale 293 -.147 p =.012
Emotional Symptoms 293 .469 p <.001
Conduct Problems 292 .341 p <.001
Hyperactivity Scale 293 .280 p <.001
Peer Problems Scale 293 .500 p <.001
[image:28.595.86.470.426.558.2]Total Difficulties 292 .560 p <.001
Table 4.3e: Correlations between the binary left out measure and SDQ scales (Survey 1)
Scale from the Strengths & Difficulties
Questionnaire (SDQ) N of valid cases Pearson's R Significance
Prosocial Scale 293 -.147 p =.012
Emotional Symptoms 293 .159 p <.001
Conduct Problems 292 .093 p <.001
Hyperactivity Scale 293 .093 p <.001
Peer Problems Scale 293 .257 p <.001
Total Difficulties 292 .210 p <.001
The correlation between Total Difficulties (SDQ) and left out in Survey 2 was .52 (N=292).
Face validity (children’s understanding of ‘left out’)
Survey responses
29
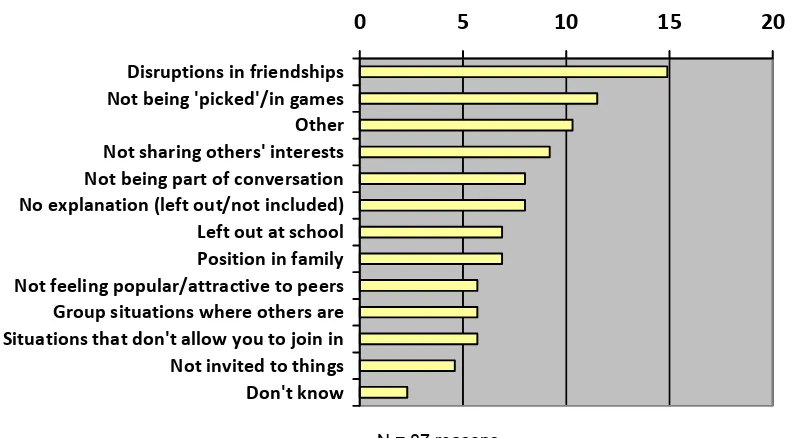
[image:29.595.81.477.141.360.2]in the family (being the youngest, etc.) was referred to within 7% of the explanations. 10% of the responses referred to very specific events and were categorised as ‘other’. The main reason given for not feeling left out (used in 40% of the explanations) was having good friends; people you could rely on or who would stick up for you.
Figure 4.3a: Reasons for feeling left out (% of responses where child used explanation)
0
5
10
15
20
Disruptions in friendships Not being 'picked'/in games Other Not sharing others' interests Not being part of conversation No explanation (left out/not included) Left out at school Position in family Not feeling popular/attractive to peers Group situations where others are Situations that don't allow you to join in Not invited to things Don't know
N = 87 reasons
Figure 4.3b: Reasons for not feeling left out (% of responses where child used explanation)
0
10
20
30
40
Has good friends
No explanation (not left out)
Always involved in games
Family includes/cares for them
Can find a solution/not affected
Other
Being a member of groups
Being popular/attractive to peers
N = 58 reasons
Focus group/think aloud data
Constituents of feeling left out
[image:29.595.89.460.417.605.2]30
being allowed to go to the place involved, living far away or friends taking different subjects from them). In relation to being left out by friends, children mentioned being left out of sports (often perceived to be the result of being ‘no good’), not being included in conversations, people keeping secrets or friends unintentionally ignoring or making fun of them. There was recognition that being left out could be a perception rather than reality. For example, friends may actually be joking but the person takes it seriously, the person doesn’t want to join in but then feels left out when they don’t or they are in a bad mood so friends act differently with them. Moreover, not sharing common interests (smoking and going somewhere together were given as examples) could make you feel left out.
Word association/contributory factors
The most common words children chose to convey feeling left out or list things that made them feel left out were: sad/upset/unhappy; lonely/alone, and unwanted/neglected. Other responses included angry, frustrated, loner, worried, jealousy, bullied, different. Some children referred to particular sports/games where people were likely to feel left out (football, tig and basketball). When asked what made people their age feel left out, the most popular responses were related to not being permitted to do certain things (e.g., not permitted to play football due to age/religion/ competence, or parents not allowing them to go out with friends). The non-intentional nature of leaving people out was acknowledged as well as the subtle ways this can be enacted (i.e., making others jealous). To tackle or prevent feeling left out, they explained, you could do other things, tell the person who is leaving you out, try to be more involved, give it time or tell someone close that they trust.
Definition
There was broad agreement that left out meant the following: no one plays with you; not included; feeling sad; not joining in; being rejected; on your own; people don’t want to be seen with you; when you don’t get invited to things; feeling unwanted or lonely or you don’t have many friends. These definitions also highlight (like other activities within the focus groups) the actions of people who leave others out (i.e., the reality of being left out), as well as the feeling of being left out (which may be reality or simply a person’s perception of events). Interestingly, one boy defined left out as
‘when you are overlooked’, which appears to capture the personal feeling and perhaps the often unintentional or more subtle ways in which people can be left out.
Associated behaviours
Behaviours associated with being left out were described most often in terms of appearing somehow ‘outside’ the group (walking behind, out of the conversation or not joining in a laugh), being on your own, or references were made to emotional expressions (sad face, looking away). Less frequently, children referred to running off crying, getting into a fight, being moody or not doing anything about being bullied by others.
Opposites
Most commonly, children referred to being happy, playing with others/joining in, getting picked/being invited to things, being popular, feeling like you’re part of something and always having lots of friends.
Susceptibility to bias (gender differences)
31
likely to report feeling left out, boys or girls. The four girls for whom we have data relating to this activity all agreed that girls were more likely to report feeling left out, as boys tend to always be in a big group, whereas girls spend time in smaller groups where fall-outs are more common. Four boys were in agreement, suggesting that girls were more likely to fall out and tease each other and perhaps felt left out because they couldn’t play football! Within one of these groups, the boys felt that they didn’t argue or get annoyed if they were left out, whereas girls would be upset and fight. One boy felt there was no gender difference in the tendency to feel left out and one said he didn’t know if there was a difference. Overwhelmingly though (as six boys nominated boys), boys felt that there was more pressure on them than on girls, particularly if they didn’t like sports or football teams. Interestingly, one boys’ group thought that girls tended to have bigger friendship groups and are therefore never on their own.
32 Box 4.3: Main and sub-themes relating to ‘left out’
(1) Meaning of left out (from think aloud, survey and focus group definitions)
(1.1) Exclusion (intentional vs. unintentional) (1.1)1. Not being invited somewhere (1.1)2. Being left on own
(1.1)3. Not being permitted to join in (age, religion, popularity, competence) (1.1)4. Being ignored/overlooked
(1.1)5. Being bullied/picked on
(1.1)6. Being picked last (games/sports)
(1.2) Lack of involvement/participation (1.2)1. Not joining in
(1.2)2. Not being part of the group (1.2)3. Being new
(1.2) Absence of friends/support
(1.2)1. Not having anyone to play with (1.2)2. People not listening to you
(1.2)3. People not wanting to be with you/avoiding or rejecting you/keeping secrets
(1.3) Comparison with others
(1.3)1. Feeling like everyone is treated better than you (1.3)2. Feeling unwanted/lonely
(1.3)3. Not being able to do something everyone else can
(2) Contributing factors (from Word Association/constituents in the focus groups)
(2.1) Absence of support/attention/friends
(2.2) Family context
(2.2)1. Lack of attention at home (siblings get more attention, parents tired/stressed, not caring for children properly)
(2.2)2. Living far from friends/being grounded/not allowed to places where friends go (2.2)3. No siblings
(2.2)4. Spending time at home alone
(2.3) Peer/school context
(2.3)1. Competitive games where competence important (football, basketball, tig) (2.3)2. Not being popular and therefore excluded/not picked/teased
(2.3)3. Disruptions in friendships (fall outs)
(2.3)4. Friend is off school/friends take different subjects (2.3)5. Not doing the same things as friends (smoking) (2.3)6. Feeling less affluent than peers
(2.3)7. Feeling less competent than peers
(2.4) Individual/psychological factors (2.4)1. Being a loner/outsider
(2.4)2. Being grumpy/having a bad day (2.4)3. Not having confidence to join in
(3) Associations
(3.1) Similar feelings and associations (3.1)1. Sad/unhappy/upset (3.1)2. Angry/frustrated/irritated
(3.1)3. A nobody/like nothing
(3.1)4. Unwanted/lonely/stranded/different (3.1)5. Worried (about not having friends)
(3.1)6. Unfair
(3.1)7. Jealousy
(3.2) Opposites
33
4.4 Helplessness
[image:33.595.87.316.149.260.2]Table 4.4a presents data on the percentage of children choosing particular responses to the question relating to feeling helpless in Survey 1 and 2.
Table 4.4a Responses to the helpless question ‘How often do you feel helpless?’
How often do you feel helpless?
Survey 1 (N=289)
Survey 2 (N=291)
Never 24.2% 27.8%
Hardly ever 49.5% 51.2%
Sometimes 20.8% 17.2%
Often 5.2% 3.8%
Always 0.3% .0%
*No gender differences
[image:33.595.94.427.388.515.2]There were no gender differences at the time of Survey 1 or 2. Comparison of our data with those from the last national HBSC survey suggests that fewer boys and girls in our sample never feel helpless, than would be found in the national population of 11-year-olds. More boys in our sample appear to feel helpless ‘sometimes’, compared with the national sample (see Table 4.4b).
Table 4.4b: Comparison of our sample’s responses in Survey 1 with the findings from the national 2006 HBSC survey (helpless measure)
Girls Boys
Scale Our
sample (N=135)
HBSC 2006* (N=887)
Our sample (N=154)
HBSC 2006* (N=810)
Never 25.9% 38.1% 22.7% 41.7%
Hardly ever 51.1% 34.4% 48.1% 34.9%
Sometimes 17.8% 18.7% 23.4% 16.4%
Often 5.2% 6.4% 5.2% 4.9%
Always .0% 2.4% 0.6% 2.0%
*11-year-olds (Currie, Levin & Todd, 2008)
Test-retest reliability