R E S E A R C H
Open Access
Observing the clouds: a survey and taxonomy
of cloud monitoring
Jonathan Stuart Ward
†and Adam Barker
*†Abstract
Monitoring is an important aspect of designing and maintaining large-scale systems. Cloud computing presents a unique set of challenges to monitoring including: on-demand infrastructure, unprecedented scalability, rapid elasticity and performance uncertainty. There are a wide range of monitoring tools originating from cluster and high-performance computing, grid computing and enterprise computing, as well as a series of newer bespoke tools, which have been designed exclusively for cloud monitoring. These tools express a number of common elements and designs, which address the demands of cloud monitoring to various degrees. This paper performs an exhaustive survey of contemporary monitoring tools from which we derive a taxonomy, which examines how effectively existing tools and designs meet the challenges of cloud monitoring. We conclude by examining the socio-technical aspects of monitoring, and investigate the engineering challenges and practices behind implementing monitoring strategies for cloud computing.
Keywords: Cloud computing; Monitoring
Introduction
Monitoring large-scale distributed systems is challeng-ing and plays a crucial role in virtually every aspect of a software orientated organisation. It requires substantial engineering effort to identify pertinent information and to obtain, store and process that information in order for it to become useful. Monitoring is intertwined with system design, debugging, troubleshooting, maintenance, billing, cost forecasting, intrusion detection, compliance, testing and more. Effective monitoring helps eliminate perfor-mance bottlenecks, security flaws and is instrumental in helping engineers make informed decisions about how to improve current systems and how to build new systems.
Monitoring cloud resources is an important area of research as cloud computing has become the de-facto means of deploying internet scale systems and much of the internet is tethered to cloud providers [1,2]. The advance-ment of cloud computing, and by association cloud moni-toring, is therefore intrinsic to the development of the next generation of internet.
Cloud computing has a unique set of properties, which adds further challenges to the monitoring process. The
*Correspondence: [email protected]
†Equal contributors
School of Computer Science, University of St Andrews, St Andrews, UK
most accepted description of the general properties of cloud computing comes from the US based National Insti-tution of Standards and Technology (NIST) and other contributors [3,4]:
• On-demand self service:A consumer is able to provision resources as needed without the need for human interaction.
• Broad access:Capabilities of a Cloud are accessed through standardised mechanisms and protocols. • Resource Pooling:The Cloud provider’s resources
are pooled into a shared resource which is allocated to consumers on demand.
• Rapid elasticity:Resources can be quickly
provisioned and released to allow consumers to scale out and in as required.
• Measured service:Cloud systems automatically measure a consumers use of resources allowing usage to be monitored, controlled and reported.
Despite the importance of monitoring, the design of monitoring tools for cloud computing is as yet an under researched area, there is hitherto no universally accepted toolchain for the purpose. Most real world cloud monitor-ing deployments are a patchwork of various data collec-tion, analysis, reporting, automation and decision making
software. Tools from HPC, grid and cluster computing are commonly used due to their tendencies towards scal-ability while enterprise monitoring tools are frequently used due to their wide ranging support for different tools and software. Additionally, cloud specific tools have begun to emerge which are designed exclusively to tol-erate and exploit cloud properties. A subclass of these cloud monitoring tools are monitoring as a service tools which outsource much of the monitoring process a third party.
While the challenges associated with cloud monitor-ing are well understood, the designs and patterns which attempt to overcome the challenges are not well exam-ined. Many current tools express common design choices, which affect their appropriateness to cloud monitor-ing. Similarly there are a number of tools which exhibit relatively uncommon designs which are often more appro-priate for cloud computing. Arguably, due to the com-partmentalisation of knowledge regarding the design and implementation of current tools, emerging tools continue to exhibit previously employed schemes and demonstrate performance similar to well established tools. We there-fore contend that it is necessary to examine the designs common to existing tools in order to facilitate discus-sion and debate regarding cloud monitoring, empower operations staff to make more informed tool choices and encourage researchers and developers to avoid reimple-menting well established designs.
In order to perform this investigation we first present a set of requirements for cloud monitoring frameworks, which have been derived from the NIST standard and contemporary literature. These requirements provide the context for our survey in order to demonstrate which tools meet the core properties necessary to monitor cloud computing environments. Pursuant to this, we perform a comprehensive survey of existing tools including those from multiple related domains. From this comprehen-sive survey we extract a taxonomy of current monitoring tools, which categories the salient design and implemen-tation decisions that are available. Through enumerating the current monitoring architectures we hope to provide a foundation for the development of future monitoring tools, specifically built to meet the requirements of cloud computing.
The rest of this paper is structured as follows: Section ‘Monitoring’ provides an overview of the tradi-tional monitoring process and how this process is applied to cloud monitoring. Section ‘Motivation for cloud mon-itoring’ describes the motivation for cloud monitoring and details the behaviours and properties unique to cloud monitoring that distinguish it from other areas of moni-toring. Section ‘Cloud monitoring requirements’ presents a set of requirements for cloud monitoring tools derived from literature, which are used to judge the effectiveness
of current monitoring tools and their appropriateness to cloud monitoring. Section ‘Survey of general monitoring systems’ surveys monitoring systems which predate cloud computing but are frequently referred to as tools used in cloud monitoring. Section ‘Cloud monitoring systems’ surveys monitoring tools which were designed, from the outset for cloud computing. Section ‘Monitoring as a ser-vice tools’ surveys a monitoring as a serser-vice tools, a recent development which abstracts much of the complexity of monitoring away from the user. Section ‘Taxonomy’ extrapolates a taxonomy from the surveyed tools and cat-egorises them accordingly. We then use this taxonomy to identity how well current tools address the issues of cloud monitoring and analyse the future potential of cloud monitoring tools. Section ‘Monitoring as an engineering practice’ considers monitoring from a practical stand-point, discussing the socio-technical and organisational concerns that underpin the implementation of any moni-toring strategy. Finally Section ‘Conclusion’ concludes this paper.
Monitoring
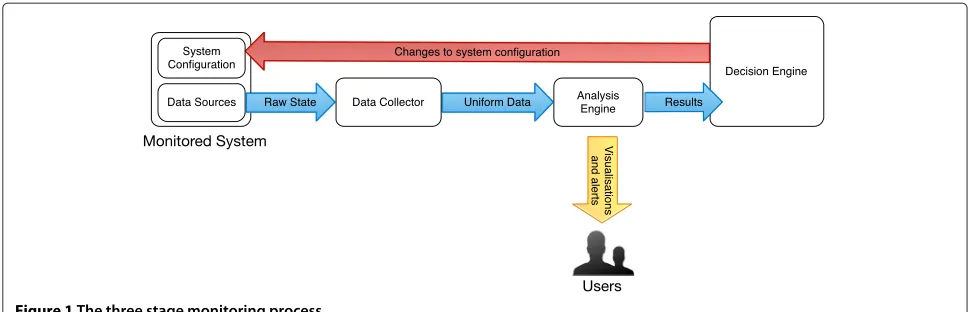
At its very simplest monitoring is a three stage process illustrated by Figure 1: the collection of relevant state, the analysis of the aggregated state and decision making as a result of the analysis. The more trivial monitoring tools are simple programs which interrogate system state such as the UNIX tools df, uptime or top. These tools are run by a user who in turn analyses the system state and makes an informed decision as to what, if any action to take. Thus, in fact, the user is performing the vast majority of the monitoring process and not software. As computing systems continue to grow in size and com-plexity there is an increasing need for automated tools to perform monitoring with a reduced, or removed need for human interaction. These systems implement all or some of the 3 stage monitoring process. Each of these stages have their own challenges, especially with regards to cloud computing.
Collection
Figure 1The three stage monitoring process.
associated configuration overhead becomes prohibitive; requiring frequent interaction. These challenges have led to the development of a number of schemes to improve the scalability of monitoring systems.
There are a diverse set of methods for collecting moni-toring state from cloud deployments. Many tools still rely upon fully centralised data collection, while others have extended this design through the use of trees and other forms of overlay.
Data collection trees are the simplest means of improv-ing scalability over fully centralised systems. Monitorimprov-ing architectures using trees to collect and propagate data have improved scalability when compared to fully cen-tralised but still rely upon single points of failure. Typi-cally, a central monitoring server sits at the root of the tree and is supported by levels of secondary servers which propagate state from monitored hosts (the leaves of the tree) up to the root. Failure of a monitoring server will disrupt data collection from its subtree.
Trees are not the solution to all scalability issues. In the case of large scale systems, most tree schemes require a significant number of monitoring servers and levels of the tree in order to collect monitoring information. This requires the provisioning of significant dedicated moni-toring resources, which increases the propagation latency; potentially resulting in stale monitoring data at the top of the hierarchy.
With large scale systems becoming more common place, several recent monitoring systems have abandoned cen-tralised communication models [5-8]. A new and diverse class of monitoring system makes use of peer to peer concepts to perform fully decentralised data collection. These systems make use of distributed hash tables, epi-demic style communication and various P2P overlays to discover and collect data from machines. Decen-tralised schemes have inherent scalability improvements over earlier schemes but this is not without a series of additional challenges including: the bootstrap problem,
lookup, replication and fault tolerance. Decentralised sys-tems must overcome these challenges and risk becom-ing slower and more cumbersome than their centralised counterparts.
A very recent development is monitoring as a service: SaaS applications that abstract much of the complexity of monitoring away from the user. This class of monitor-ing tool, presumably, makes use of similar architectures to existing tools but introduces a novel separation of con-cerns between where data is generated and where it is collected. In these systems a users installs a small agent which periodically pushes monitoring state to a service endpoint, all functionality beyond that is the preroga-tive of the monitoring provider. This alleviates complexity on behalf of the user but exacerbates the complexity of the service provider who must provide multi-tenanted monitoring services.
Analysis
Once data has been collected it must be analysed or other-wise processed in order for it to become useful. The range of analysis offered by monitoring tools varies greatly from simple graphing to extremely complex system wide anal-ysis. With greater analysis comes greater ability to detect and react to anomalous behaviour, this however comes with an increased computational cost.
Graphing is the lowest common denominator of analy-sis and offloads the complexity of analyanaly-sis to the end user. Resource monitors and systems, which exclusively collect time series data are the only tools which tend to rely solely on graphing. These tools typically provide a holistic view of system wide resource usage; allowing a user to inter-rogate machine specific resource usage if necessary. It is then up to the user to detect resource spikes, failures and other anomalous behaviour.
Threshold analysis is where monitoring values are con-tinually checked against a predefined condition, if the value violates the condition an alert is raised or other action taken. This basic strategy is used to provide health monitoring, failure detection and other forms of basic analysis.
Threshold monitoring allows for expected error states to be detected but does not provide a means to detect unexpected behaviour. As cloud deployments become increasingly large and complex the requirement for auto-mated analysis becomes more pressing. To this end var-ious recent tools provide facilities for trend analysis and stream processing to detect anomalous system states and complex error conditions beyond what simple threshold analysis is capable of detecting. These more complex anal-ysis tasks often require bespoke code, which runs outside of the monitoring environment consuming data via an API or alternatively runs as part of the monitoring system through a plugin mechanism.
Complex analysis is typically more resource intensive than simple threshold, analysis requiring significant mem-ory and CPU to analyse large volumes of historical data. This is a challenge for most monitoring systems. In cen-tralised monitoring system a common mitigation is simply provisioning additional resources as necessary to perform analysis. Alternatively, taking cues from volunteer com-puting, various monitoring systems attempt to schedule analysis over under utilised hosts that are undergoing monitoring.
Decision making
Decision making is the final stage of monitoring and is particularly uncommon in the current generation of mon-itoring tools. As previously discussed, simple tools collect and graph analysis requiring the user to analyse the cur-rent state of the system and in turn make any appropriate decisions. This is a challenge for the user as it requires them to consider all known state, identify issues and then devise a set of actions too rectify any issues. For this rea-son, all major organisations employ significant operations personnel in order to enact any appropriate actions. Cur-rent monitoring tools are intended to support monitoring personnel rather than to take any action directly.
Many current monitoring tools support the notion of event handlers; custom code that is executed dependant upon the outcome of analysis. Event handlers allow oper-ations personnel to implement various automated strate-gies to prevent errors cascading, their severity increasing or even resolve them. This represents an automation of part of the manual error handling process and not a true autonomic error correction process.
Some monitoring tools provide mechanisms to imple-ment basic automated error recover strategies [9,10]. In the case of cloud computing the simplest error recovery
mechanism is to terminate a faulty VM and then instanti-ate a replacement. This will resolve any errors contained to a VM (stack overflows, kernel panics etc) but will do lit-tle to resolve an error trigged by external phenomenon or an error that continuously reoccurs.
A true autonomic monitoring system which can detect unexpected erroneous states and then return the system to an acceptable state remains an open research area. This area of research is beyond the scope of most other mon-itoring challenges and exists within the domain of self healing autonomic systems.
Motivation for cloud monitoring
Monitoring is an important aspect of systems engineer-ing which allows for the maintenance and evaluation of deployed systems. There are a common set of motiva-tions for monitoring which apply to virtually all areas of computing, including cloud computing. These include: capacity planning, failure or under-performance detec-tion, redundancy detecdetec-tion, system evaluadetec-tion, and policy violation detection. Monitoring systems are commonly used to detect these phenomena and either allow adminis-trators to take action or to take some form of autonomous action to rectify the issue. In the case of cloud computing there are additional motivations for monitoring which are more unique to the domain, these include:
Performance uncertainty
applications from running correctly and limits the perfor-mance of regular applications. The perforperfor-mance impact of CPU stealing can be so significant that Netflix [15] and other major cloud users implement a policy of terminat-ing VMs that exceed a CPU stealterminat-ing threshold as part of their monitoring regime.
The vague notion of compute units gives little ability to predict actual performance. This is primarily due to two factors: multi-tenancy and the underlying hardware. Vir-tualization does not guarantee perfect isolation, as a result users’ can affect one another. Many cloud providers utilise (or are believed to utilise) an over-subscription model whereby resources are over sold to end users. In this case, users will effectively compete for the same resources resulting in frequent context switching and overall lower performance. The exact nature of this mechanism and the associated performance implications are not disclosed by any cloud provider. This issue is further compounded by the underlying hardware. No cloud provider has homoge-neous hardware. The scale that cloud providers operate at makes this impossible. Each major cloud provider oper-ates a wide range of servers with different CPUs. The underlying hardware has the most crucial effect upon performance. Again, no cloud provider discloses informa-tion about their underlying hardware and the user has no knowledge of the CPU type that their VM will have prior to instantiation. Thus, details critical to determining the performance of a VM are unavailable until that VM has been instantiated.
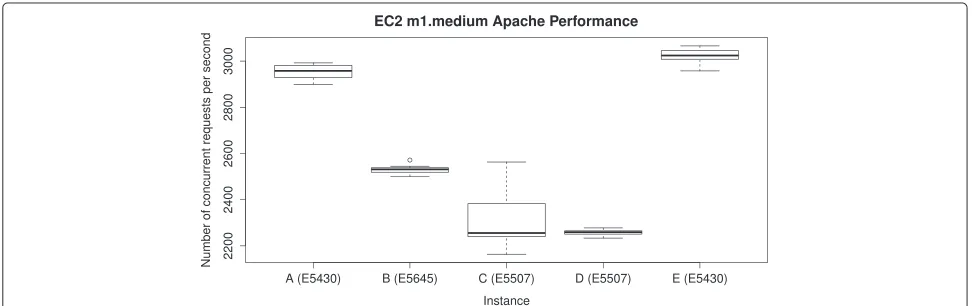
Figure 2 gives some example as to the range of perfor-mance variation commonly found in cloud deployments. This Figure shows the results of an Apache benchmark performed on 5 EC2 VMs instantiated at the same time, in the same US East Region. Each of these VMs are of the m1.medium type. In this sample of 5 instances, three CPU types were found: the Intel Xeon E5645, E5430 and E5507. An Apache benchmarking test was performed 12 sepa-rate times per instance over a 3 hour period in order to
ascertain how many http requests per second (a predom-inantly CPU bound activity) each instance could fulfil. As is evident from the graph, a range of performance was demonstrated. The lowest performance was exhibited by instance C which in one test achieved 2163 requests per second. The highest performance was demonstrated by instance E which achieved 3052 requests per second. This represents a 29% difference between the highest and low-est performing VMs. Interlow-esting to note is the processor responsible for delivering the best and second best perfor-mance, the E5430, is an older end of line chip. The newer CPU models, which were expected to yield greater per-formance handled demonstrably fewer tests. Whether this is due to the underlying physical machines being over-sold or due to some other multi-tenanted phenomena is unclear. Notable is instance C which yielded a signifi-cant range of performance variation, again for an unclear reason. This trivial benchmarking exercise is comparable with results found in literature [11,11,16] and demon-strates the range of performance that can be found from 5 VMs that are expected to be identical. In any use case involving a moderate to high traffic web application sev-eral of these instances may prove unsuitable. Without the availability of monitoring data it is impossible for stake-holders to identify these issues and thus will suffer from degraded performance.
[image:5.595.56.542.561.714.2]The non-availability of exact performance metrics makes deploying certain use cases on the cloud a chal-lenge. An example of this is HPC applications. Cloud computing has frequently been touted as a contender for supporting the next generation of HPC applications. Experiments showing that it is feasible to deploy a com-parable low cost supercomputer capable of entering the top500 [17] and the recent availability of HPC instance types makes cloud computing an appealing choice for certain HPC applications. Performance uncertainty, how-ever, makes it hard to create a deployment with the desired level of performance. Conceptually the same size
of deployment could offer significantly different rates of performance at different points in time which is clearly undesirable for compute bound applications. These con-cerns will appear in any cloud deployment which expects a certain level of performance and may be prohibitive.
This uncertainty makes cloud monitoring essential. Without monitoring it is impossible to understand and account for the phenomena mentioned above. To sum-marise, the need for cloud monitoring, with regards to performance certainty is four fold:
• To quantify the performance of a newly instantiated VM deployment to produce an initial benchmark that can determine if the deployment offers acceptable performance.
• In order to examine performance jitter to determine if a deployment is dropping below an acceptable baseline of performance.
• To detect stolen CPU, resource over-sharing and other undesirable phenomena.
• To improve instance type selection to ensure that the user achieves best performance and value.
SLA enforcement
With such a dependency upon cloud providers, customers rely upon SLAs to ensure that the expected level of ser-vices are delivered. While downtime or non availability is easily detected there are other forms of SLA viola-tion which are not easily noticed. High error rates in APIs and other services and performance degradation of VMs and services are not always easily detectable but can have significant impact upon an end users deployments and services. Monitoring is therefore essential in order to guarantee SLA compliance to produced the necessary audit trail in the case of SLA violation. Monitoring is also important on the part of the cloud provider, in this capac-ity, to ensure SLA compliance is maintained and that an acceptable user experience is provided to customers.
In the case of recent outages and other incidents [18,19] cloud provider’s SLAs have been ineffective in safeguard-ing performance or otherwise protectsafeguard-ing users. Moni-toring, therefore, becomes doubly important as it allows cloud users to migrate their architecture to an alternative provider or otherwise compensate when a cloud provider does not adhere to the level of expected service.
Defeating abstraction
Cloud computing is based on a stack which builds func-tionality on increasing levels of abstraction. It therefore seems counter-intuitive to attempt to circumvent abstrac-tion and delve down into the level below. Doing so how-ever allows users to become aware of phenomena that, whether they are aware of it or not, will affect their appli-cations. There are a number of phenomena which are
abstracted away from the user that crucially affect their applications, these include:
Load balancing latency
Many cloud providers including Amazon Web Services, Google Compute Engine and Microsoft Azure include a load balancer which can distribute load between VMs and create additional VMs as necessary. Such load balancers are based upon undisclosed algorithms and their exact operation is unknown. In many cases the load balancer is the point of entry to an application and as such, success of an application rests, in part, on effective load balanc-ing. A load balancer is ineffective when it fails to match the traffic patterns and instantiate additional VMs accord-ingly. This results in increased load on the existing VMs and increased application latency. Monitoring load bal-ancing is therefore essential to ensure that the process is occurring correctly and that additional VMs are created and traffic distributed as is required. Successfully detect-ing improper load balancdetect-ing allows the user to alter the necessary policies or utilise an alternative load balancer.
Service faults
Public clouds are substantial deployments of hardware and software spread between numerous sites and utilised by a significant user-base. The scale of public clouds ensures that at any given time a number of hardware faults have occurred. Cloud providers perform a noble job in ensuring the continuing operation of public clouds and strive to notify end users of any service disruptions but do not always succeed. An Amazon Web Services outage in 2012 disrupted a significant portion of the web [19]. Major sites including Netflix, Reddit, Pintrest, GitHub, Imgur, Forsquare, Coursera, Airbnb, Heroku and Minecraft were all taken off-line or significantly disrupted due to fail-ures in various AWS services. These failfail-ures were initially detected by a small number of independent customers and weren’t fully publicised until it became a significant issue. The few users who monitored these emergence of these faults ahead of the public announcement stood far greater chance of avoiding disruption before it was too late. Mon-itoring service availability and correctness is desirable when one’s own infrastructure is entirely dependant upon that of the cloud provider.
Location
unavailability of any precise physical or logical locations is detrimental. If a user wishes to deploy an applica-tion as close to users or a data source as possible and has a choice of numerous cloud regions it is difficult to make an informed decision with the limited informa-tion that is made available by cloud providers [20,21]. In order to make an informed decision as to the placement of VMs additional information is required. To make an informed placement the user must monitor all relevant latencies between the user or data source and potential cloud providers.
Cloud monitoring requirements
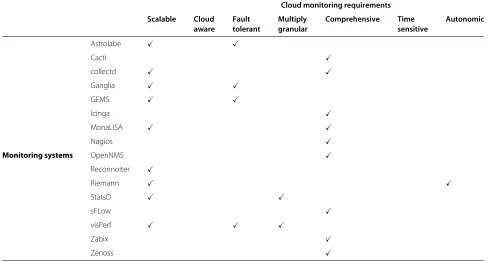
Cloud computing owes many of its features to previous paradigms of computing. Many of the properties inher-ent to cloud computing originate from cluster, grid, ser-vice orientated, enterprise, peer to peer and distributed computing. However, as an intersection of these areas, cloud computing is unique. The differences between cloud monitoring and previous monitoring challenges has been explored in literature [22,23]. A previous survey of cloud monitoring [24] has addressed the challenges inherent to cloud computing. Examination of the challenges pre-sented in the literature in combination with the well established NIST definition allow us to derive a set of requirements for a cloud monitoring framework. These requirements provide a benchmark against which to judge current systems. An ideal system will focus on and fulfil each of these requirements; realistically monitoring tools will focus predominantly upon one of these requirements with lesser or no support for the others. Importantly, we differentiate our survey from [24] by focusing upon the design and internals of current tools and taxonomies these tools accordingly, as opposed to focusing upon the requirements and open issues of cloud monitoring.
Scalable
Cloud deployments have an inherent propensity for change. Frequent changes in membership necessitate loose coupling and tolerance membership churn, while change in scale necessitates robust architectures which can exploit elasticity. These requirements are best encap-sulated under the term scalability. A scalable monitoring system is one which lacks components which act as a bot-tleneck, single points of failure and supports component auto detection, frequent membership change, distributed configuration and management, or other features that allow a system to adapt to elasticity.
Cloud aware
Cloud computing has a considerable variety of costs -both in terms of capital expenditure and in terms of per-formance. Data transfer between different VMs hosted in different regions can incur significant financial costs,
especially when dealing with big data [25,26]. Monitor-ing data will eventually be sent outside of the cloud in order to be accessed by administrators. In systems hosted between multiple clouds there will be both inter and intra cloud communication. Each of these cases have different costs and latencies associated with them both in terms of latency and in terms of financial cost to the user. Latency and QoS presents a significant challenge for applications running on the cloud [27,28] including monitoring. When monitoring physical servers a host can be but a few hops away, cloud computing gives no such guarantees. This will adversely affect any monitoring system which uses topolo-gies which rely upon the proximity of hosts. A location aware system can significantly outperform a system which is not location aware [29] and reduce the costs inherently associated with cloud computing. Hence a cloud moni-toring system must be aware of the location of VMs and collect data in a manner which minimizes delay and the costs of moving data.
Fault tolerance
Failure is a significant issue in any distributed system, however it is especially noteworthy in cloud computing as all VMs are transient [30]. VMs can be terminated by a user or by software and give no indication as to their expected availability. Systems must Current monitoring is performed based upon the idea that servers should be permanently available. As such current monitoring sys-tems will report a failure and await the return of the failed server. A cloud monitoring system must be aware of failure, and of VM termination and account for it appro-priately. It must not treat VM termination as failure but it must always detect genuine failure. Crucially failure, even widespread failure, must not disrupt monitoring.
Autonomic
Having to configure a live VM, even a trivial configuration, is a significant overhead when dealing with large num-bers of VMs. When deployments auto-scale and rapidly change, human administrators cannot be required to per-form any per-form of manual intervention. An autonomic sys-tem is one which has the capacity for self management; to configure and optimise itself without the need for human interaction. There are many different levels of autonomic behaviour from simple configuration management tools to self optimising and self healing systems. At the very least, a cloud monitoring system must require no sig-nifiant configuration or manipulation at runtime. Greater degrees of autonomic behaviour is however, incredibly desirable.
Multiple granularities
Practically no data collected from systems is unimportant but it may be unrelated to a given use case. Some monitor-ing state may be useful only when analysed en masse while other state is immediately useful by itself. These factors necessitate a monitoring system which considers the mul-tiple levels of granularity present in any monitored system. This can range from proving a mechanism to alter the rate at which data is collected or to dynamically alter what data is collected. It can also extend to tools which collect data from less conventional sources and from multiple levels of the cloud stack. Accounting for granularity when dealing with users is also essential. Users should not be expected to manually parse and analyse large sets of metrics or graphs. Monitoring tools should produce visualizations or other reports to the user at a coarse granularity appro-priate for humans while collecting and analysing data at a much finer level of granularity.
Comprehensiveness
Modern systems consist of numerous types of hardware, VMs, operating systems, applications and other software. In these extremely heterogeneous environments there are numerous APIs, protocols and other interfaces which pro-vide potentially valuable monitoring state. A cloud moni-toring tool must be comprehensive: it must support data collection from the vast array of platforms, software and other data sources that comprise heterogeneous systems. This can be achieved either through the use of third party data collection tools, plugins or simply through extensive in built support.
Time sensitivity
Monitoring state can be useful long after it has been col-lected. Capacity planning, post mortem analysis and a variety of modelling strongly depends upon the availabil-ity of historical monitoring state. The more common func-tions of monitoring, such as anomaly detection, depend upon up to date monitoring state that is as close to real time as possible. Monitoring latency: the time between an phenomena occurring and that phenomena being detected, arises due to a number of causes. The data col-lection interval, the time between state being collected is a significant factor in monitoring latency. In some systems the collection interval is fixed, this is common in loosely coupled systems where monitored hosts push state at their own schedule. In other schemes the monitoring interval can be adjusted this is common in pull based schemes or in push schemes where there is some form of feed-back mechanism. If the interval is fixed and events occur within the collection interval those events will remain undetected until the next collection occurs. In systems where the collection time increases as the number of mon-itoring hosts increases this can result in significant latency between phenomena occurring and their detection.
Monitoring latency can also be affected by communi-cation overheads. Systems which rely upon conventional network protocols which provide no time guarantees can suffer increased latency due to packet loss or congestion. Encoding formats, data stores and various of data repre-sentation can also increase the time between state leaving its point or origin and it being analysed if they act as performance bottlenecks.
A monitoring system is time sensitive if it provides some form of time guarantee or provides a mechanism for reducing monitoring latency. These guarantees are essen-tial to ensure continuous effective monitoring at scale or in the event of frequent change.
Survey of general monitoring systems
This section contains two categories of tools: tools devel-oped before cloud computing and contemporary tools which were not designed specifically for cloud monitor-ing but have related goals. In the case of the former, these tools retain relevance to cloud computing either by util-ising concepts pertinent to cloud monitoring or by being commonly utilised in cloud monitoring.
Ganglia
Ganglia [31] is a resource monitoring tool primar-ily intended for HPC environments. Ganglia organises machines into clusters and grids. A cluster is a collection of monitored servers and a grid is the collection of all clus-ters. A Ganglia deployment operates three components: Gmond, Gmetad and the web frontend. Gmond, the Ganglia monitoring daemon is installed on each mon-itored machine and collects metrics from the local machine and receives metrics over the network from the local cluster. Gmetad, the Ganglia Meta daemon polls aggregated metrics from Gmond instances and other Gmetad instances. The web frontend obtains metrics from a gmond instance and presents them to users. This architecture is used to form a tree, with Gmond instances at the leaves and Gmond instances at subsequent layers. The root of the tree is the Gmond instance which supplies state to the web frontend. Gmetad makes use of RRDTool [32] to store time series data and XDR [33] to represent data on the wire.
Ganglia provides limited analysis functionality. A third party tool: the Ganglia-Nagios bridge[34] allows Nagios to perform analysis using data collected by Ganglia. This attempts to gain the analysis functionality of Nagios while preserving the scalable data collection model of Ganglia. This is not a perfect marriage as the resulting system incurs the limitations of both tools but is often proposed as a stopgap tool for cloud monitoring. Similarly Ganglia can export events to Riemann.
is designed to obtain low level metrics including CPU, memory, disk and IO. It was not designed to moni-tor applications or services and nor was it designed for highly dynamic environments. Plugins and various exten-sions are available to provide additional features but the requirements of cloud computing are very different to Ganglia’s design goals. Despite this, Ganglia still sees some degree of usage within cloud computing due to its scalability.
Astrolabe
Astrolabe [8] is a tool intended for monitoring large scale distributed systems which is heavily inspired by DNS. Astrolabe provides scalable data collection and attribute based lookup but has limited capacity for performing analysis. Astrolabe partitions groups of hosts into an over-lapping hierarchy of zones in a manner similar to DNS. Astrolabe zones have a recursive definition: a zone is either a host or a set of non overlapping zones. Two zones are non-overlapping if they have no hosts in com-mon. The smallest zones consist of single hosts which are grouped into increasingly large zones. The top level zone includes all other zones and hosts within those zones. Unlike DNS, Astrolabe zones are not bound to a specific name server, do not have fixed attributes and state update are propagated extremely quickly.
Every monitored host runs the Astrolabe agent which is responsible for the collection of local state and the aggre-gation of state from hosts within the same zone. Each host tracks the changes of a series of attributes and stores them as rows in a local SQL database. Aggregation in Astrolabe is handled through SQL SELECT queries which serve as a form of mobile code. A user or software agent issues an query to locate a resource or obtain state and the Astro-labe deployment rapidly propagates the query through a peer to peer overly, aggregates results and returns a complete result. Astrolabe continuously recomputes these queries and returns updated results to any relevant clients. Astrolabe has no publicly available implementation and the original implementation evaluates the architecture through the use of simulation. As a result, there is no definitive means to evaluate Astrolabe’s use for cloud monitoring. Irrespective of this Astrolabe is an influen-tial monitoring system which, unlike many contemporary, monitoring tools employs novel aggregation and grouping mechanisms.
Nagios
Nagios [35] is the de facto standard open source moni-toring tool for monimoni-toring server deployments. Nagios in its simplest configuration is a two tier hierarchy; there exists a single monitoring server and a number of mon-itored servers. The monitoring server is provided with a configuration file detailing each server to be monitored
and the services each operates. Nagios then generates a schedule and polls each server and checks each ser-vice in turn according to that schedule. If servers are added or removed the configuration must be updated and the schedule recomputed. Plugins must be installed on the monitored servers if the necessary information for a service check cannot be obtained by interacting with the available services. A Nagios service check consists of obtaining the relevant data from the monitored host and then checking that value against a expected value or range of values; raising an alert if an unexpected value is detect. This simple configuration does not scale well, as the sin-gle server becomes a significant bottleneck as the pool of monitored servers grows.
In a more scalable configuration, Nagios can be deployed in an n-tier hierarchy using an extension known as the Nagios Service Check Acceptor (NCSA). In this deployment, there remains a single monitoring server at the top of this hierarchy, but in this configuration it polls a second tier of monitoring servers which can in turn poll additional tiers of monitoring servers. This distributes the monitoring load over a number of monitoring servers and allows for scheduling and polling to be performed in small subsections rather then en mass. The NCSA plug-in that facilitates this deployment allows the monitorplug-ing results of a Nagios server to be propagated to another Nagios server. This requires each Nagios server to have its own independent configuration and the failure of any one of the monitoring servers in the hierarchy will dis-rupt monitoring and require manual intervention. In this configuration system administrators typically rely on a third party configuration management tool such as Chef or Puppet to manage the configuration and operation of each independent Nagios server.
A final, alternative configuration known as the Dis-tributed Nagios Executor (DNX) introduces the concept of worker nodes [36]. In this configuration, a master Nagios server dispatches the service checks from its own schedule to a series of worker nodes. The master maintains all configuration, workers only require the IP address of the master. Worker nodes can join and leave in an ad hoc manner without disrupting monitoring ser-vices. This is beneficial for cloud monitoring; allowing an elastic pool of workers to scale in proportion to the monitored servers. If, however, the master fails all moni-toring will cease. Thus, for anything other than the most trivial deployments additional failover mechanisms are necessary.
can result in significant CPU and IO overhead. Internally, Nagios relies upon a series of pipes, buffers and queues which can become bottlenecks when monitoring large scale systems [37]. Many of these host checks are, by default, non parallelised and block until complete. This severely limits the number of service checks that can be performed. While most, if not all of these issues can be overcome through the use of plugins and third party patches this requires significant labour. Nagios was sim-ply never designed or intended for monitoring large scale cloud systems and therefore requires extensive retrofitting to be suitable for the task [38]. The classification of Nagios is dependant upon its configuration. Due to its age and extensive plugin library Nagios has numerous configurations.
Collectd
Collectd [39] is an open source tool for collecting mon-itoring state which is highly extensible and supports all common applications, logs and output formats. It is used by many cloud providers as part of their own moni-toring solutions, including Rightscale [40]. One of the appeals of collectd is its network architecture; unlike most tools it utilises IPv6 and multicast in addition to regu-lar IPv4 unicast. Collectd uses a push model, monitoring state is pushed to a multicast group or single server using one of the aforementioned technologies. Data can be pushed to several storage backends, most commonly RRDTool [32] is used but MongoDB, Redis, MySQL and others are supported. This allows for a very loosely cou-pled monitoring architecture whereby monitoring servers, or groups or monitoring servers, need not be aware of clients in order to collect state from them. The sophisti-cated networking and loose coupling allow collectd to be deployed in numerous different topologies, from simple two tier architectures to complex multicast hierarchies. This flexibility makes collectd one of the more popu-lar emerging tools for cloud monitoring. Collectd, as the name implies, it primarily concerned with the collection and transmission of monitoring state. Additional func-tions, including the storage of state are achieved through plugins. There is no functionality provided for analysing, visualising or otherwise consuming collected state. Col-lectd attempts to adhere to UNIX principles and eschews non collection related functionality, relying on third party programs to provide additional functionality if required. Tools which are frequently recommended for use with Collectd include:
• Logstash [41] for managing raw logfiles, performing text search analysis which is beyond the perview of collected
• StatsD [42] for aggregating monitoring state and sending it to an analysis service
• Bucky [43] for translating data between StatsD, Collectd and Graphtite’s formats.
• Graphite [44] for providing visualization and graphing • drraw [45] an alternative tool for visualization
RRDtool data
• Riemann [9] for event processing • Cabot [46] for alerting
Collectd, in conjunction with additional tools make for a comprehensive cloud monitoring stack. There is however no complete, ready to deploy distribution of a collectd based monitoring stack. Therefore, there is sig-nificant labour required to build, test and deploy the full stack. This is prohibitive to organisations that lack the resources to roll their own monitoring stack. Colletd based monitoring solutions are therefore available only to those organisations that can develop and maintain their stack. For other organisations, a more complete solution or monitoring as a service tool may be more appropriate.
Riemann
Riemann [9] is an event based distributed systems mon-itoring tool. Riemann does not focus on data collection, but rather on event submission and processing. Events are representations of arbitrary metrics which are gen-erated by clients and encoded using Google Protocol Buffers [47] and additionally contains various metadata (hostname, service name, time, ttl, etc). On receiving an event Riemann processes it through a stream. Users can write stream functions in a Clojure based DSL to operate on streams. Stream functions can handle events, merge streams, split streams and perform various other oper-ations. Through stream processing Riemann can check thresholds, detect anomalous behaviour, raise alerts and perform other common monitoring use cases. Designed to handle thousands of events per second, Riemann is intended to operate at scale.
Events can be generated and pushed to Riemann in one of two ways. Either applications can be extended to generate events or third party programs can monitor applications and push events to Riemann. Nagios, Ganglia and collectd all support forwarding events to Riemann. Riemann can also export data to numerous graphing tools. This allows Riemann to integrate into existing monitoring stacks or for new stacks to be built around it.
Riemann is relatively new software and has develop-ing a user base. Due it its somewhat unique architecture, scalability and integration Riemann is a valuable cloud monitoring tool.
sFlow and host sFlow
from different vendors to be monitored by the same soft-ware. Monitored infrastructure runs an sFlow agent which receives state from the local environment and builds and sends sFlow datagram to a collector. A collector is any software which is capable of receiving sSlow encoded data. The original sFlow standard is intended purely for mon-itoring network infrastructure. Host sFlow [49] extends the base standard to add support for monitoring applica-tions, physical servers and VMs. sFlow is therefore one of the few protocols capable of obtaining state from the full gamut of data centre technologies.
sFlow is a widely implemented standard. In addition to sFlow agents being available for most pieces of network equipment, operating systems and applications there are a large number of collectors. Collectors vary in terms of functionality and scalability. Collectors range from basic command line tools and simple web applications to large complex monitoring and analysis systems. Other monitor-ing tools discussed, includmonitor-ing Nagios and Ganglia, are also capable of acting as sFlow collectors.
Rather than being a monitoring system, sFlow is a proto-col for encoding and transmitting monitoring data which makes it unique amongst the other tools surveyed here. Many sFlow collectors are special purpose tools intended for DDOS prevention [50], network troubleshooting [51] or intrusion detection. At present, there is no widely adopted general purpose sFlow based monitoring tool. sFlow is however, a potential protocol for future monitor-ing solutions.
Logstash
Logstash is a monitoring tool quite unlike the vast major-ity of those surveyed here. Logstash is concerned not with the collection of metrics but rather with the collection of logs and event data. Logstash is part of the ElasticSearch family, a set of tools intended for efficient distributed real time text analytics. Logstash is responsible for parsing and filtering log data while other parts of the ElasticSearch toolset, notably Kibana (a browser based analytics tool) is responsible for analysing and visualising the collected log data. Logstash supports and event processing pipeline not dissimilar to Riemann allowing chains of filter and routing functions to be applied to events as they progress through the Logstash index.
Similar to other monitoring tools, Logstash runs a small agent on each monitored host referred to as a shipper. The shipper is a Logstash instance which is configured to take inputs from various sources (stdin, stderr, log files etc) and then ’ship’ them using AMQ to an indexer. An indexer is another Logstash index which is configured to parse, filter and route logs and events that come in via AMQ. The index then exports parsed logs to Elastic-Search which provides analytics tools. Logstash addition-ally provides a web interface which communicates with
ElasticSearch in order to analyse, retrieve and visualise log data.
LogStash is written in JRuby and communicates using AMQP with Redis serving as a message broker. Scalability is of chief concern to LogStash and it enables distribution of work via Redis, which despite relying on a centralised model can conceptually allow LogStash to scale to thou-sands of nodes.
MonALISA
MonALISA (Monitoring Agents in A Large Integrated Services Architecture) [52,53] is an agent based monitor-ing system for globally distributed grid systems. MonAL-ISA uses a network of JINI [54] services to register and discover a variety of self-describing agent-based subsys-tems that dynamically collaborate to collect and analyse monitoring state. Agents can pull interact with conven-tional monitoring tools including Ganglia and Nagios and collect state from a range of applications in order to analyse and manage systems on a global scale.
MonALISA sees extensive use with the eScience and High Energy Physics community where large scale, glob-ally distributed virtual organisations are common. The challenges those communities face are relatively unique, but few other monitoring systems address the concerns of widespread geographic distribution: a significant concern for cloud monitoring.
visPerf
visPerf [55] is a grid monitoring tool which provides scal-able monitoring to large distributed server deployments. visPerf employs a hybrid peer-to-peer and centralised monitoring approach. Geographically close subsets of the grid utilise a unicast strategy to have a monitoring agent on each monitored server disseminate state to a local monitoring server. Each local server communicates with each other using a peer-to-peer protocol. A central server, the visPerf controller, collects state from each of the local masters and visualises state.
Communication in visPerf is facilitated by a bespoke protocol over TCP or alternatively XML-RPC. Either may be used allowing external tools to interact and obtain monitoring state. Each monitoring agent collects state using conventional UNIX tools including iostat, vmstat
GEMS
Gossip-Enabled Monitoring Service for Scalable Hetero-geneous Distributed Systems (GEMS) is a tool designed for cluster and grid monitoring [5]. It’s primary focus is failure detection at scale. GEMS is similar to Astrolabe in that it divides monitored nodes into a series of layers which form a tree. A gossip protocol [56] is employed to propagate resource and availability information through-out this hierarchy. A gossip message at level k encapsulates the state of all nodes at k and all levels above k. Layers are therefore formed based on the work being performed at each node, with more heavily loaded nodes being placed at the top of the hierarchy where less monitoring work is performed. This scheme is primarily used to propagate four data structures: a gossip list, suspect vector, suspect matrix and a live list. The gossip list contains the number of intervals since a heartbeat was received from each node, the suspect vector stores information regarding suspected failures, the suspect matrix is the total of all node’s suspect vectors and the live list is a vector containing the availabil-ity of each node. This information is used to implement a consensus mechanism over the tree which corroborates missed heartbeats and failure suspicions to detect failure and network partitions.
This architecture can be extended to collect and prop-agate resource information. Nodes can operate a perfor-mance monitoring component which contains a series of sensors, small programs, which collect basic system metrics including cpu, memory, disk io and so forth and propagates them throughout the hierarchy. Additionally GEMS operates an API to allow this information to be made available to external management tools, middle-ware or other monitoring systems. These external sys-tems are expected to analyse the collected monitoring state and take appropriate action, GEMS provides no mechanism for this. GEMS does however include sig-nificant room for extension and customisation by the end user. GEMS can collect and propagate any arbitrary state and has the capacity for real time programmatic reconfiguration.
Unlike Astrolabe, which GEMS bears similarity to, prototype code for the system is available [57]. This implementation has received a small scale, 150 node, evaluation which demonstrates the viability of the archi-tecture and the viability of gossip protocols for moni-toring at scale. Since its initial release, GEMS has not received widespread attention and has not been evalu-ated specifically for cloud monitoring. Despite this, the ideas expressed in GEMS are relevant to cloud com-puting. The problem domain for GEMS, large hetero-geneous clusters are not entirely dissimilar to some cloud environments and the mechanism for program-matic reconfiguration is of definite relevance to cloud computing.
Reconnoiter
Reconnoiter [58] is an open source monitoring tool which integrates monitoring with trend analysis. Its design goal is to surpass the scalability of previous monitoring tools and cope with thousands of servers and hundreds of thou-sands of metrics. Reconnoiter uses a n-tier architecture similar to Nagios. The hierarchy consists of three com-ponents notid, stratcond and Reconnoiter. An instance of the monitoring agent, notid, runs in each server rack of datacenter (dependant upon scale) and performs moni-toring checks on all local infrastructure. stratcond aggre-gates data from multiple notid instances (or other strat-cond instances) and pushes aggregates to a PostgreSQL database. The front end, named Reconnoiter, performs various forms of trend analysis and visualises monitoring state.
Reconnoiter represents an incremental development from Nagios and other hierarchical server monitoring tools. It utilises a very similar architecture to previous tools but is specifically built for scale, with notid instances having an expected capacity of 100,000 service checks per minute. Despite being available for several years Recon-noiter has not seen mass adoption, possibly due to the increasing abandonment of centralised monitoring archi-tectures in favour of decentralised alternatives.
Other monitoring systems
There are other related monitoring systems which are relevant to cloud monitoring but are either similar to the previously described systems, poorly documented or otherwise uncommon. These systems include:
• Icinga [59] is a fork of Nagios which was developed to overcome various issues in the Nagios development process and implement additional features. Icinga, by its very nature includes all of Nagios’ features and additionally provides support for additional storage back ends, built in support for distributed
monitoring, an SLA reporting mechanism and greater extensibility.
• Zenoss [60] is an opens source monitoring system similar in concept and use to Nagios. Zenoss include some functionality not present in a standard Nagios install including automatic host discovery, inventory and configuration management, and an extensive event management system. Zenoss provides a strong basis for customisation and extension providing numerous means to include additional functionality, including supporting the Nagios plugin format. • Cacti [61], GroundWork [62], Munin [63],
These systems have similar functionality and utilise a similar set of backend tools including RRDTool, MySQL and PostgreSQL. These systems, like several discussed in this section, were designed for
monitoring fixed server deployments and lack the supports for elasticity and scalability that more cloud-specific tools offer. The use of these tools in the cloud domain is unlikely to continue as alternative, better suited tools become increasingly available.
Cloud monitoring systems
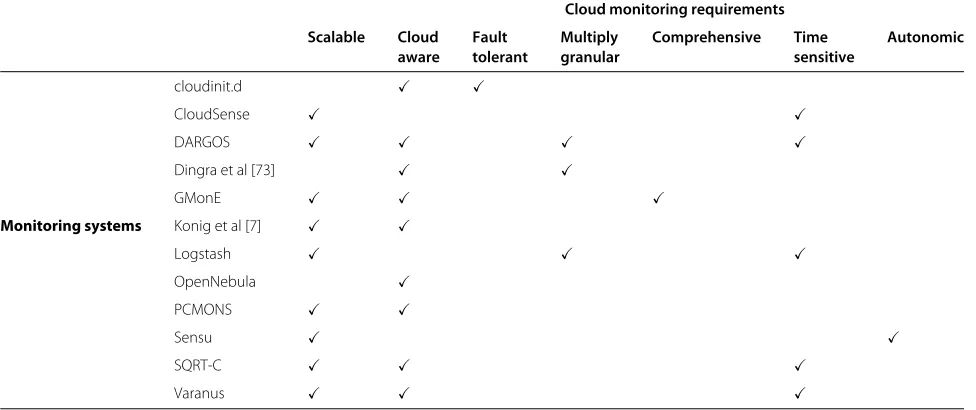
Cloud monitoring systems are those systems which have been designed from the ground for monitoring cloud deployments. Typically such systems are aware of cloud concepts including elasticity, availability zones, VM pro-visioning and other cloud specific phenomena. Concep-tually these tools have advantages over non cloud-aware tools as they can utilise cloud properties to scale and adapt as the system they monitor changes. The majority of sys-tems in this category are recent developments and lack the user base, support and range of plugins that are avail-able for many earlier systems. This presents a trade-off between cloud awareness and functionality that will likely lessen as time passes.
cloudinit.d
cloudinit.d [10] is a tool for launching and maintaining environments built on top of IaaS clouds. It is part of the Nimbus tool set which provides IaaS services for scientific users. Modelled after UNIX’s init daemon, cloudinit.d can launch groups of VMs and services according to a set of run levels and manage the dependencies between those services. A set of config files known as a plan are used by cloudinit.d to describe a deployment and provide scripts to initialise services and to check for correct behaviour. Once cloudinit.d has launched the set of services and VMs specified in the plan it initiates monitoring. cloudinit.d leverages conventional UNIX tools in its monitoring sys-tem, using ssh and scp to deploy monitoring scripts from the plan on each VM. These scripts periodically check that status of the hosted service and push the result to the Nimbus front end. The main purpose of this monitor-ing scheme is to enable automated recovery. If a VM is detected as faulty by cloudinit.d it will terminate and swap out that VM with a new, hopefully correctly functioning VM. This simple recovery mechanism allows distributed services to keep running when VMs that make up part of the service fail.
The cloudinit.d documentation recommends integrat-ing Nagios or Pintegrat-ingdom to provide more comprehensive and scalable monitoring services [67]. By itself cloudinit.d does not provide full monitoring services. Instead it only provides monitoring according to the scripts that are included within the plan. Failure or anomaly’s behaviour
which is not checked for by the monitoring scripts will go undetected. This impacts the failure recovery method as only simple failures which have been anticipated as potential failure can be detected. Unexpected failures which do not have scripts to detect them and fail-ures that are not solved by swapping out VMs cannot be detected or recovered from. cloudinit.d is however notable as being one of the few monitoring tools which integrates into a deployment and management tool and is one of the few tools which include a failure recovery mechanism.
Sensu
Sensu [68] is described as a ‘monitoring router’ a sys-tem that takes the result of threshold checks and passes them to event handlers. Its primary goal is to provide an event based model for monitoring. In Sensu nomencla-ture, clients are monitored hosts that run small scripts for performing service checks. The server periodically polls clients who in turn execute their scripts and push the results to the server. The server then correlates and anal-yses the results of the service checks and upon any check exceeding a predefined threshold then calls handlers: user defined scripts which will attempt to take action.
Sensu makes use of RabbitMQ [69], a message orien-tated middleware platform based upon the AMQ stan-dard. A Redis datastore is also used in order to store persistent data. These two technologies are used to allow Sensu to scale. Performance evaluation of RabbitMQ demonstrates its ability to handle tens of thousands of messages per second [70] and conceptually scale to tens of thousands of hosts.
Sensu is still an early stage project but already there are a number of third party check scripts and handlers avail-able. With additional community adoption Sensu could become a predominant monitoring tool.
SQRT-C
orchestrates DDS connections between publisher and subscriber.
An implementation of SQRT-C is available for down-load. This implementation has been evaluated on a small testbed of 50 VMs. This number of VMs does not demon-strate the architectures viability for operating at scale, however the results do demonstrate the inherent QoS improvements that the architecture brings. By utilising an underlying protocol that provides strong QoS guarantees SQRT-C demonstrates significantly reduced latency and jitter compared to monitoring tools leveraging conven-tional RESTful APIs.
SQRT-C has not received particularly widespread atten-tion but the issues of real time monitoring remain unad-dressed by monitoring tools at large. Virtually all cloud monitoring tools expose data via a conventional HTTP API often with no alternative, the HP Cloud Monitoring tool is the only notable monitoring system which offers a real time alternative.
Konig et al
In [7] Konig et al. propose a distributed peer to peer tool for monitoring cloud infrastructure. [7] is a three level architecture consisting of a data, processing and distri-bution layer. The data layer is responsible for obtaining monitoring data from a range of sources including raw log files, databases and services in addition to other conven-tional monitoring tools including Ganglia and Nagios. The processing layer exposes a SQL-like query language to fil-ter monitoring data and alfil-ter system configuration at run time. The distribution layer operates a peer to peer over-lay based on SmartFrog [72] which distributes data and queries across the deployment.
Konig et al., 2012 [7] is similar to other p2p monitoring systems in terms of topology but introduces a powerful query language for obtaining monitoring data as opposed to a conventional, simple REST API. Additionally the data layer component abstracts over numerous data sources, including other monitoring systems making this work a notable tool for building federated clouds and other architectures which encapsulate existing systems.
Dhingra et al
In [73] Dhingra et al. propose a distributed cloud mon-itoring framework which obtains metrics from both the VM and underlying physical hosts. Dhingra et al. contend that no current monitoring solutions provide ’customer focused’ monitoring and fail to monitor phenomena at and below the hypervisor level. Their proposed architec-ture, which is conceptually similar in design to collectd, runs monitoring agents on both the VM and physical host and aggregates state at a front end. The front end mod-ule correlates VM level metrics with low level physical metrics to provide a comprehensive monitoring data to
the end user. Additionally they propose a mechanism for adjusting the level of granularity that users can receive in order to provide fine grain data when users are perform-ing their own analysis and decision makperform-ing or more coarse grain data when users are relying upon the cloud provider to make decisions on their behalf. No implantation of the proposed architecture is available for download, however the variable granularity monitoring an multi-level mon-itoring present novel concepts which have not yet been fully integrated to existing monitoring tools.
DARGOS
Distributed Architecture for Resource manaGement and mOnitoring in cloudS (DARGOS)[6] is a fully decen-tralised resource monitor. DARGOS, like SQRT-C, makes use of the OMG Data Distribution Standard [74] (DDS) to provide a QoS sensitive pubsub architecture. DARGOS has two entities: the Node Monitor Agent (NMA) and the Node Supervisor Agent (NSA) which for all intents and purposes are the publisher and subscriber, respec-tively. The NMA collects state from the local VM and publishes state using the DDS. The NSA are responsible for subscribing to pertinent monitoring state and mak-ing that state available to analysis software, users or other agents via an API or other channel. DARGOS includes two mechanisms to reduce the volume of unneeded mon-itoring state which is propagated to consumers: time and volume based filters. These mechanisms reduce unnec-essary traffic and yield improvements over other pubsub schemes.
While DARGOS makes use of the DDS standard, QoS is not its primary concern and no specific provisions are made to ensure the low latency and jitter achieved by SQRT-C. Conceptually, DARGOS is similar to other pub-sub based monitoring tools including GMOnE, SQRT-C and Lattice
CloudSense
CloudSense is primarily intended for datacenter moni-toring and uses a compression scheme which lends itself well to anomaly detection. CloudSense has been proposed as a tool for monitoring MapReduce and other perfor-mance bound applications where anomaly detection is beneficial. This architecture in itself, is not enough to provide a comprehensive monitoring solution but does present a novel option for anomaly detection as part of a larger tool.
GMonE
GMonE [77] is a monitoring tool which covers the phys-ical, infastructure, platform and application layers of the cloud stack. GMonE attempts to overcome the limita-tions of existing monitoring tools which give only a partial view of a cloud system by giving a comprehensive view of all layers of the cloud. To this end, a monitoring agent: GMonEMon is present in all monitored components of the cloud stack including physical servers, IaaS VMs, PaaS instances and SaaS apps. GMonEMon has a plugin archi-tecture that allows users to develop additional modules to obtain metrics from all relevant sources. GMonEMon uses its plugins to collect data and then uses Java RMI based publish subscribe middleware to publish monitor-ing state. A database component: GMonEDB acts as a subscriber to various GMonEMon instances and stores monitoring state using MySQL, RRDtool, Cassandra [78] or other back end.
Unlike the vast majority of monitoring tools surveyed here, GMondE provides monitoring services to both cloud providers and cloud users. In a GmonE deployment there are at least two GMonE DB instances: one for a user and one for the provider. Each stakeholders subscribe to the components relevant to their operations. This could be used to allow users to obtain monitoring state from the layers bellow the layer that they are operating on. For example as SaaS could use this scheme to obtain met-rics regarding the PaaS platform, the VMs running the platform and even potentially the underlying hardware. The provider, meanwhile could choose only to moni-toring physical resources or could monitor their users infrastructure.
GMonE is a recent monitoring tool which currently lacks any publicly available release. Despite this, GMonE’s multi layer monitoring solution and novel pubsub scheme are notable concepts which are not found in other con-temporary monitoring tools.
Lattice
Lattice [79] is a monitoring platform for virtual resources which attempts to overcome the limitations of previous monitoring tools, including Ganglia and Nagios, that do not address elasticity, dynamism and frequent change. Unlike other tools in this survey Lattice is not in itself
a monitoring tool, rather it is a platform for developing monitoring tools. Lattice includes abstractions which are similar to other monitoring tools: producers, consumers and probes. Additionally Lattice provides the concept of a data source and distribution framework. The data source is an producer which encapsulates the logic for control-ling the collection and transmission of monitoring data in a series of probes which perform the actual data collec-tion. The distribution framework is the mechanism which transmits monitoring state between the producers and the consumers.
Lattice does not provide full implementations of these structures but rather provides building blocks from which third parties can develop full monitoring solution. This design is intended to allow developers to build moni-toring solutions specific to their unique use cases. The separation of concerns between the various monitoring components allows components to be differently imple-mented and change over time without affecting the other components.
The notion of a framework for building monitoring tools is a novel break from the other tools surveyed in this paper. Conceptually Lattice can be used to build differ-ent monitoring tools for differdiffer-ent use cases rather than reapplying existing tools to different uses cases. While this allow for the best fitting tools possible it requires signifi-cant labour to develop and test tools based upon Lattice. Lattice does not provide a library of probes, requiring the developer to implement their own library of data collec-tion scripts, a significant limitacollec-tion when compared to other tools including collectd and Nagios. Additionally, Lattice requires the developer to make design decisions regarding the distribution framework; which network architectures, wire formats, discovery mechanisms and so forth are used. This degree of effort is likely to be prohibitive to the vast majority of users.
Lattice being a framework for developing monitoring tools and not a tool in itself does not merit a direct clas-sification and is capable of producing tools that fit every classification.
OpenNebula monitoring
If, due to support issues, the push model is unavailable OpenNebula defaults to a pull model, similar to Nagios, whereby oned initiates an SSH connection on each moni-tored VM, executes the probes and pulls the results to the front end. Visualisation and alerts can then be generated by the OpenNebula web front end. OpenNebula’s moni-toring system is not particularly novel but is one of the few examples of an open source monitoring system which is embedded within a cloud infrastructure.
PCMONS
Private Clouds MONitoring Systems (PCMONS) [83] is a monitoring tool which was designed to address the lack of effective open source tools for private cloud monitoring. PCMONS employs a three layer structure consisting of the view, integration and infrastructure layer. The infras-tructure layer is comprised of heterogeneous resources: IaaS clouds, clusters or other server deployments. In the release available for download [84] Eucalyptus [85] and OpenNebula are supported at the infrastructure level. The integration level acts as a translator which abstracts the heterogeneity of the infrastructure level presenting a uni-form view of otherwise disparate systems. The integration layer is responsible for generating the required config-uration and installing the necessary software to collect monitoring data from the infrastructure level and passing it in a form that the view layer can use. The view layer per-forms the visualization and analysis of monitoring data. In the release of PCMONS, the view layer is based upon the Nagios server.
The most novel feature of PCMONS is the notion of the integration layer, a concept which is essential for feder-ated cloud monitoring whereby monitoring is performed over a series of different cloud resources. This feature of PCMONS is found in few other monitoring tools surveyed here.
Varanus
Varanus [86] is a peer to peer monitoring tool designed for monitoring large scale cloud deployments. Designed to handle scale and elasticity, Varanus makes use of a k-nearest neighbour based group mechanism to dynami-cally group related VMs and form a layered gossip hierar-chy for propagating monitoring state. Varanus uses three abstractions: groups, regions and cloud over which the gossip layer of the hierarchy. Groups are collections of VMs assigned by Varanus’ grouping strategy, regions are physical locations: data centres, cloud regions or sim-ilar, and the cloud is the top level abstraction includ-ing one or more regions. At the group and region level Varanus makes heavy use of the network to propagate state and state aggregates to related VMs. At the cloud level communication is slower and only periodic sam-ples are propagated. This scheme attempts to exploit the
inherent bandwidth differences in and between cloud regions. Heavy use of the network is used where band-width is unmetered and fast and reduced network usage occurs between regions where bandwidth is metered and limited.
Varanus has some points of commonality with Astro-labe and GEMS in that it utilises a gossip hierarchy to propagate monitoring state but introduces applies these concepts in a manner more suitable to cloud monitoring.
Monitoring as a service tools
The following systems are designed from the outset to monitoring cloud deployments. Unlike the systems detailed in the previous section their design is not pub-lished nor are any implementations available for full evalu-ation. Instead, these systems are monitoring as as a service (MaaS) tools which are accessible only though an API or other interface.
As the backend portions of monitoring as a service tools are hidden from the end user it is difficult to classify these tools. Externally, each of these tools are unicast push tools. The architecture used by the provider is, however, unknown.
Amazon CloudWatch
CloudWatch [87] is the monitoring component of Ama-zon Web Services. CloudWatch primarily acts as a store for monitoring data, allowing EC2 instances and other AWS services to push state to it via an HTTP API. Using this data a user can view plots, trends, statistics and vari-ous other representations via the AWS management con-sole. This information can then be used to create alarms which trigger user alerts or autoscale deployments. Mon-itoring state can also be pulled by third party applications for analysis or long term storage. Various tools including Nagios have support for obtaining CloudWatch metrics.
Access to this service is governed by a pricing model that charges for metrics, alarms, API requests and moni-toring frequency. The most significant basic charge is for metrics to be collected at minute intervals followed by the charge for the use of non standard metrics. CloudWatch presents a trade-off between full customisability and ease of use. The primary use case of CloudWatch is monitor-ing the full gamut of AWS services. Users of only EC2 will likely find the customisability of a full monitoring system preferable to the limited control afforded by CloudWatch.
HP cloud monitoring