1
Development of a smoke visualisation system for
wind tunnel laboratory experiments
Martin Trinder and Mark Jabbal (corresponding author)
School of Engineering and Design, Brunel University, Kingston Lane, Uxbridge, Middlesex, UB8 3PH, UK
E-mail: [email protected]; [email protected]
Abstract
The design, build and test of a smoke visualisation system for a vertical wind tunnel at Brunel University are described. The smoke visualisation system utilised a fog machine for smoke generation and required the design and manufacture of a smoke rake to produce smoke lines inside the wind tunnel test section. The application of these smoke lines over several test objects, including wing sections and bluff body shapes, demonstrated the functionality of the smoke system in producing good quality visualisation results. The facility has proven to be an economic addition in supporting other research projects and is anticipated to be a valuable ‘hands on’ addition to existing aerospace laboratory teaching.
Keywords: Wind tunnel; smoke visualisation design; fluids laboratory; experimental learning.
Introduction
2
The aim of this work was to design and build a smoke visualisation system to be installed in a laboratory-sized, vertical wind tunnel. Key requirements for the system included use of a non-hazardous smoke material suitable for a wind tunnel in a university setting and the ability to produce a uniform row of smoke lines sufficiently long to maintain their integrity throughout the test section. The intended outcome of the project is to achieve good visualisation results by performing visual tests of the air flow over several solid objects, including a cylinder and various wing planforms. These tests will aim to demonstrate what happens to the air flow over the individual test pieces by way of behaviour of the smoke lines. Furthermore, it is expected that a successfully demonstrated system would ultimately be integrated as part of current aerospace laboratory teaching, as well as supporting individual research projects.
Design of the Smoke Visualisation System
Wind Tunnel Facility
3
Smoke Visualisation Methods
There are several potential methods of carrying out smoke visualisation in a wind tunnel. Previous materials used for smoke visualisation are summarised in Table 1. These include tetrachloride-based liquids, which can be combusted and used to generate smoke. However such liquids produce toxic gases [2], which would not be suitable for a wind tunnel in a university laboratory. Carbon dioxide produces dense smoke, but can be harmful in large quantities and thus needs to be adequately exhausted.
Coupled with the choice of smoke material is the actual method of distributing smoke lines in the wind tunnel, both of which may be intrinsically linked. There are two main methods for generating discreet smoke lines, as outlined in Table 2. The smoke wire technique applies an oil-based mineral such as kerosene to a pre-stressed stainless steel wire of diameter 1mm or less and uses resistive heating to heat the wire [3]. It is also possible to use a smoke rake, which is an aerodynamically-shaped body (typically elliptical) featuring a row of tubes through which the smoke exits. Smoke to the rake can be introduced from a non-hazardous source, such as a water-based liquid heated by a smoke machine, rather than using combustion of hydrocarbons as in the smoke wire technique which is hazardous and toxic [4].
4
features good dispersal properties and has a density very similar to that of air when in vapour form so that the smoke lines would be expected to follow the air in the test section with high fidelity and not disperse or sink too quickly. As the fog liquid is water-based, the resulting fog cloud is non-hazardous and thus safe to use indoors; an essential requirement for the vertical wind tunnel facility.
Rake Design and Manufacture
A design for the wind tunnel smoke rake was produced using SolidWorks CAD software. When designing a smoke rake it is necessary to keep the cross-sectional area of the rake’s body to a minimum in order to mitigate the blockage effect in the wind tunnel, which could otherwise adversely influence the results. The key design feature of the rake is an elliptical, hollow cross-section, with dimensions 42 mm long in the direction of the freestream flow,
Material Advantages Disadvantages
Tobacco, Kerosene and
Titanium-Tetrachloride Produces high quality smoke
Hazardous/toxic;
tobacco difficult to control Carbon Dioxide Produces dense smoke Potentially harmful in large
volumes; needs to be exhausted Water-based liquids Non-hazardous; produces
dense vapour
Vapour can condense back to liquid
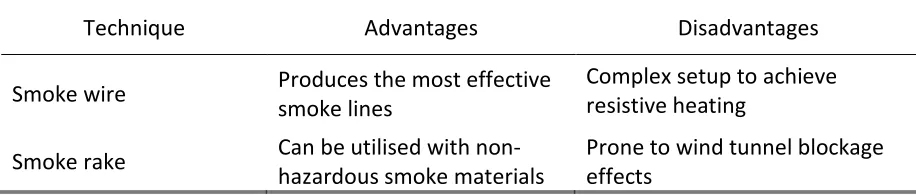
Technique Advantages Disadvantages
Smoke wire Produces the most effective smoke lines
Complex setup to achieve resistive heating
Smoke rake Can be utilised with non-hazardous smoke materials
[image:4.595.66.524.462.560.2]Prone to wind tunnel blockage effects
5
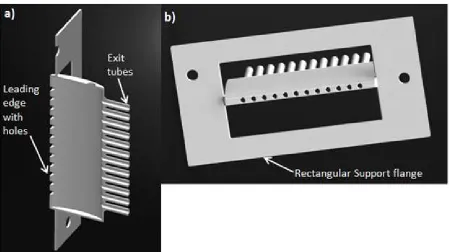
11 mm in depth and 100 mm in width, which is the same width as the test section. The rake features a 6 mm diameter hole on its side through which smoke from the fog machine can be injected; twelve leading-edge holes and twelve 20 mm long exit tubes, 2.4 mm in diameter and spaced 7 mm apart (Fig. 2a). The leading edge holes were incorporated into the design to allow air to enter the rake and thus push smoke out through the exit tubes when in operation. The diameter of the holes was set to 2.4 mm, which was deemed sufficiently large to avoid the possibility of the fog condensing inside the tubes whilst still being small enough to generate discreet smoke lines which would not merge with each other. Since the fog is derived from a water-based liquid, too small a diameter hole could cause the fog to condense and therefore nullify the smoke generated.
Another important feature of the rake design is the rectangular flange, which is required to support the rake in the vertical wind tunnel (Fig. 2b). The flange features two, non-aligned holes of 7 mm diameter. The position of these holes is important in securing the rake between the contraction and the detachable test section (Fig. 1a). The rectangular support was designed so that the rake could be clamped between these two sections of the wind tunnel, with the holes being positioned in such a way that the bosses extending from the contraction section would lock the rake in place.
6
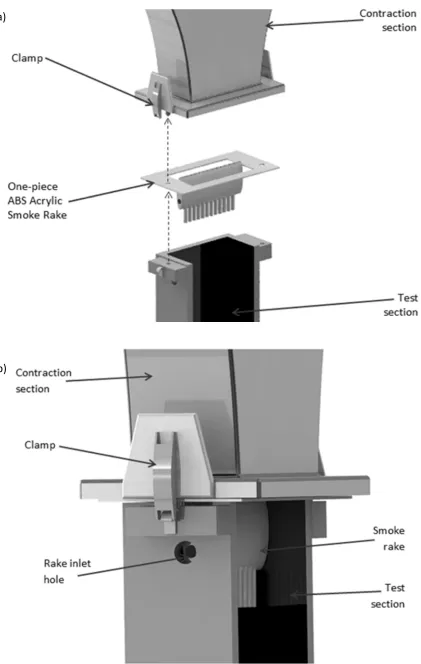
were made to be approximately 1.5 mm thick. Fig. 3 shows a CAD image of the above-described rake mounted in the wind tunnel.
Experimental Approach
Smoke Visualisation Test Setup
For the purpose of this work, a duplicate test section was manufactured to accommodate the required modifications to facilitate smoke visualisation, thereby allowing the original features of the wind tunnel to be maintained. The required modifications included a 12 mm hole added to the left-hand wall of the new test section, positioned 26 mm from the top edge. This was to allow the insertion of the nozzle from the smoke generator used for injecting smoke into the test section. Two additional holes of 5 mm diameter and spaced 15 mm apart were positioned on the rear wall of the test section (Fig. 1b) for securing test objects inside the wind tunnel.
7
by inserting a screw into the pipe linking the fog liquid reservoir and the pump to restrict the flow of fog liquid. To further reduce the volume of smoke entering the rake, the 1.4 m length pipe was cut in half and a Y-junction was inserted to exhaust some of the smoke out of a laboratory window. Secondly, smoke had a tendency to exit through the leading edge holes, causing a smoke cloud to form in the wind tunnel. The leading edge holes were ultimately deemed unnecessary and subsequently covered using duct tape.
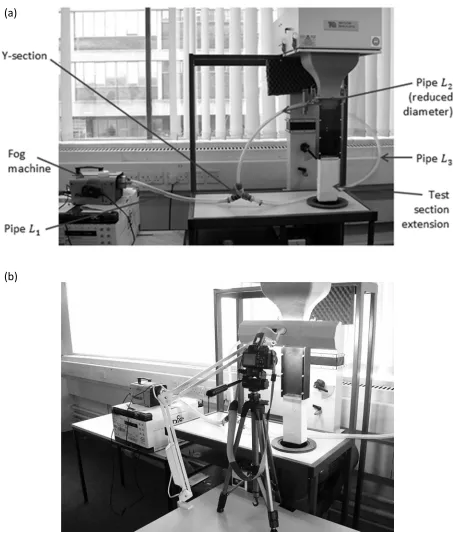
The final setup for producing high quality smoke lines is shown in Fig. 4a. This arrangement consists of a 0.7 m length of 20 mm diameter piping exiting the fog machine and entering a Y-junction. One arm of the junction feeds into a 0.7 m length of 12 mm diameter piping to the smoke rake, and the other arm feeds into a 2 m length of 20 mm diameter piping to a laboratory window for exhausting excess smoke. An extension was also added to the end of the wind tunnel test section to help extend the length of the smoke lines by decreasing the air disturbances from the surroundings.
Test Section Illumination and Image Capture
8
lamp was positioned so that the light was incident on the smoke lines at 45°, as illumination at normal incidence resulted in too much light reflection.
The camera for image capture was mounted on a tripod and placed directly in front of the test section. A Canon single-lens reflex camera in ‘macro’ setting was used to capture the smoke lines. The camera program was also set to automatic mode and repeat fire so that multiple images could be collected at one attempt. Fig. 4b shows the final setup of lighting and camera.
Test Conditions
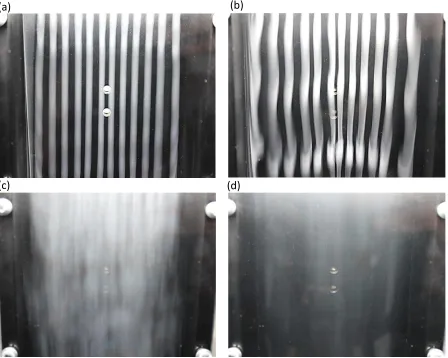
The wind tunnel was operated at several different freestream velocities in order to determine the optimum velocity, in conjunction with the above-described setup, to achieve high quality smoke lines. Fig. 5 displays the smoke lines generated in the test section for velocities of 1, 3, 6 and 9 ms-1. For each case, the two visible mounting holes for the test objects were temporarily sealed to ensure flow uniformity. The smoke lines generated at 1 ms-1 (Fig. 5a) remain coherent throughout the test section with no visible fluctuations. Conversely, at 3 ms-1 (Fig. 5b) the smoke lines start to fluctuate and also thicken near the end of the test section, such that adjacent smoke lines are close to merging. At the higher velocities of 6 ms-1 (Fig. 5c) and 9 ms-1 (Fig. 5d), the smoke lines lose all coherency immediately aft of the rake and as a result, only a plume of smoke is visible in the test section. For all smoke visualisation tests, the freestream velocity was fixed at 1 ms-1.
9
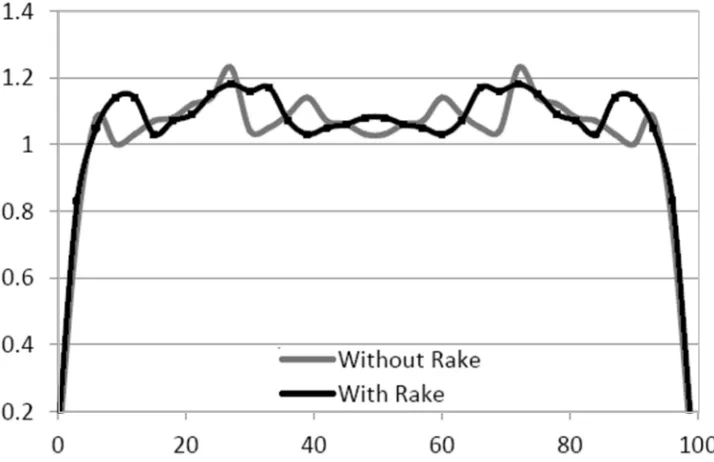
with the AF14 boundary layer apparatus (Fig. 1b), which incorporates a pitot tube for velocity measurements [6]. The pitot tube is restricted to being traversed across half the test section width, hence the velocity profile is assumed to be symmetric about the centreline of the test section. The measured profile in Fig. 6 shows there is negligible effect due to the presence of the smoke rake despite the rake having a blockage area ratio of approximately 20%, which is greater than that recommended in wind tunnel literature (typically 5-10%). In fact, velocity fluctuations across the test section are observed to be less with the presence of the rake; less than 0.2 ms-1.
To demonstrate the effectiveness of the smoke visualisation system, five different objects were successively secured and tested in the wind tunnel. The test objects used were based on classic bluff body and aerodynamic shapes including a cylinder, circular orifice, 2D wing section, finite wing and delta wing. All objects were manufactured out of aluminium and painted matt black to improve contrast with the smoke lines and therefore enhance the quality of the visualisation results.
Results
Flow around a Cylinder
10
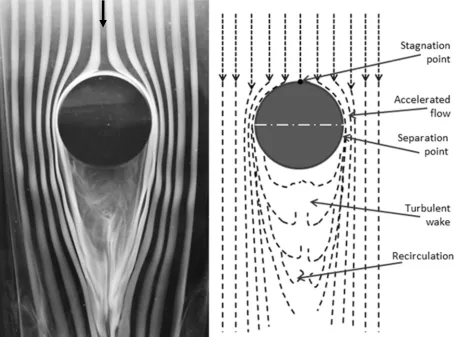
The stagnation point at the leading edge of the cylinder where flow is brought to rest is observed by the region devoid of smoke. Adjacent smoke lines are forced to flow either side of the cylinder, where the flow is locally accelerated. This accelerating flow is evident by the smoke lines near the cylinder surface narrowing in thickness and becoming more closely spaced and is indicative of a favourable boundary layer pressure gradient. Beyond the midpoint of the cylinder, flow begins to decelerate in the adverse pressure gradient region and eventually detaches from the cylinder surface at the separation points. Aft of the cylinder, a turbulent wake region is visible by the plume of smoke. The flow around the cylinder agrees with theory and is supported by the flow visualisation literature [5, 7].
Flow through a Circular Orifice
11 Flow around an Aerofoil
The aerofoil was secured in the test section using only one of the mounting screws, so that it could be rotated to different angles of attack,
α
,
to the oncoming airflow. The angles of attack chosen for the tests were 0°, 10° and 20°.α = 0°
Fig. 9a shows that the flow is relatively uniform around the aerofoil and does not encounter any great disturbances. Flow separation can be observed on the upper surface towards the trailing edge of the aerofoil, whereas the flow on the lower surface remains attached to the aerofoil at all times. In this instance, the flow remains mostly attached with a small turbulent wake at the trailing edge. The flow around the aerofoil at zero-incidence agrees with theory and is supported by the flow visualisation literature [7].
α = 10°
Fig. 9b exhibits trailing edge stall, where the flow becomes separated from the upper surface of the aerofoil downstream of the leading edge, thus creating a turbulent wake. This phenomenon is due to the adverse pressure gradient in the aft region of the aerofoil [9]. Vortex shedding is also visible in the wake region; a state of unsteady flow which occurs in separated flow [9]. It is observed that the separation point has moved further upstream towards the leading edge compared with Fig. 9a, as a result of the increased angle of attack. The flow around the aerofoil at incidence to the oncoming flow agrees with theory and is supported by the flow visualisation literature [3].
α = 20°
12
attack is increased, causing the separation point to move progressively from the trailing edge to the leading edge of the aerofoil. The smoke visualisation also shows an increase in the separated wake region and greater extent of vortex shedding aft of the trailing edge, which is representative of a complete aircraft wing stall. The flow around the aerofoil at high angle of attack agrees with theory and is supported by the flow visualisation literature [5].
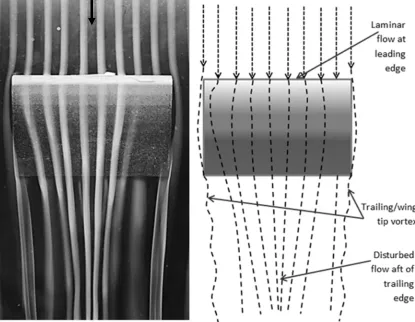
Flow over a Finite Wing
Fig. 10 shows smoke visualisation over a finite wing. Wing-tip vortices, formed due to the pressure difference between the upper and lower surface of the wing, can be observed. The wing-tip vortices are most evident at the trailing edge of the wing where they take on a more 3D appearance compared with the adjacent, 2D smoke lines along the centre of the wing. The flow over the finite wing agrees with theory and is supported by the flow visualisation literature [7].
Flow over a Delta Wing
13
Benefits to Engineering Education
Research
The development and implementation of a smoke visualisation system for the vertical wind tunnel will bring benefits to other research projects. In addition to the wind tunnel tests conducted as part of the present work, the smoke visualisation system was also utilised in an S-shaped diffuser of rectangular cross-section, which is another interchangeable test section for the same vertical wind tunnel. Fig. 12 shows smoke visualisation in the diffuser, with the research project aiming to demonstrate the effect of centripetal forces on the local flow [10]. The first bend is concave and consequently centripetal forces acting on the air keep the flow attached along the wall and prevent it from separating. In the second convex bend however, no centripetal force can exist to maintain attachment of the flow and thus the air is pushed away from the far side wall to the near side wall, as demonstrated by the smoke pattern [10].
It is anticipated that further research work where there is a need to provide qualitative assessment of low-speed flow phenomena, will be supported by the smoke visualisation system. Furthermore the design, manufacture and testing of a smoke visualisation system is a research project in itself and would be beneficial to replicate for other wind tunnels in the University on a bespoke basis, specific to the differing geometric and flow requirements.
Teaching and Learning
14
visualisation to existing aerospace laboratories is expected to enhance student learning in fluid dynamics and aerodynamics. Fig. 13 illustrates the structure of the aerospace laboratories module delivered to first year aerospace and aviation undergraduates at Brunel University and the proposed incorporation of smoke visualisation as part of wind tunnel testing. Currently students undertake quantitative techniques in the wind tunnel, using a Pitot tube to measure pressure distributions around an aerofoil at different angles of attack and boundary layer velocity profiles along a flat plate. Students’ understanding of the aerodynamics associated with these cases would be enhanced by introducing qualitative techniques such as smoke visualisation, so that students can observe how the airflow behaves at the corresponding pressure or velocity measurement. As an example, aerofoil flow separation at high angles of attack can be detected by changes in the pressure distribution and complemented by flow visualisation, such as in Fig. 9c, to enhance interpretation of such phenomenon.
The second author has also introduced relevant smoke visualisation images into the course lecture material on aerodynamics, in what might otherwise be quite theoretical content. Initial student response has been positive.
Costs
15
visualisation apparatus [11]. The system uses compressed carbon dioxide thus requiring more complex exhausting (Table 2) than the water-based vapour of the current arrangement. However, the largest drawback of the commercial system is its cost, which at a minimum of £6,000 GBP (obtained via quote), can be prohibitive and demonstrates that the devised system represents an economic alternative for engineering education purposes.
Conclusions
A smoke visualisation system suitable for use in a University vertical wind tunnel has been designed, manufactured and successfully demonstrated for the flow around classical aerodynamic and bluff body shapes. At a total cost of less than £150 GBP, the system has proved to be an economic alternative to equivalent commercial units; typically a factor of forty times less in cost. The smoke visualisation system has already been utilised in research work and is anticipated to be an invaluable addition to aerospace laboratory teaching, complementing existing quantitative techniques to ultimately enhance student learning in fluid dynamics and aerodynamics.
Acknowledgements
16
References
[1] TecQuipment Ltd, Modular Air Flow Bench (AF10). Data available online at:
http://www.tecquipment.com/prod/AF10.aspx [Accessed 17 October 2012].
[2] Barlow, J, Rae, W, & Pope, A. (1999). Low-Speed Wind Tunnel Testing. John Wiley and Sons, 3rd Edition, pp. 209-211.
[3] Merzkirch, W. (1987). Flow Visualisation. Academic Press Inc., London, 2nd Edition, pp. 25-32.
[4] Pankhurst, R. C. (1968). Wind Tunnel Technique. Pitman Press, Bath, pp. 142-147.
[5] Aerolab LLC, Flow Visualization Tunnel. Data available online at:
http://www.webdesign.tm/aerolab/visual/Flow_Vis.html[Accessed: 16 October 2012]. [6] TecQuipment Ltd, Boundary Layer Apparatus (AF14). Data available online at:
http://www.tecquipment.com/prod/AF14.aspx [Accessed 17 October 2012].
[7] Van Dyke, M. (1975). An Album of Fluid Motion. Parabolic Press, Stanford, California. [8] The Japan Society of Mechanical Engineers (1988). Visualized Flow. Pergamon Press,
London, 1st Edition, page 72.
[9] Jabbal, M. (2011). ME2605 Principles of Aircraft Design, Aerodynamics Lecture Notes, Lecture 14: Boundary Layer Separation.
[10]Lappay, O. (2012). Investigation of Flow in a Rectangular S-shaped Diffuser. Undergraduate Project Dissertation, Brunel University, London.
[11] TecQuipment Ltd, Flow Visualisation Apparatus (AF17). Data available online at:
17
Figures
(a)
(b)
18
[image:18.595.74.523.76.328.2]19
Fig. 3 Rendered SolidWorks image of the test section and smoke rake: (a) exploded view (b) assembled view
(a)
[image:19.595.79.500.63.727.2]20 (a)
[image:20.595.68.521.67.607.2](b)
21
(a) (b)
[image:21.595.75.523.85.443.2](c) (d)
22
23
24
25 (a)
26 (c)
27
28
[image:28.595.87.499.75.393.2]29
30
Aerospace Laboratories
Flight
Simulator
Microlight
Practical
Wind Tunnel
Experiments
Pitot-tube measurements
[image:30.595.78.520.80.278.2]Smoke visualisation