Surface Area and Conductivity of Open-Cell Carbon Foams
Adriana M. Druma, M. Khairul Alam*, Calin Druma
Department of Mechanical Engineering, Ohio University Athens, OH 45701
*Correspondence Author’s Email: [email protected]
Abstract
High thermal conductivity carbon foams have recently emerged as an effective thermal management material for space applications due to their lightweight. Open cell carbon foams are generally processed from pitch material obtained from coal or petroleum. These foams have spherical pores that create a three dimensional network of ligaments and nodes of complex geometry. The thermal conductivity of carbon foams can be studied numerically by finite element method; however the analysis requires a very fine grid that captures the microstructure of the foam. In this work, an analytical model for surface area and thermal conductivity is developed for a foam. To reduce the computational effort, an electrical circuit network analogy is used to calculate the bulk thermal conductivity of the foam. The analytical solution is then compared with semi-empirical models, FEM solution and other analytical solutions.
Nomenclature
A total cross-sectional area of the unit cell [m2];
g
A cross-sectional area of the gas phase in the unit cell [m2];
s
A cross-sectional area of the solid phase in the unit cell [m2]; Ke effective thermal conductivity [W/mK];
Kg gas thermal conductivity [W/mK]; Ks solid thermal conductivity [W/mK];
Ksj solid thermal conductivity (at the juncture or nodes) [W/mK];
Ksl solid thermal conductivity in the ligaments (longitudinal direction) [W/mK]; Kst solid thermal conductivity in the ligaments (transversal direction) [W/mK]; P porosity [%];
Rp radius of the pores [m];
t
R is the thermal resistance of the foam [°C/W]. Dp pore diameter [m];
F is the solid conduction efficiency factor [-]; Vp pore volume [m3];
Vlens lens volume [m3];
X, Y, Z coordinate system axes [-]; P1, P2pore intersection points [-]; h height [m];
rz in-plane pore radius [m]; t normalized thickness [-]; x integration parameter [m]; z heat flux direction [m];
ϕ Fraction defined in Eq. 6.
Introduction
Carbon foams are cellular structures that consist of randomly distributed spherical pores. The size of the pores of a typical carbon foam is 100 to 500 microns. Due to its complex structure of three-dimensional interconnected pores, carbon foams are very difficult to model analytically. Several researchers studied the effective conductivity of foams. Calmidi [1998] considered the structure of the metal foam to be made of dodecahedron-like cells with 12-14 pentagonal or hexagonal faces. The edges of the cells are formed by individual ligaments and it is considered that there is a lumping of material (intersection) at intersection points of the ligaments. This approach was successfully used by Kunny [1960], Zehner [1970], Hsu [1994], and Hsu [1995] to study the effective thermal conductivity of packed beds.
Fu et al [1998] developed an analytical model to determine the effective thermal conductivity of cellular ceramics. Two unit cells were developed to predict the effective thermal conductivity of porous materials using the electrical-circuit analogy. The first unit cell was a cubic-shaped box. The second unit cell was a cube with a pore in the center.
Tee et al. [1999] studied the thermal conductivity of carbon foam using a geometrical model that consisted of a unit cell made up of twelve struts with square cross-sectional area and eight cubic strut junctures. Tee et al. also used the analogy between thermal and electric resistors and simulated the unit cell by using series and parallel combinations of resistors.
Bhattacharya et al. [2002] studied the thermophysical properties of high porosity metal foams. For their study they considered a model consisting of a two-dimensional array of hexagonal cells where the struts form the sides of the hexagons. The junction was taken into account by considering a circular junction of metal at the intersection of the struts. This study showed that the effective thermal conductivity depends strongly on the porosity and the ratio of the cross-sections of the fiber and the intersection.
Balantrapu et al [2005] investigated the specific surface and effective thermal conductivity of open-cell lattice structure consisting of mutually orthogonal cylindrical ligaments used in heat exchanger applications.
Theory
Fu et al. [1998] used a representative cubic unit cell to determine an expression for the effective thermal conductivity. In this study two models are examined; the first is the simple cubic model with a hollow sphere in the center of a cube. The second model consists of a rectangular-shaped unit box (cubic) with the transverse section of the solid beams that enclose the unit cells being squares with normalized thickness t. Using the electrical-circuit analogy, the effective thermal conductivity of the second model can be expressed as (Fu et al. [1998]):
(
)
(
)
[
(
)
]
(
(
)
)
(
)
1 2 2 2 2 4 1 / 4 2 1 2 1 1 / 2 1 2 − ⎥ ⎥ ⎦ ⎤ ⎢ ⎢ ⎣ ⎡ − + − + − − + − = t K K t t t K K t t K K g s g s g e (1)To use Eq. (1) above, only one geometrical parameter is needed and that is the normalized thickness of the strand or ligament, t. This thickness can be determined by knowing the porosity of the foam and it is given by the following equation (Fu et al. [1998]):
(
)
(
)
100 2 1 6 21− t 3+ − t 2t = P (2)
Tee at al. [1999] used a similar model to study the effect of anisotropy of the carbon foam struts on the bulk thermal conductivity of the foam. The effective thermal conductivity, Ke, was calculated to be:
( )
( )
( )
( )
t K t K t t K K t K t K t K K t K K st g g st sj sl sj sl g e − + − + − + + − = 1 1 2 1 1 2 2 (3)where ⎟⎟
⎠ ⎞ ⎜⎜ ⎝ ⎛ + ⎟ ⎠ ⎞ ⎜ ⎝ ⎛ − +
= − π
3 4 1 100 2 cos 3 1 cos 2
1 1 P
t (3a)
are the thermal conductivities of the struts’ longitudinal direction and of
the juncture respectively [W/mK]. sj
sl K
K ,
In the hollow-sphere-in-cube model developed by Fu et al. [1998], the porosity is given by the following:
100 8 1 2 3 3 4
2 3 2 ⎥×
⎦ ⎤ ⎢ ⎣ ⎡ ⎟ ⎠ ⎞ ⎜ ⎝ ⎛− + −
= Rp Rp
P π (4)
The above model is valid for porosity between 52% and 96%. The bulk thermal conductivity of the foam is then calculated with the following equation (Fu et al. [1998]):
(
)
(
)
1 0 2 1 − ⎥ ⎥ ⎦ ⎤ ⎢ ⎢ ⎣ ⎡ + =∫
a dx K A A K A A K b g g s sb (5)
arrangements, Sullins et al. [2001] found the effective thermal conductivity as a function of thermal conductivity of the gas (Kg) and material of the foam (Ks) to be:
(
)
[
]
(
)
(
)
⎥ ⎥ ⎦ ⎤ ⎢
⎢ ⎣ ⎡
⋅ − + ⋅ ⋅
⋅ ⋅ ⋅
− + ⋅ ⋅ − + ⋅ =
g s
g s s
g e
K P K
F P
K K F K
F P K
P K
1 1
1 ϕ
ϕ (6)
where: ϕ is the fraction of heat transfer in parallel mode and (1-ϕ) is the fraction of heat transfer in series mode.
In Eq. (6) the solid conduction efficiency factor (F) accounts for the tortuous path for conduction through the cell walls.
Most of the above approaches are not applicable for the carbon foam geometry because the foam does not have well defined struts. Several authors, including Bauer [1993], have presented semi-analytical approaches using a ‘pore conduction’ factor that must be evaluated experimentally.
The present work modifies Fu’s approach to develop an analytical model for the thermal conductivity of a foam with spherical pores that may be closed pores or interconnected (overlapping) pores. In this approach, the local thermal resistances are summed up, or integrated to determine the resistance of the bulk foam. The focus of this study is to develop analytical solutions for total surface area and thermal conductivity of carbon foams based on unit cells, where the pores are distributed in a body centered cubic cell pattern. Such a unit cell is more representative of carbon foams than the cubic structure built of straight beams that has been used by Tee et al. [1999].
Determination of Surface area of the foam
The surface area of the foams is of particular interest in heat transfer applications where the main heat removal mechanism is convection. The open cell foams are therefore the main interest of this study. The foam will be modeled with pores arranged in a body centered cubic (BCC) cell distribution. In this model, the open cell foams have open cells (interconnected porosity) when the porosity P is greater than 68% ( ). Above this
porosity the pores having the diameter,
% 68
>
P
2 3 2a
Dp < , become interconnected.
The approach follows the mathematical model developed by Druma [2005] by considering a coordinate system with the OX axis oriented in the direction of the main diagonal of the unit cell cube and the origin in the center point of the middle sphere (as shown in Fig.1). The equations of the two spherical pores (center and corner pore) can be written as (Druma [2005]):
(
)
2 2 2 22 2 2 2
p p
R Z Y d X
R Z Y X
= + + −
= + +
(7.a)
where
2 3 2a
X (unit cell’s diagonal direction)
Y Z
Corner pore
Center pore
2a O
Figure 1: Spatial representation of the Ox axis and pore intersection (Druma [2005])
Combining the two equations yields:
2
d
X = (7.b)
Equation (7.a) shows that the “spherical pores intersect at the mid-distance between the two centers and the intersection curve has the equation Y2 +Z2 =Rp2 −X2 Æ
4
2 2 2
2 d
R Z
Y + = p − which is a circle in the plane perpendicular on the main diagonal of
the cubical cell and with the radius
4
2
2 d
R
ri = p − ” (Druma [2005]) as shown in Fig. 2.
X
h
Rp
= =
d
[image:5.612.132.504.82.244.2]Rp
It can be concluded that the intersection of the two pores is a “three-dimensional lens” and its volume can be found by adding the volumes of the two spherical caps forming the lens.
For the open-cell foams, the void volume can be calculated with the following (Druma [2005]): lens p p V R V 8 3 8 3 −
= π (8)
where
(
R h)
h
Vlens = 3 p −
3 2π 2
(9)
with
2
d R
h= p − is the height of the intersection lens [m]
Therefore
(
4)
(
2 212 R d R d
Vlens = p + −
)
π
and the porous volume yields:
(
2 3 312 12 3 2 d R d R
Vp = p − p −
)
π
(10)
The porosity of the unit cell is therefore:
(
)
100 8 12 12 3 2 3 3 3 2 × ⎥ ⎥ ⎥ ⎥ ⎦ ⎤ ⎢ ⎢ ⎢ ⎢ ⎣ ⎡ − − = a d R d R P p p π (11) Replacing 2 3 2ad = into Eq. 11 and rearranging the resulting equation yields:
0 3 2 100 4 3
8 3 ⎟⎟− 2 + 3 =
⎠ ⎞ ⎜⎜
⎝ ⎛
+ Dp a Dp
P
a π π π (12)
Equation 12 can be used to find the size of the unit cell for a given porosity and pore diameter.
The constraint imposed to the solution is:
3 2 2 p p D a
D ≤ < (13)
The restriction formulated by Eq.13 can be translated as: 94
. 0 68
.
0 <P< (14)
The equation can be solved numerically yielding a solution that satisfies the geometrical constrain given by Eq. 13.
Total surface area of the foam (open cell)
lens p
p R S
S =8π 2 −8 (15)
Total surface area of the lens is given by
⎟ ⎠ ⎞ ⎜ ⎝ ⎛ − = = − + − = =
∫
− 1 4 4 2
4 2 2 2 2 2 2 d R R h R dx x R x x R S
S R p p p
h R
p p
cap
Replacing Eq. 16 and
2 3 2a
d = into Eq. 15, the total area of the unit cell (open cell
foams) can be written as:
(
)
[
p p]
p[
p]
p p
p p
p D D D a D a D
d R R R
S 2 22 2 3 2 4 3 3
2 32
8 2 ⎟= − − = −
⎠ ⎞ ⎜
⎝
⎛ −
−
= π π π π (17)
For open cell foams with porosity above 94%, the diameter of the center pore becomes larger than the unit cell and the size of the unit cell can be calculated with the following equation:
0 2
1 2
3 3 2
100 2 4
3
8 3 2 ⎟⎟ + 3 =
⎠ ⎞ ⎜⎜
⎝ ⎛
+ −
⎟⎟ ⎠ ⎞ ⎜⎜
⎝ ⎛
+
+ P Dp a Dp
a π π π π (18)
with the constraint that
2 2 3
2a<Dp < a for structural integrity.
Total surface area of the unit cell, for open cell foams, with porosity above 94% can be calculated with the following formula:
(
)
[
]
(
p)
p[
(
)
p]
p p
p p
p D a D a D
D a
D D
D
S 2 2 2 3 3 2 6
2 12 3 4
2 − − − − = + −
= π π π (19)
The results for 100 microns pore diameter and different porosities are presented in Table 1 and compared with results from a solid modeling software program(Solid Edge).
Table 1: Surface areas (unit cell) for open and closed cell foams
Surface area [mm2] Percentage
Difference Porosity
[%] Analytical Software
(Solid Edge) [%]
70 0.06039 0.06029 0.166
75 0.05421 0.05419 0.037
80 0.04795 0.04793 0.042
85 0.04153 0.04156 0.072
90 0.03482 0.03485 0.086
95 0.0261 0.02614 0.153
Table 1 shows that the surface area calculated with the analytical formulas derived above matches very well with the solid modeling software prediction (difference below 0.2% between the solid modeling software and analytical result). The formulas developed above can therefore be used to estimate the surface area for open- cell cellular foams.
Determination of bulk thermal conductivity
elements are summed up by integration to produce the total resistance. Conductivity is calculated as the inverse of the total thermal resistance. The inaccuracy inherent in this method is the assumption that a one-dimensional thermal resistance is valid locally, even though the cross section of the solid phase in the foam changes as a function of position in the foam.
Figure 3: Spherical unit cell used to model the porous medium (Druma [2005])
If the size of the unit cell is 2a, the configuration of the unit cell (symmetrical with respect to the middle pore) is shown in the Fig. 4 below:
a
2a
A A
B B
Figure 4: BCC unit cell – half model
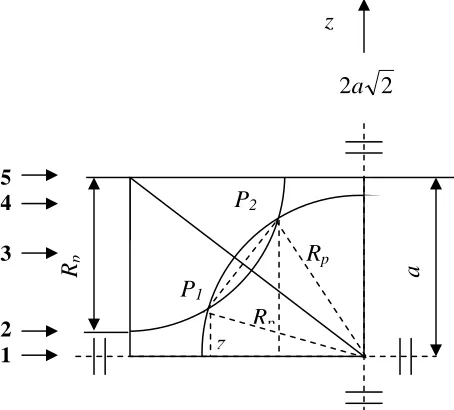
[image:8.612.103.474.330.628.2]From Fig. 4, it can be seen that the intersection between the center pore and the corner pores is circular, situated in a plane perpendicular to the diagonal of the unit cell as shown below (see Fig. 5).
a
Rp
P1 P2
[image:9.612.178.405.126.331.2]Rp
Figure 5:Section B-B (quarter of the diagonal plane) 2
2a
z
z Rp
5 4
3
2 1
The two points where the pores become interconnected (P1 and P2 in Fig. 5) are situated at the heights:
2 3 2
2
2 2 1
a R a
z = − p − (20)
2 3 2
2
2 2 2
a R a
z = + p − (21)
For open cell foams (BCC case), the size of the unit cell can be calculated with the formula given by Eq. 12.
The local radiuses of the circular pore surfaces containing the cross-section (B-B) can be calculated with the formulas:
Center pore: 2 2
z R
rz = − (22)
Corner pore: rz' = R2 −
(
a−z)
2 (23)where z is the vertical coordinate measured from the center of the middle pore [m].
Table 2: Cross-sections through the unit cell and void area (Druma, [2005]).
No A-A Cross-section Ap As z
1 π
(
R2 −z2)
[0,a-R)
2
{
2[
2(
)
2]
}
2R − z + a−z
π [a-R,
z1)
3
(
)
[
]
(
)
(
)
(
)
(
)
[
]
(
)
(
)
[
]
(
)
(
)
⎭ ⎬ ⎫ ⎩ ⎨ ⎧ − ⎥⎦ ⎤ ⎢⎣ ⎡ − + − − ⋅ ⎭ ⎬ ⎫ ⎩ ⎨ ⎧ ⎥⎦ ⎤ ⎢⎣ ⎡ − − − − − − ⎥ ⎥ ⎦ ⎤ ⎢ ⎢ ⎣ ⎡ − − + − − ⋅ − − + ⎥ ⎥ ⎦ ⎤ ⎢ ⎢ ⎣ ⎡ − − − + ⋅ − + − − − 2 2 2 2 2 2 2 2 2 2 2 2 2 2 2 2 2 2 2 2 2 2 2 2 2 2 2 2 2 2 2 2 2 2 2 cos 4 2 2 2 cos 4 2 a z a R z R z a R z R a z a R a z z a a a z a R z R a z z a a a z R z a z R π[z1, z2]
4
{
2[
2(
)
2]
}
2R − z + a−z
π
4a2 -Ap
5
[
2(
)
2]
z a
R − −
π (R, a]
Using the definition of the thermal resistance, the bulk thermal conductivity can be calculated from the following formula:
A R
a K
t
b = (24)
For a finite increment dz along the vertical axis, the thermal resistance dRt is:
g g s s t
K A K A
dz dR
+
= (25)
Integrating the equation above between 0 and a, and replacing the thermal resistance in Eq. 24 yields the bulk thermal conductivity:
∫
+=
= a
g g s s t
b
a dz K A K A
A AR
a K
0
1
(26)
For foams, the thermal conductivity of the pore’s content (gas) is much lower than the solid thermal conductivity and can therefore be approximated to zero. In this case, the formula above becomes:
∫
=
= a
s s t
b
a dz K A
A AR
a K
0
1
(27)
The effective thermal conductivity of the foam with constant solid thermal
conductivity can therefore be calculated as follows:
∫
=
= a
s s
b e
a dz A
A K
K K
0
1
(28)
program (ALGOR), and the semi-analytical model developed by Bauer [1993]. Bauer developed a semi-analytical approach to obtain the following equation:
n
s b e
P K
K K
/ 1
100
1 ⎟
⎠ ⎞ ⎜
⎝ ⎛ − =
= (29)
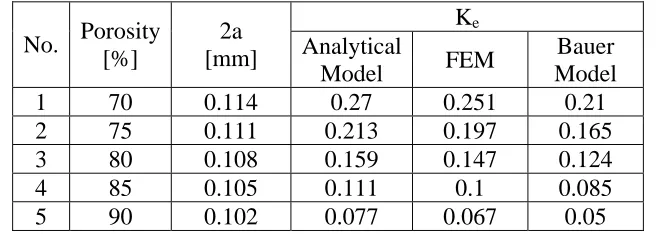
[image:12.612.142.472.289.406.2]where ‘n’ is an unknown parameter, usually termed the ‘pore conduction factor’. A value of ‘n=0.77’ provides a good fit to some of the experimental data analyzed by Bauer, and is also comparable to numerical results [Druma et al., 2004]. It can be observed that the analytical model overpredicts the thermal conductivity; this is to be expected since the analytical model does not take the tortuosity of the heat transfer path into account.
Table 3: Effective Thermal Conductivity: Analytical - FEM comparison
Ke No. Porosity
[%]
2a
[mm] Analytical
Model FEM
Bauer Model 1 70 0.114 0.27 0.251 0.21 2 75 0.111 0.213 0.197 0.165 3 80 0.108 0.159 0.147 0.124 4 85 0.105 0.111 0.1 0.085 5 90 0.102 0.077 0.067 0.05
0 0.1 0.2 0.3 0.4
70 72 74 76 78 80 82 84 86 88 90
P [% ]
Effective Conductivity
H ollow -Sphere-in-C ube M odel Bauer M odel (n=0.77)
FEM M odel
[image:13.612.110.537.81.432.2]C urrent M odel: BC C R ule of m ixtures
Figure 6: Open cell thermal conductivity – comparison between analytical and FEM results (Druma [2005])
Conclusions
References
Balantrapu, K., Deepty, R.S., Herald, C.M., Wirtz, R.A., Porosity, Specific Surface Area and Effective Thermal Conductivity of Anisotropic Open Cell Lattice Structures, Proceedings of IPACK2005, IPACK2005-73191, California, 2005.
Bauer, T.H., “A general analytical approach toward the thermal conductivity of porous media”, Int. Journal of Heat and Mass Transfer, vol. 36(17), 4181-4191, 1993.
Bhattacharya, A., Calmidi, V.V., and Mahajan, R.L., Thermophysical properties of high porosity metal foams, International Journal of Heat and Mass Transfer, 45 (2002) 1017-1031.
Calmidi, V.V., Transport phenomena in high porosity fibrous metal foams, Ph.D. Dissertation, University of Colorado, Boulder, Colorado, 1998.
Druma, A.D., Alam, M.K., Druma, C., Analysis of thermal conduction in carbon foams, International Journal of Thermal Sciences, vol. 43(7), pp. 689-695, 2004.
Druma, A.M., Analysis of carbon foams by finite element method, Ph.D. Dissertation, Ohio University, Athens, Ohio, 2005
Fu, X., Viskanta R., Gore, J.P., Prediction of effective thermal conductivity of cellular ceramics, Int. Comm. Heat Mass Transfer, Vol. 25, No. 2, pp. 151-160, 1998. Hsu, C.T., and Cheng P., “Modified Zehner-Schlunder models for stagnant thermal
conductivity of spatially periodic porous media, ASME Journal of Heat Transfer, 37 (17), 2751-2759, 1994.
Hsu, C.T., and Cheng P., “A lumped parameter model for stagnant thermal conductivity of spatially periodic Porous Media”, ASME Journal of Heat Transfer, 117, 264-269, 1995.
Kunnii D., and Smith J.M., “Heat Transfer Characteristics of Porous Rocks”, AIChE Journal, 6, 71-78, 1960.
Sullins, A.D., and Daryabeigi, , K, “Effective Thermal Conductivity of High Porosity Open Cell Nickel Foam”, AIAA 2001-2819, 35th AIAA Thermophysics conference, Anaheim California, June 2001.
Tee, C.C., Klett, J.W., Stinton, D.P., and Yu N., “Thermal conductivity of porous carbon foam”, Proceedings of the 24th Biennial Conference on Carbon, July 11-16, Charleston, SC, 130, 1999.
![Figure 2: Planar section of the pores intersection (Druma [2005])](https://thumb-us.123doks.com/thumbv2/123dok_us/8731691.386493/5.612.132.504.82.244/figure-planar-section-pores-intersection-druma.webp)
![Figure 3: Spherical unit cell used to model the porous medium (Druma [2005])](https://thumb-us.123doks.com/thumbv2/123dok_us/8731691.386493/8.612.103.474.330.628/figure-spherical-unit-cell-model-porous-medium-druma.webp)
![Table 2: Cross-sections through the unit cell and void area (Druma, [2005]).](https://thumb-us.123doks.com/thumbv2/123dok_us/8731691.386493/10.612.89.525.89.717/table-cross-sections-unit-cell-void-area-druma.webp)
![Figure 6: Open cell thermal conductivity – comparison between analytical and FEM results (Druma [2005])](https://thumb-us.123doks.com/thumbv2/123dok_us/8731691.386493/13.612.110.537.81.432/figure-open-thermal-conductivity-comparison-analytical-results-druma.webp)
