www.atmos-meas-tech.net/7/301/2014/
doi:10.5194/amt-7-301-2014
© Author(s) 2014. CC Attribution 3.0 License.
Atmospheric Measurement
Techniques
Design and characterization of a smog chamber for studying gas-phase chemical mechanisms and aerosol formation
X. Wang
1, T. Liu
1,2, F. Bernard
1, X. Ding
1, S. Wen
1, Y. Zhang
1,2, Z. Zhang
1,2, Q. He
1,2, S. Lü
1,2, J. Chen
3, S. Saunders
4, and J. Yu
51
State Key Laboratory of Organic Geochemistry, Guangzhou Institute of Geochemistry, Chinese Academy of Sciences, Guangzhou 510640, China
2
University of Chinese Academy of Sciences, Beijing 100049, China
3
Shanghai Key Laboratory of Atmospheric Particle Pollution and Prevention (LAP
3), Department of Environmental Science
& Engineering, Fudan University, Shanghai 200433, China
4
School of Chemistry and Biochemistry, The University of Western Australia, Crawley WA 6009, Australia
5
Department of Chemistry, Hong Kong University of Science and Technology, Kowloon, Hong Kong, China Correspondence to: X. Wang ([email protected])
Received: 3 July 2013 – Published in Atmos. Meas. Tech. Discuss.: 23 August 2013 Revised: 12 December 2013 – Accepted: 16 December 2013 – Published: 29 January 2014
Abstract. We describe here characterization of a new state- of-the-art smog chamber facility for studying atmospheric gas-phase and aerosol chemistry. The chamber consists of a 30 m
3fluorinated ethylene propylene (FEP) Teflon film reac- tor housed in a temperature-controlled enclosure equipped with black lamps as the light source. Temperature can be set in the range from −10 to 40
◦C at accuracy of ±1
◦C as measured by eight temperature sensors inside the enclo- sure and one just inside the reactor. Matrix air can be pu- rified with non-methane hydrocarbons (NMHCs) < 0.5 ppb, NO
x/O
3/carbonyls < 1 ppb and particles < 1 cm
−3. The pho- tolysis rate of NO
2is adjustable between 0 and 0.49 min
−1. At 298 K under dry conditions, the average wall loss rates of NO, NO
2and O
3were measured to be 1.41 × 10
−4min
−1, 1.39 × 10
−4min
−1and 1.31 × 10
−4min
−1, respectively, and the particle number wall loss rate was measured to be 0.17 h
−1. Auxiliary mechanisms of this chamber are de- termined and included in the Master Chemical Mechanism to evaluate and model propene–NO
x–air irradiation experi- ments. The results indicate that this new smog chamber can provide high-quality data for mechanism evaluation. Results of α-pinene dark ozonolysis experiments revealed secondary organic aerosol (SOA) yields comparable to those from other chamber studies, and the two-product model gives a good fit for the yield data obtained in this work. Characteriza- tion experiments demonstrate that our Guangzhou Institute
of Geochemistry, Chinese Academy Sciences (GIG-CAS), smog chamber facility can be used to provide valuable data for gas-phase chemistry and secondary aerosol formation.
1 Introduction
Smog chambers provide a controlled environment to study the formation and the evolution of specific compounds of interest by isolating the influence of emissions, meteorol- ogy and mixing effects. Smog chambers were initially con- structed for developing and evaluating atmospheric gas- phase chemical mechanisms or models for predicting sec- ondary pollutants (Akimoto et al., 1979; Carter et al., 1982;
Jeffries et al., 1982, 1985). In the mid-1980s, Seinfeld
and colleagues at the California Institute of Technology in
Pasadena developed a 65 m
3outdoor chamber made of flu-
orinated ethylene propylene (FEP) Teflon film to study the
aerosol formation from gas-phase precursors such as aro-
matic and biogenic hydrocarbons (Leone et al., 1985; Stern
et al., 1987). In the subsequent three decades, outdoor and
indoor chambers have been widely used to study forma-
tion of secondary pollutants such as ozone (Hess et al.,
1992; Simonaitis et al., 1997; Carter, 2000; Dodge, 2000)
and secondary organic aerosols (SOA) (Odum et al., 1996,
1997; Griffin et al., 1999; Martín-Reviejo and Wirtz, 2005;
Paulsen et al., 2005; Rollins et al., 2009) and evolution of SOA (Donahue et al., 2012). Although the aims of these smog chambers are similar, their designs and capacities vary widely, displaying larger differences in factors such as sizes, reactor wall materials and light sources.
Outdoor chambers are unique in the availability of natural sunlight. Many simulation experiments on SOA formation have been carried out in large outdoor chambers (Leone et al., 1985; Stern et al., 1987; Pandis et al., 1991; Johnson et al., 2004; Martín-Reviejo and Wirtz, 2005; Rollins et al., 2009).
However, diurnal variations of the actinic flux and tempera- ture make it difficult to model experimental data and to re- produce the experiments. Indoor chambers instead can pro- vide precise control of temperature and humidity, but may suffer from the difference between the artificial light spec- trum and solar spectrum, resulting in different rates of some photolysis reactions between the artificial and natural sys- tems (Takekawa et al., 2003; Carter et al., 2005; Paulsen et al., 2005). Nonetheless, artificial light allows the experiments to be repeatable under the same irradiation conditions. Smog chambers are, however, not without any limitations or uncer- tainties in chamber wall effects when evaluating the mech- anisms or models (Carter et al., 1982; Carter and Lurmann, 1991; Dodge, 2000). For example, off-gassing of NO
xand other species from chamber walls may introduce contami- nations into the background gas and affect the utility of the data. Similarly, chamber wall effects may lead to large uncer- tainties when evaluating experiments at low concentrations.
Large volume reactors with small surface-to-volume ratios can minimize the wall effects and the wall loss of particles and gas-phase species. Moreover, larger volume allows ex- periments of longer durations to be conducted and more in- struments to be used. Considering these concerns, Tobias and Ziemann (1999) used a 7000 L Teflon environmental cham- ber to generate organic aerosols through gas-phase reactions of 1-tetradecene and ozone. Cocker et al. (2001a) developed dual 28 m
3indoor chambers to study the mechanisms of aerosol formation. Recently, to minimize reactor effects in the studies of volatile organic compounds (VOCs) reactivity and SOA formation, Carter et al. (2005) constructed a state- of-the-art indoor chamber facility with two collapsible 90 m
3FEP Teflon film reactors.
In China, some small-volume smog chambers have been developed to study gas-phase kinetic mechanisms since 1980s (Wang et al., 1995; Ren et al., 2005; Xu et al., 2006).
Wu et al. (2007) constructed a 2 m
3, precisely temperature- controlled indoor smog chamber made of FEP Teflon film to study the SOA formation. However, the small volumes of these smog chambers impart the disadvantage of relatively large wall effects and also make it difficult to do experi- ments of long durations. At present, ozone and fine parti- cles (PM
2.5) have become serious air quality problems in China (Chan and Yao, 2008; Q. Zhang et al., 2012). As ozone and a large portion of PM
2.5components are secondary from gaseous precursors under atmospheric gas-phase and/or
multi-phase processes, it is imperatively necessary to set up further quality smog chambers in China for the deep un- derstanding of complex air pollution, particularly in China’s megacities.
This paper describes a new state-of-the-art indoor smog chamber facility established at the Guangzhou Institute of Geochemistry, Chinese Academy Sciences (GIG-CAS). This GIG-CAS chamber facility is designed to study formation mechanisms of ozone and SOA as well as the evolution of SOA; to evaluate the mechanisms, particularly under low- NO
xand VOC conditions; and to serve as a platform for evaluating the performance of newly developed gas or parti- cle monitors. A series of initial characterization experiments have been carried out and are discussed in this paper.
2 Facility
The 8.5 m × 4.0 m × 3.5 m thermally insulated enclosure is housed in a 14.0 m × 6.0 m × 8.5 m laboratory in the first floor and has been equipped with an array of continuous gas-phase and aerosol-phase monitors. Situated directly over the enclosure on the second floor are offline VOCs/semi- VOCs/ions/anions samplers and analyzers. The list of equip- ment is shown in Table 1. Inside the enclosure are a 30 m
3reactor made of FEP Teflon film (FEP 100, Type 200A;
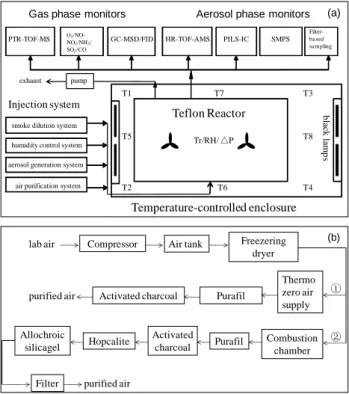
DuPont, USA) with dimensions of 5.0 m × 3.0 m × 2.0 m and two banks of 60 W 1.22 m black lamps. A schematic of the GIG-CAS smog chamber is shown in Fig. 1a.
2.1 Enclosure
The inner walls of the enclosure are covered with reflective and polished stainless steel sheets to obtain a maximum and homogenous light intensity. The floor is covered with less reflective but more durable stainless steel sheets. For indoor Teflon chambers, air conditioning systems are widely used to control the temperature within the tropospheric tempera- ture range, which is roughly from −60 to 40
◦C (Takekawa et al., 2003; Carter et al., 2005; Paulsen et al., 2005; Wu et al., 2007). The enclosure temperature of our chamber is controlled by three cooling units (total power 40 kW), which are located outside the laboratory next to the enclo- sure. The cooling air is distributed uniformly and constantly in three different ducts through the enclosure false ceiling made of perforated reflective aluminum sheets, and is re- turned to the cooling units through a porous, highly efficient 3.0 m × 0.2 m × 0.6 m filter that contains activated charcoal inside to clean the enclosure air. A heater is also installed inside each duct. Eight thermocouples (Fig. 1a) are placed approximately 1 m above the housing floor between the en- closure and the reactor walls. The enclosure temperature is controlled by an electronic control system through adjust- ing the power of cooling units and heaters according to the
Atmos. Meas. Tech., 7, 301–313, 2014 www.atmos-meas-tech.net/7/301/2014/
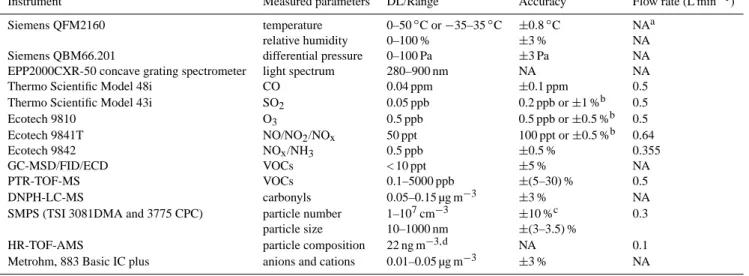
Table 1. Overview of instruments.
Instrument Measured parameters DL/Range Accuracy Flow rate (L min−1)
Siemens QFM2160 temperature 0–50◦C or −35–35◦C ±0.8◦C NAa
relative humidity 0–100 % ±3 % NA
Siemens QBM66.201 differential pressure 0–100 Pa ±3 Pa NA
EPP2000CXR-50 concave grating spectrometer light spectrum 280–900 nm NA NA
Thermo Scientific Model 48i CO 0.04 ppm ±0.1 ppm 0.5
Thermo Scientific Model 43i SO2 0.05 ppb 0.2 ppb or ±1 %b 0.5
Ecotech 9810 O3 0.5 ppb 0.5 ppb or ±0.5 %b 0.5
Ecotech 9841T NO/NO2/NOx 50 ppt 100 ppt or ±0.5 %b 0.64
Ecotech 9842 NOx/NH3 0.5 ppb ±0.5 % 0.355
GC-MSD/FID/ECD VOCs < 10 ppt ±5 % NA
PTR-TOF-MS VOCs 0.1–5000 ppb ±(5–30) % 0.5
DNPH-LC-MS carbonyls 0.05–0.15 µg m−3 ±3 % NA
SMPS (TSI 3081DMA and 3775 CPC) particle number 1–107cm−3 ±10 %c 0.3 particle size 10–1000 nm ±(3–3.5) %
HR-TOF-AMS particle composition 22 ng m−3,d NA 0.1
Metrohm, 883 Basic IC plus anions and cations 0.01–0.05 µg m−3 ±3 % NA
aNA = not applicable.bWhichever is greater.cFor total number concentration.dFor organics.
difference between the average temperature of the eight ther- mocouples and the set temperature.
2.2 Teflon reactor
Chamber reactor walls can be made of Teflon film (Cocker et al., 2001a; Carter et al., 2005), Pyrex (Doussin et al., 1997), quartz (Barnes et al., 1987), aluminum (Akimoto et al., 1979) or stainless steel (Wang et al., 2011). Except for the AIDA chamber (Saathoff et al., 2003), most larger smog chambers on the order of tens of cubic meters were made of Teflon film for technical and economical reasons (Cocker et al., 2001a;
Carter et al., 2005; Pandis et al., 1991; Johnson et al., 2004;
Martín-Reviejo and Wirtz, 2005; Rollins et al., 2009). The reactor wall material of this chamber is 2 mil (54 µm) FEP Teflon film that is transparent, chemically inert and UV per- meable. The Teflon film is flexible enough to avoid alter- ing the pressure inside the reactor during air extraction. The Teflon reactor is self-made by a heat sealing laminator. All seams on the reactor are reinforced by a polyester film tape with a silicone adhesive (polyester tape 8403; 3M, USA).
The reactor wall is more than 1 m away from the lights to avoid the heating on the surface of the Teflon film. The re- actor is mounted inside the enclosure with a fixed bottom stainless steel frame and a movable top stainless steel frame.
The top frame is lifted and lowered by a mechanical step mo- tor that has power-off protection. During experiments, as the volume decreases due to sampling, leaks and permeation, the top frame is lowered slowly to maintain a differential pos- itive pressure between the inside of the reactor and the en- closure, thereby reducing the contamination of the enclosure air. Siemens QBM 66.201 (Siemens AG, Germany) is used to measure the differential pressure between the reactor and the enclosure with an accuracy of ±3 Pa. When the reactor
volume decreases to 1/3 of its maximum value, the experi- ment (typically about 10 h, depending on the numbers of in- struments taking samples from the chamber) is terminated.
When lowering the top frame of the reactor during wall loss evaluation experiments, the total particle number concentra- tion (N
t) changed smoothly from an initial number concen- tration N
0and the slope of ln (N
0/N
t) versus t remained con- stant, suggesting that the movement of the chamber will not affect the aerosol wall loss rates.
Four Teflon ports are installed inside the reactor. One port located in the middle of the chamber floor has 12 holes of 0.635 cm in diameter. This port is used for injection of pu- rified air, sample and seed aerosols. A second port next to the instruments, with 13 holes of 0.635 cm in diameter, is used for sampling. Since the residence time of air inside the sampling lines is within seconds, the influence of sampling process on the homogeneity of air reaching the online instru- ments is negligible. The other two ports, each with four holes of 0.635 cm in diameter, are also used for sampling. Fur- thermore, an air blower is connected to the reactor through a 10 cm solenoid valve controlled by computer, providing a pumping flow rate of 1 m
3min
−1to evacuate the reactor.
Two three-wing stainless steel fans coated with Teflon are installed at the bottom inside the reactor to provide sufficient mixing of the gas species and particles. No detectable non- methane hydrocarbons (NMHCs) are emitted from the fans.
Rotating speed of the fans can be varied to a maximum of 1400 rpm by adjusting the input power.
2.3 Light source
A total of 135 black lamps (1.2 m long, 60 W
Philips/10R BL; Royal Dutch Philips Electronics Ltd,
the Netherlands) are arranged in two banks as the light
40
692
693
Fig. 1. (a) Schematic of the GIG-CAS smog chamber facility. T1-T8 are thermocouples in the 694
enclosure and Tr is temperature sensor inside the reactor. (b) Schematic of two air purification 695
systems. Route 1 represents the procedures of the Thermo zero air supply system; Route 2 696
represents the procedures of the larger flow rate air purification system.
697
T1 T7 T3
T8
T4 T6
T5
T2
Temperature-controlled enclosure Teflon Reactor
Gas phase monitors
O3/NO- NO2/NH3/ SO2/CO PTR-TOF-MS
Aerosol phase monitors
HR-TOF-AMS PILS-IC
GC-MSD/FID SMPS
Injection system
smoke dilution system
aerosol generation system air purification system humidity control system
Filter- ba sed sa mpling
black lamps
Tr/RH/ △P pump
exhaust
(a)
lab air Compressor Air tank Freezering dryer
Thermo zero air supply Purafil
Activated charcoal purified air
Combustion chamber Purafil
Activated charcoal
purified air Filter
①
Hopcalite ② Allochroic
silicagel
(b)
Fig. 1. (a) Schematic of the GIG-CAS smog chamber facility. T1- T8 are the thermocouples in the enclosure and T
ris the tempera- ture sensor inside the reactor. (b) Schematic of two air purification systems. Route 1 represents the procedures of the Thermo zero-air supply system; route 2 represents the procedures of the larger flow rate air purification system.
source. One bank of 80 lamps is mounted on one enclosure wall, and another bank of 55 lamps is mounted near the opposite enclosure wall on an aluminum alloy frame. The artificial light produced by the black lamps gives a good representation of the ground-level solar light spectrum in the low-wavelength region, but they do not emit in the longer wavelength regions (> 400 nm) that photolyze some species, such as peroxy radicals or methylglyoxal in the range of 450–550 nm (Cocker et al., 2001a). However, because of the low-cost and efficient UV irradiation, black lamps are frequently used in environment chamber experiments (Cocker et al., 2001a; Carter et al., 2005; Hynes et al., 2005;
Wu et al., 2007). The 135 black lamps are divided into 4 separately controlled groups; therefore the light intensity can be regulated to different levels. During the experiments, a J
NO2filter radiometer (Metcon GmbH, Germany) is used to monitor the light intensity inside the enclosure.
2.4 Air purification system
As matrix gas for simulation experiments and carrier gas for reactants, purified dry air is supplied by passing com- pressed house air through a condenser and a Thermo zero-air
supply (Model 1160; Thermo Scientific, USA). The maxi- mum flow rate of purified air is 45 L min
−1. The purified dry air includes < 0.5 ppb NMHCs, < 1 ppb NO
x, O
3and car- bonyl compounds, and no detectable particles. A separate source of purified air with < 5 ppb NMHCs (mainly ethane and propane) is also used for high-concentration precursor (hundreds of parts per billion) experiments. Compressed in- door air is forced through a combustion chamber filled with Hopcalite and a series of bed scrubbers containing activated charcoal, Purafil, Hopcalite and allochroic silica gel, fol- lowed by a PTFE filter to provide this source of purified air with a maximum flow rate of 200 L min
−1. The schematic of these two air purification systems is shown in Fig. 1b.
Before each experiment the reactor is evacuated and filled with purified dry air at least five times, then the reactor is flushed with purified dry air at a flow rate of 100 L min
−1for at least 48 h until no residual hydrocarbons, O
3, NO
xor par- ticles are detected in the reactor to avoid carry-over problems from day-to-day experiments. When the reactor is not in use, it is continuously flushed with purified dry air.
2.5 Injection system
Gaseous reactants are injected using gas-tight syringes through a septum installed in one port of a union tee that is connected to a FEP Teflon line, and then flushed by purified dry air or nitrogen into the reactor. For the introduction of liq- uid reactants, known volumes are measured and injected by means of microliter syringes through a heating system with an injection port similar to that used in gas chromatography.
The temperature of the injection port is adjustable according to boiling points of the injected reactants. Ozone is generated by a commercial ozone generator (VMUS-4; Azco Industries Ltd, Canada) with pure oxygen as the feed gas to prevent the generation of NO
x. Ozone introduced into the reactor is con- trolled by the generating time and the flow rate.
Humidification is achieved by vaporizing Milli-Q ultra- pure water contained in a 0.5 L Florence flask and the water vapor is flushed with purified dry air into the reactor. Relative humidity inside the reactor can be varied from < 5 to 80 %.
The humidification process does not introduce detectable hy- drocarbons or particles into the reactor.
Seed particles are generated by an atomizer (ATM-220;
Topas GmbH, Germany) and pass through a diffusion dryer (DDU-570; Topas GmbH, Germany) to remove water and a neutralizer (TSI 3080; TSI Incorporated, USA) to eliminate the charge before introducing into the reactor.
2.6 Instrumentation
The array of gas-phase and aerosol-phase instruments equipped with the chamber facility is briefly described in Ta- ble 1.
Ozone is measured by an EC9810 ozone analyzer (Ecotech, Australia), which is calibrated weekly using a
Atmos. Meas. Tech., 7, 301–313, 2014 www.atmos-meas-tech.net/7/301/2014/
Thermo Scientific Model 146i multi-gas calibrator. The detection limit and accuracy of the ozone instrument are 0.5 ppb and ±0.5 %, respectively. An EC9841T chemilumi- nescence analyzer (Ecotech, Australia) is used to measure NO and NO
2. The NO
xinstrument is calibrated weekly using a certified cylinder of NO. The detection limit and accuracy of the NO
xinstrument are 50 ppt and ±0.5 %, respectively.
VOCs inside the reactor are measured both offline and on- line. Offline measurement are performed by using a model 7100 preconcentrator (Entech Instruments Inc., USA) cou- pled with an Agilent 5973N gas chromatography–mass se- lective detector/flame ionization detector/electron capture detector (GC-MSD/FID/ECD; Agilent Technologies, USA).
During simulation, air inside the reactor is sampled about ev- ery 15 min with evacuated 2 L stainless steel canisters and simultaneously analyzed with the three detectors of this self- modified system for a wide spectrum of VOCs. This analyt- ical system is well established, and a detailed description of the method can be found elsewhere (Wang and Wu, 2008;
Y. L. Zhang et al., 2010, 2012, 2013). Carbonyl compounds are analyzed offline by high-performance liquid chromatog- raphy (HPLC – HP1200; Agilent Technologies, USA) cou- pled to UV detection at 360 nm after being collected by draw- ing air through a Sep-Pak DNPH-Silica cartridge (Waters Corporation, USA) with a sampling pump (Thomas, USA) every 15 min. A detailed description of the method can be found elsewhere (Tang et al., 2003).
Online monitoring of parent NMHCs such as propene, α- pinene, and some aromatic hydrocarbons as well as their ox- idation products are also available with a proton-transfer- reaction time-of-flight mass spectrometer (PTR-TOF-MS;
Ionicon Analytik GmbH, Austria). Detailed descriptions of the PTR-TOF-MS technique can be found elsewhere (Lindinger et al., 1998; Jordan et al., 2009). At present the accuracies for some species by the PTR-TOF-MS are still not comparable to that by offline methods: for example, PTR-MS quantification of HCHO is highly influenced by the humid- ity (Vlasenko et al., 2010). Therefore in this work we only report our VOCs results by offline techniques, and further calibration of the PTR-TOF-MS is still under way.
Particle number concentrations and size distributions are obtained using a scanning mobility particle sizer equipped with a differential mobility analyzer (TSI 3081; TSI Incorpo- rated, USA) and a condensation particle counter (TSI 3775;
TSI Incorporated, USA). Flow rates of sheath and aerosol flow are 3.0 and 0.3 L min
−1, respectively, allowing for a size distribution scan ranging from 14 to 700 nm within 135 s.
The accuracy of the particle number concentration is ±10 %.
A high-resolution time-of-flight aerosol mass spectrome- ter (HR-TOF-MS; Aerodyne Research Incorporated, USA) is used to measure the chemical compositions and evolutions of submicron aerosols (PM
1) (Jayne et al., 2000; DeCarlo et al., 2006). The HR-TOF-MS is also able to determine the average element ratios of organics, like H / C, O / C, and N / C (Aiken et al., 2007, 2008). The instrument is operated
41
698
699
Fig. 2. (a) Evolutions of the average temperature of nine thermocouples, eight of them 700
outside the reactor and one inside the reactor (See Fig. 1a), under black light irradiation 701
condition. Error bars are the standard deviations of the nine temperatures. The solid lines 702
represent set temperatures. (b) Average temperature values measured by the nine 703
thermocouples over a 6 h period under black light irradiation condition. Error bars show the 704
temperature variability in the 6 h period.
705 706 707
ºC ºC ºC
Fig. 2. (a) Evolutions of the average temperature of nine thermocou- ples, eight of them outside the reactor and one inside the reactor (see Fig. 1a), under black light irradiation condition. Error bars are the standard deviations of the nine temperatures. The solid lines repre- sent set temperatures. (b) Average temperature values measured by the nine thermocouples over a 6 h period under black light irradia- tion condition. Error bars show the temperature variability in the 6 h period.
in the high-sensitivity V mode and high-resolution W mode alternatively. The HR-TOF-MS is calibrated using 300 nm monodisperse ammonium nitrate particles.
3 Characterization
3.1 Temperature control and its homogeneity
In the GIG-CAS chamber, three temperature control units
and two Teflon-coated fans are used to provide a homoge-
neous and stable temperature inside the reactor. Figure 2a
shows evolutions of the average temperatures as measured
by the eight thermocouples (T1–T8, Fig. 1a) and the temper-
ature inside the reactor (T
r, Fig. 1b) measured by Siemens
QFM2160 (Siemens AG, Germany) under black light irradi-
ation when temperatures were set to 40, 15 and −10
◦C, re-
spectively. After the initial increase or decrease, the average
temperatures stabilized after about 1.5 h, 20 min and 40 min
42
708
Fig. 3. Concentration-time plot of ozone after each injection. The two mixing fans rotated at a 709
speed of 700 rpm in the experiments.
710 711
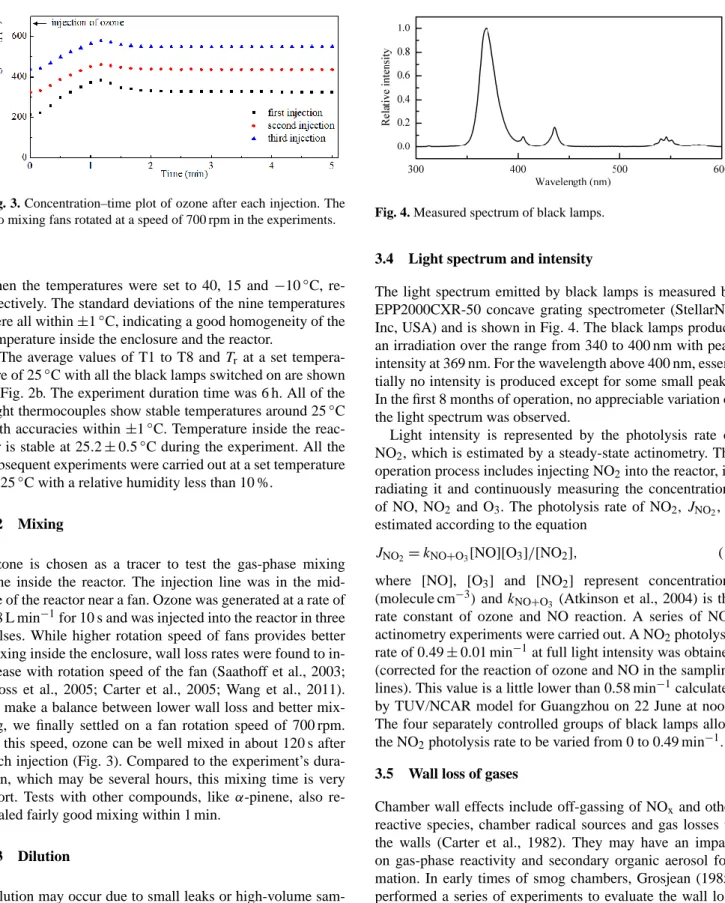
Fig. 3. Concentration–time plot of ozone after each injection. The two mixing fans rotated at a speed of 700 rpm in the experiments.
when the temperatures were set to 40, 15 and −10
◦C, re- spectively. The standard deviations of the nine temperatures were all within ±1
◦C, indicating a good homogeneity of the temperature inside the enclosure and the reactor.
The average values of T1 to T8 and T
rat a set tempera- ture of 25
◦C with all the black lamps switched on are shown in Fig. 2b. The experiment duration time was 6 h. All of the eight thermocouples show stable temperatures around 25
◦C with accuracies within ±1
◦C. Temperature inside the reac- tor is stable at 25.2 ± 0.5
◦C during the experiment. All the subsequent experiments were carried out at a set temperature of 25
◦C with a relative humidity less than 10 %.
3.2 Mixing
Ozone is chosen as a tracer to test the gas-phase mixing time inside the reactor. The injection line was in the mid- dle of the reactor near a fan. Ozone was generated at a rate of 0.8 L min
−1for 10 s and was injected into the reactor in three pulses. While higher rotation speed of fans provides better mixing inside the enclosure, wall loss rates were found to in- crease with rotation speed of the fan (Saathoff et al., 2003;
Bloss et al., 2005; Carter et al., 2005; Wang et al., 2011).
To make a balance between lower wall loss and better mix- ing, we finally settled on a fan rotation speed of 700 rpm.
At this speed, ozone can be well mixed in about 120 s after each injection (Fig. 3). Compared to the experiment’s dura- tion, which may be several hours, this mixing time is very short. Tests with other compounds, like α-pinene, also re- vealed fairly good mixing within 1 min.
3.3 Dilution
Dilution may occur due to small leaks or high-volume sam- pling. Dilution rate may vary with the number and type of instruments taking samples from the reactor. In each experi- ment, a low-reactive compound such as SF
6or CH
3CN was injected as a tracer for dilution. Dilution was not detectable within the uncertainty of the instrument.
43
712
Fig. 4. Measured spectrum of black lamps.
713 714
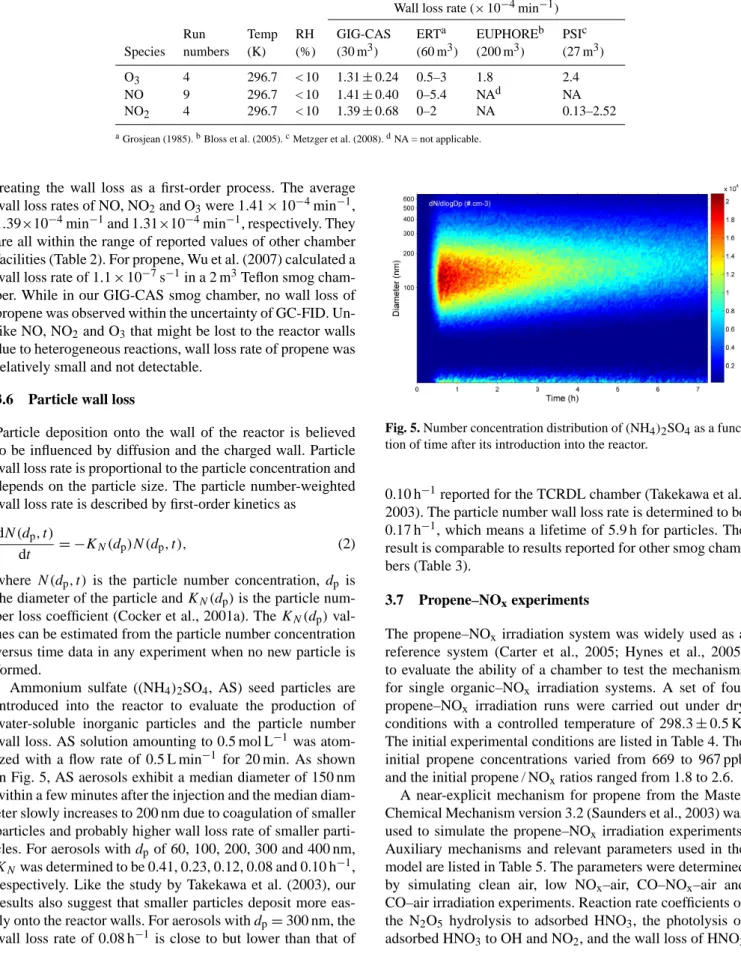
Fig. 4. Measured spectrum of black lamps.
3.4 Light spectrum and intensity
The light spectrum emitted by black lamps is measured by EPP2000CXR-50 concave grating spectrometer (StellarNet Inc, USA) and is shown in Fig. 4. The black lamps produce an irradiation over the range from 340 to 400 nm with peak intensity at 369 nm. For the wavelength above 400 nm, essen- tially no intensity is produced except for some small peaks.
In the first 8 months of operation, no appreciable variation of the light spectrum was observed.
Light intensity is represented by the photolysis rate of NO
2, which is estimated by a steady-state actinometry. The operation process includes injecting NO
2into the reactor, ir- radiating it and continuously measuring the concentrations of NO, NO
2and O
3. The photolysis rate of NO
2, J
NO2, is estimated according to the equation
J
NO2= k
NO+O3[ NO][O
3] /[NO
2] , (1) where [NO], [O
3] and [NO
2] represent concentrations (molecule cm
−3) and k
NO+O3(Atkinson et al., 2004) is the rate constant of ozone and NO reaction. A series of NO
2actinometry experiments were carried out. A NO
2photolysis rate of 0.49 ± 0.01 min
−1at full light intensity was obtained (corrected for the reaction of ozone and NO in the sampling lines). This value is a little lower than 0.58 min
−1calculated by TUV/NCAR model for Guangzhou on 22 June at noon.
The four separately controlled groups of black lamps allow the NO
2photolysis rate to be varied from 0 to 0.49 min
−1. 3.5 Wall loss of gases
Chamber wall effects include off-gassing of NO
xand other reactive species, chamber radical sources and gas losses to the walls (Carter et al., 1982). They may have an impact on gas-phase reactivity and secondary organic aerosol for- mation. In early times of smog chambers, Grosjean (1985) performed a series of experiments to evaluate the wall loss rates of inorganic and organic species.
In the GIG-CAS smog chamber, wall loss rates of NO, NO
2, O
3and propene were evaluated by injecting a cer- tain concentration of these gases and continuous monitor- ing their decay in the dark. Wall loss rates are obtained by
Atmos. Meas. Tech., 7, 301–313, 2014 www.atmos-meas-tech.net/7/301/2014/
Table 2. Summary of wall loss rates of gas species in GIG-CAS chamber and comparison with other chamber facilities.
Wall loss rate (× 10
−4min
−1)Run Temp RH GIG-CAS ERT
aEUPHORE
bPSI
cSpecies numbers (K) (%) (30 m
3)(60 m
3)(200 m
3)(27 m
3)O
34 296.7 < 10 1.31 ± 0.24 0.5–3 1.8 2.4
NO 9 296.7 < 10 1.41 ± 0.40 0–5.4 NA
dNA
NO
24 296.7 < 10 1.39 ± 0.68 0–2 NA 0.13–2.52
aGrosjean (1985).bBloss et al. (2005).cMetzger et al. (2008).dNA = not applicable.
treating the wall loss as a first-order process. The average wall loss rates of NO, NO
2and O
3were 1.41 × 10
−4min
−1, 1.39×10
−4min
−1and 1.31×10
−4min
−1, respectively. They are all within the range of reported values of other chamber facilities (Table 2). For propene, Wu et al. (2007) calculated a wall loss rate of 1.1 × 10
−7s
−1in a 2 m
3Teflon smog cham- ber. While in our GIG-CAS smog chamber, no wall loss of propene was observed within the uncertainty of GC-FID. Un- like NO, NO
2and O
3that might be lost to the reactor walls due to heterogeneous reactions, wall loss rate of propene was relatively small and not detectable.
3.6 Particle wall loss
Particle deposition onto the wall of the reactor is believed to be influenced by diffusion and the charged wall. Particle wall loss rate is proportional to the particle concentration and depends on the particle size. The particle number-weighted wall loss rate is described by first-order kinetics as
dN (d
p, t )
dt = − K
N(d
p)N (d
p, t ), (2) where N (d
p, t ) is the particle number concentration, d
pis the diameter of the particle and K
N(d
p) is the particle num- ber loss coefficient (Cocker et al., 2001a). The K
N(d
p) val- ues can be estimated from the particle number concentration versus time data in any experiment when no new particle is formed.
Ammonium sulfate ((NH
4)
2SO
4, AS) seed particles are introduced into the reactor to evaluate the production of water-soluble inorganic particles and the particle number wall loss. AS solution amounting to 0.5 mol L
−1was atom- ized with a flow rate of 0.5 L min
−1for 20 min. As shown in Fig. 5, AS aerosols exhibit a median diameter of 150 nm within a few minutes after the injection and the median diam- eter slowly increases to 200 nm due to coagulation of smaller particles and probably higher wall loss rate of smaller parti- cles. For aerosols with d
pof 60, 100, 200, 300 and 400 nm, K
Nwas determined to be 0.41, 0.23, 0.12, 0.08 and 0.10 h
−1, respectively. Like the study by Takekawa et al. (2003), our results also suggest that smaller particles deposit more eas- ily onto the reactor walls. For aerosols with d
p= 300 nm, the wall loss rate of 0.08 h
−1is close to but lower than that of
44 715
Fig. 5. Number concentration distribution of (NH4)2SO4 as a function of time after its 716
introduction into the reactor.
717 718
Fig. 5. Number concentration distribution of (NH
4)2SO
4as a func- tion of time after its introduction into the reactor.
0.10 h
−1reported for the TCRDL chamber (Takekawa et al., 2003). The particle number wall loss rate is determined to be 0.17 h
−1, which means a lifetime of 5.9 h for particles. The result is comparable to results reported for other smog cham- bers (Table 3).
3.7 Propene–NO
xexperiments
The propene–NO
xirradiation system was widely used as a reference system (Carter et al., 2005; Hynes et al., 2005) to evaluate the ability of a chamber to test the mechanisms for single organic–NO
xirradiation systems. A set of four propene–NO
xirradiation runs were carried out under dry conditions with a controlled temperature of 298.3 ± 0.5 K.
The initial experimental conditions are listed in Table 4. The initial propene concentrations varied from 669 to 967 ppb and the initial propene / NO
xratios ranged from 1.8 to 2.6.
A near-explicit mechanism for propene from the Master Chemical Mechanism version 3.2 (Saunders et al., 2003) was used to simulate the propene–NO
xirradiation experiments.
Auxiliary mechanisms and relevant parameters used in the
model are listed in Table 5. The parameters were determined
by simulating clean air, low NO
x–air, CO–NO
x–air and
CO–air irradiation experiments. Reaction rate coefficients of
the N
2O
5hydrolysis to adsorbed HNO
3, the photolysis of
adsorbed HNO
3to OH and NO
2, and the wall loss of HNO
3Table 3. Comparison of particle wall loss rates in different smog chambers.
Volume Wall Wall loss Particle
Chamber (m
3)material rate (h
−1)lifetime (h) Reference
GIG-CAS 30 FEP 0.17 5.9 This work
PSI 27 FEP 0.21 4.8 Paulsen et al. (2005)
Caltech 28 FEP 0.20 5.0 Cocker et al. (2001a)
UCR 90 FEP 0.29 3.4 Carter et al. (2005)
EUPHORE 200 FEP 0.18 5.6 Martín-Reviejo and Wirtz (2005)
SAPHIR 270 FEP 0.27 3.7 Rollins et al. (2009)
CMU 12 FEP 0.40 2.5 Donahue et al. (2012)
Table 4. Summary of initial conditions for propene–NO
x–air irradiation experiments.
Run RH
JNO2[propene]
0[NO]
0[NO
2]
0number
T(K) % min
−1ppb ppb ppb [propene]/[NO
x]
1 298.2 ± 0.5 < 10 0.49 878 215 126 2.6
2 298.2 ± 0.3 < 10 0.49 967 132 292 2.3
3 297.9 ± 0.3 < 10 0.34 930 447 2.6 2.1
4 299.0 ± 0.8 < 10 0.49 669 350 19 1.8
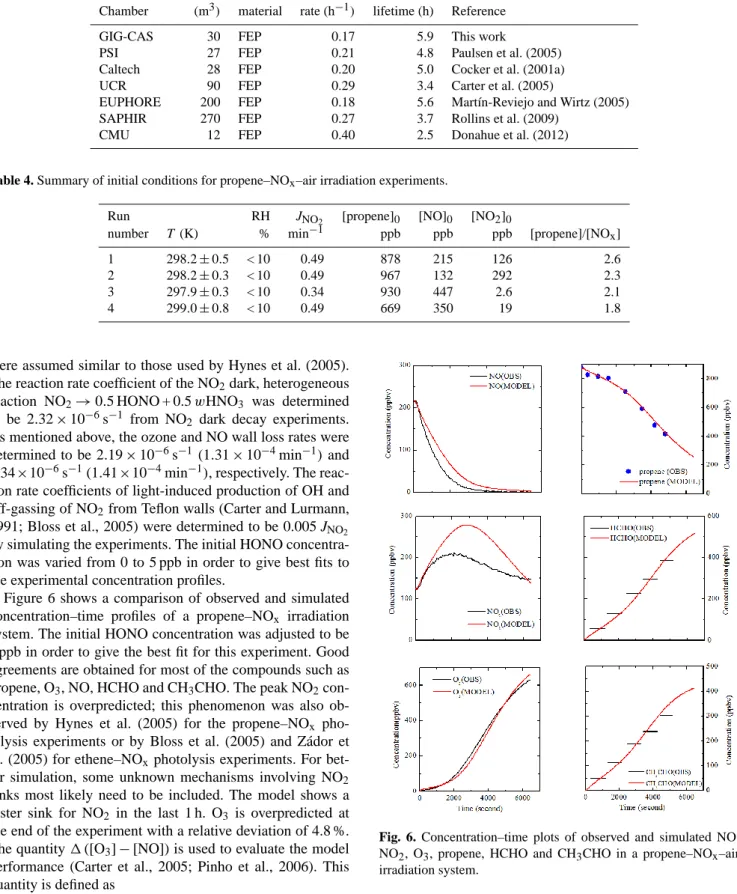
were assumed similar to those used by Hynes et al. (2005).
The reaction rate coefficient of the NO
2dark, heterogeneous reaction NO
2→ 0.5 HONO + 0.5 wHNO
3was determined to be 2.32 × 10
−6s
−1from NO
2dark decay experiments.
As mentioned above, the ozone and NO wall loss rates were determined to be 2.19 × 10
−6s
−1(1.31 × 10
−4min
−1) and 2.34×10
−6s
−1(1.41×10
−4min
−1), respectively. The reac- tion rate coefficients of light-induced production of OH and off-gassing of NO
2from Teflon walls (Carter and Lurmann, 1991; Bloss et al., 2005) were determined to be 0.005 J
NO2by simulating the experiments. The initial HONO concentra- tion was varied from 0 to 5 ppb in order to give best fits to the experimental concentration profiles.
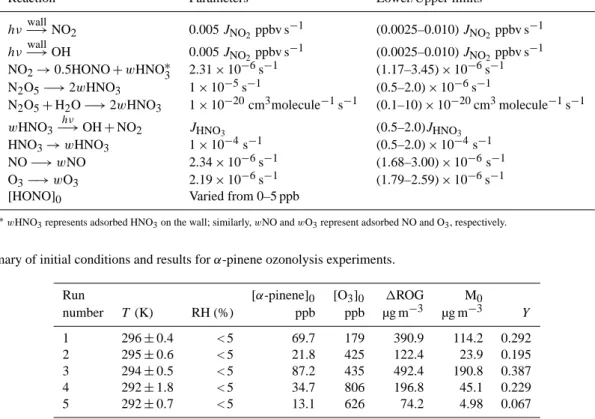
Figure 6 shows a comparison of observed and simulated concentration–time profiles of a propene–NO
xirradiation system. The initial HONO concentration was adjusted to be 5 ppb in order to give the best fit for this experiment. Good agreements are obtained for most of the compounds such as propene, O
3, NO, HCHO and CH
3CHO. The peak NO
2con- centration is overpredicted; this phenomenon was also ob- served by Hynes et al. (2005) for the propene–NO
xpho- tolysis experiments or by Bloss et al. (2005) and Zádor et al. (2005) for ethene–NO
xphotolysis experiments. For bet- ter simulation, some unknown mechanisms involving NO
2sinks most likely need to be included. The model shows a faster sink for NO
2in the last 1 h. O
3is overpredicted at the end of the experiment with a relative deviation of 4.8 %.
The quantity 1 ([O
3] − [NO]) is used to evaluate the model performance (Carter et al., 2005; Pinho et al., 2006). This quantity is defined as
45
719
720
Fig. 6. Concentration-time plots of observed and simulated NO, NO2, O3, propene, HCHO 721
and CH3CHO in a propene-NOx-air irradiation system.
722 723
Fig. 6. Concentration–time plots of observed and simulated NO, NO
2, O
3, propene, HCHO and CH
3CHO in a propene–NO
x–air irradiation system.
Atmos. Meas. Tech., 7, 301–313, 2014 www.atmos-meas-tech.net/7/301/2014/
Table 5. Auxiliary mechanisms for chamber-dependent reactions.
Reaction Parameters Lower/Upper limits
hν−→wall
NO
20.005 J
NO2ppbv s
−1(0.0025–0.010) J
NO2ppbv s
−1 hν−→wallOH 0.005 J
NO2ppbv s
−1(0.0025–0.010) J
NO2ppbv s
−1NO
2→0.5HONO + wHNO
∗32.31 × 10
−6s
−1(1.17–3.45) × 10
−6s
−1N
2O
5−→2wHNO
31 × 10
−5s
−1(0.5–2.0) × 10
−6s
−1N
2O
5+H
2O −→ 2wHNO
31 × 10
−20cm
3molecule
−1s
−1(0.1–10) × 10
−20cm
3molecule
−1s
−1wHNO3−→hν
OH + NO
2 JHNO3(0.5–2.0)J
HNO3HNO
3→wHNO31 × 10
−4s
−1(0.5–2.0) × 10
−4s
−1NO −→ wNO 2.34 × 10
−6s
−1(1.68–3.00) × 10
−6s
−1O
3−→wO32.19 × 10
−6s
−1(1.79–2.59) × 10
−6s
−1[HONO]
0Varied from 0–5 ppb
∗wHNO3represents adsorbed HNO3on the wall; similarly, wNO and wO3represent adsorbed NO and O3, respectively.
Table 6. Summary of initial conditions and results for α-pinene ozonolysis experiments.
Run [α-pinene]
0[O
3]
0 1ROGM
0number
T(K) RH (%) ppb ppb µg m
−3µg m
−3 Y1 296 ± 0.4 < 5 69.7 179 390.9 114.2 0.292
2 295 ± 0.6 < 5 21.8 425 122.4 23.9 0.195
3 294 ± 0.5 < 5 87.2 435 492.4 190.8 0.387
4 292 ± 1.8 < 5 34.7 806 196.8 45.1 0.229
5 292 ± 0.7 < 5 13.1 626 74.2 4.98 0.067
1([O
3]−[ NO]) = [O
3]
final−[ NO]
final− ([O
3]
0−[ NO]
0), (3) where [NO]
0and [O
3]
0are the concentrations of NO and O
3at the beginning of the experiment and [NO]
final, [O
3]
finalare those at the end. 1([O
3] − [NO]) represents the amounts of NO oxidized and O
3formed in the experiments, and also gives an indication of the biases in simulating O
3for- mation. In the four experiments, the prediction biases of 1([O
3] − [NO]) have been calculated to vary from −2.2 to 23.7 % at the end of the experiments, which are within the values of ±25 % reported by Carter et al. (2005) when sim- ulating VOC–NO
xsystems. The model results mentioned above illustrate that the GIG-CAS smog chamber can pro- vide valuable data for mechanism evaluation.
3.8 α-pinene ozonolysis SOA yield
A series of experiments of α-pinene ozonolysis in the dark were carried out to evaluate the chamber facility in study- ing SOA formation chemistry. This reaction has been widely studied and numerous data are readily found in the literature (Hoffmann et al., 1997; Griffin et al., 1999; Cocker et al., 2001b; Saathoff et al., 2009; Wang et al., 2011). Methods de- veloped by Pankow (1994a, b) and Odum et al. (1996) are used to analyze the data. Briefly, SOA yield, Y , is defined as follows:
Y = 1M
01ROG , (4)
where 1 ROG is the mass concentration of reactive organic gas (ROG) reacted and 1M
0is the total mass concentration of organic aerosols formed. Y is a function of M
0and the relation is described as
Y = M
0X
( α
iK
om,i1 + K
om,iM
0), (5)
where K
om,iand α
iare the mass-based absorption equilib- rium partitioning coefficient and stoichiometric coefficient of product i, respectively, and M
0is the total mass concen- tration of organic material. Odum et al. (1996) found that a two-product model could fit the yield data well if appropriate values for α
1, α
2, K
om,1, K
om,2were chosen.
Five experiments of dark ozonolysis of α-pinene were car-
ried out under dry conditions near 295 K in the absence of
OH scavenger and seed particles. The initial experimental
conditions and results are listed in Table 6. Initial mixing ra-
tios of α-pinene varied from 13 to 87 ppb. An aerosol den-
sity of 1 g cm
−3was assumed to convert the volume con-
centration into the mass concentration for the calculation of
aerosol yields. This assumed aerosol density is lower than
that of 1.3 g cm
−3by Bahreini et al. (2005) or Alfarra et
al. (2006) for α-pinene SOA. However, Wirtz and Martin-
Reviejo (2003) and Wang et al. (2011) both adopted a value
TS1: add “Pankow, J. F.: An Absorption-Model of Gas-Particle Partitioning of Organic-Compounds in the Atmosphere, Atmos Environ, 28, 185-188, 1994a.
Pankow, J. F.: An Absorption-Model of the Gas Aerosol Partitioning Involved in the Formation of Secondary Organic Aerosol, Atmos Environ, 28, 189-193, 1994b.”
after “Pandis, S. N., Paulson, S. E., Seinfeld, J. H., and Flagan, R. C.: Aerosol formation in the photooxidation of isoprene and β-pinene, Atmospheric Environment. Part A. General Topics, 25, 997-1008, http://dx.doi.org/10.1016/0960-1686(91)90141-S, 1991.” (Page 12, left column, line 8)
TS2: delete “Carter, W. P. L., Luo, D., Malkina, I. L., and Pierce, J. A.: Environmental chamber studies of atmospheric reactivities of Volatile Organic Compounds: effects of varying chamber and light source, California Air Resources Board, 1995.”
TS3: add “D03201, doi:10.1029/2006JD007436,” before “2007”
TS4: delete “Sulzer, P. and Mark, T. D.: A high resolution and high sensitivity proton-transfer-reaction time-of-flight mass spectrometer (PTR-TOF-MS), Int. J.
Mass Spectrom., 286, 122–128, 2009”
Other corrections
Page 2, Left column, Line 38: change “compound (VOC)” to “compounds (VOCs)”
Fig. 7. Comparison of yield data obtained for α-pinene ozonolysis experiments in GIG-CAS chamber with other chamber facilities.
All experiments are carried out under dry condition. Blue line is the best fit two-product model for the data set of GIG-CAS.
of 1.0 g cm
−3. Here we used the unit density for all the ex- periments when comparing our results with those from pre- vious studies. Particles wall losses have to be accounted for to accurately quantify the SOA formation. The approach in- volving measuring the size-dependent wall loss rate of dry inert ammonium sulfate particles is not suitable for exper- iments in which nucleation occurs (Keywood et al., 2004).
Here, we use the same method as Pathak et al. (2007) in that we calculate the total mass wall loss rate and apply this rate to the entire experiment. Comparison of yield data of this work and previous studies (Hoffmann et al., 1997; Griffin et al., 1999; Cocker et al., 2001b; Saathoff et al., 2009; Wang et al., 2011) is shown in Fig. 7. Only the yields obtained for the dark ozonolysis of α-pinene under dry conditions in the absence of OH scavenger and seed particles were consid- ered. The two-product model gives a good fit for the yield data obtained in this work. The appropriate values for α
1, α
2, K
om,1and K
om,2are 0.189, 0.486, 0.0958 and 0.00218, re- spectively. Only the data of Saathoff et al. (2009) are slightly higher than the yield curve obtained in this work, probably owing to their assumed aerosol density of 1.25 g cm
−3when calculating aerosol mass concentrations. Most yield data of other studies are lower than the yields in this work for the same amount of SOA generated. This may be attributed to the influence of temperature because SOA yield is demon- strated to inversely depend on temperature (Saathoff et al., 2009).
4 Conclusions
We have built the largest indoor smog chamber in China, and initial characterization experiments described in this pa- per demonstrate that our GIG-CAS smog chamber facility can be used to provide valuable data for gas-phase chem- istry and secondary aerosol formation. The chamber has been
shown to exhibit good temperature homogeneity and mix- ing efficiency. Observed relative lower wall loss rates of gas species and particles reflect the long lifetime of these species and small wall effects. Results of propene–NO
x–air irradia- tion experiments illustrate its utility for evaluating gas-phase chemical mechanisms. Furthermore, the good reproducibility of α-pinene ozonolysis experiments and the good agreement with previous studies demonstrate its ability for the study of secondary organic aerosol formation.
Acknowledgements. This work was supported by the Chinese
Academy of Sciences (YZ200918 and XDB05010200), the Natural Science Foundation of China (41025012/U0833003) and the Guangzhou Institute of Geochemistry (GIGCAS 135 project Y234161001). We would like to express our sincere gratitude to John Seinfeld at the California Institute of Technology as well as Paul Ziemann and David Cooker at the University of California, Riverside, for giving us good advice when we visited their chambers and consulted them about the design of our smog chamber.
Edited by: Y. Iinuma
References
Aiken, A. C., DeCarlo, P. F., and Jimenez, J. L.: Elemental Analysis of Organic Species with Electron Ionization High- Resolution Mass Spectrometry, Anal. Chem., 79, 8350–8358, doi:10.1021/ac071150w, 2007.
Aiken, A. C., DeCarlo, P. F., Kroll, J. H., Worsnop, D. R., Huff- man, J. A., Docherty, K. S., Ulbrich, I. M., Mohr, C., Kimmel, J. R., Sueper, D., Sun, Y., Zhang, Q., Trimborn, A., Northway, M., Ziemann, P. J., Canagaratna, M. R., Onasch, T. B., Alfarra, M. R., Prevot, A. S. H., Dommen, J., Duplissy, J., Metzger, A., Baltensperger, U., and Jimenez, J. L.: O/C and OM/OC Ratios of Primary, Secondary, and Ambient Organic Aerosols with High- Resolution Time-of-Flight Aerosol Mass Spectrometry, Environ.
Sci. Technol., 42, 4478–4485, doi:10.1021/es703009q, 2008.
Akimoto, H., Hoshino, M., Inoue, G., Sakamaki, F., Washida, N., and Okuda, M.: Design and characterization of the evacuable and bakable photochemical smog chamber, Environ. Sci. Technol., 13, 471–475, doi:10.1021/es60152a014, 1979.
Alfarra, M. R., Paulsen, D., Gysel, M., Garforth, A. A., Dommen, J., Prévôt, A. S. H., Worsnop, D. R., Baltensperger, U., and Coe, H.: A mass spectrometric study of secondary organic aerosols formed from the photooxidation of anthropogenic and biogenic precursors in a reaction chamber, Atmos. Chem. Phys., 6, 5279–
5293, doi:10.5194/acp-6-5279-2006, 2006.
Atkinson, R., Baulch, D. L., Cox, R. A., Crowley, J. N., Hamp- son, R. F., Hynes, R. G., Jenkin, M. E., Rossi, M. J., and Troe, J.:
Evaluated kinetic and photochemical data for atmospheric chem- istry: Volume I – gas phase reactions of O
x, HO
x, NO
xand SO
xspecies, Atmos. Chem. Phys., 4, 1461–1738, doi:10.5194/acp-4- 1461-2004, 2004.
Bahreini, R., Keywood, M. D., Ng, N. L., Varutbangkul, V., Gao, S., Flagan, R. C., Seinfeld, J. H., Worsnop, D. R., and Jimenez, J.
L.: Measurements of Secondary Organic Aerosol from Oxidation of Cycloalkenes, Terpenes, and m-Xylene Using an Aerodyne
Atmos. Meas. Tech., 7, 301–313, 2014 www.atmos-meas-tech.net/7/301/2014/
Aerosol Mass Spectrometer, Environ. Sci. Technol., 39, 5674–
5688, doi:10.1021/es048061a, 2005.
Barnes, I., Becker, K. H., Carlier, P., and Mouvier, G.: FTIR study of the DMS/NO
2/I
2/N
2photolysis system: The reaction of IO radicals with DMS, Int. J. Chem. Kinet., 19, 489–501, 1987.
Bloss, C., Wagner, V., Jenkin, M. E., Volkamer, R., Bloss, W. J., Lee, J. D., Heard, D. E., Wirtz, K., Martin-Reviejo, M., Rea, G., Wenger, J. C., and Pilling, M. J.: Development of a detailed chemical mechanism (MCMv3.1) for the atmospheric oxidation of aromatic hydrocarbons, Atmos. Chem. Phys., 5, 641–664, doi:10.5194/acp-5-641-2005, 2005.
Carter, W. P. L.: Documentation of the SAPRC-99 chemical mecha- nism for VOC reactivity assessment, Report to the California Air Resources Board, Contracts 92-329 and 95-308, 8 May, 2000.
Carter, W. P. L. and Lurmann, F. W.: Evaluation of a de- tailed gas-phase atmospheric reaction mechanism using envi- ronmental chamber data, Atmos. Environ. A, 25, 2771–2806, doi:10.1016/0960-1686(91)90206-M, 1991.
Carter, W. P. L., Atkinson, R., Winer, A. M., and Pitts, J. N.: Exper- imental investigation of chamber-dependent radical sources, Int.
J. Chem. Kinet., 14, 1071–1103, doi:10.1002/kin.550141003, 1982.
Carter, W. P. L., Cocker, D. R., Fitz, D. R., Malkina, I. L., Bumiller, K., Sauer, C. G., Pisano, J. T., Bufalino, C., and Song, C.: A new environmental chamber for evaluation of gas-phase chemi- cal mechanisms and secondary aerosol formation, Atmos. Envi- ron., 39, 7768–7788, doi:10.1016/j.atmosenv.2005.08.040, 2005.
Chan, C. K. and Yao, X. H.: Air pollution in mega cities in China, Atmos. Environ., 42, 1–42, 2008.
Cocker, D. R., Flagan, R. C., and Seinfeld, J. H.: State-of-the- art chamber facility for studying atmospheric aerosol chemistry, Environ. Sci. Technol., 35, 2594–2601, doi:10.1021/Es0019169, 2001a.
Cocker, D. R., Clegg, S. L., Flagan, R. C., and Seinfeld, J. H.:
The effect of water on gas–particle partitioning of secondary or- ganic aerosol. Part I: α-pinene/ozone system, Atmos. Environ., 35, 6049–6072, doi:10.1016/S1352-2310(01)00404-6, 2001b.
DeCarlo, P. F., Kimmel, J. R., Trimborn, A., Northway, M. J., Jayne, J. T., Aiken, A. C., Gonin, M., Fuhrer, K., Horvath, T., Docherty, K. S., Worsnop, D. R., and Jimenez, J. L.: Field-Deployable, High-Resolution, Time-of-Flight Aerosol Mass Spectrometer, Anal. Chem., 78, 8281–8289, doi:10.1021/ac061249n, 2006.
Dodge, M. C.: Chemical oxidant mechanisms for air quality modeling: critical review, Atmos. Environ., 34, 2103–2130, doi:10.1016/S1352-2310(99)00461-6, 2000.
Donahue, N. M., Henry, K. M., Mentel, T. F., Kiendler-Scharr, A., Spindler, C., Bohn, B., Brauers, T., Dorn, H. P., Fuchs, H., Till- mann, R., Wahner, A., Saathoff, H., Naumann, K.-H., Möhler, O., Leisner, T., Müller, L., Reinnig, M.-C., Hoffmann, T., Salo, K., Hallquist, M., Frosch, M., Bilde, M., Tritscher, T., Barmet, P., Praplan, A. P., DeCarlo, P. F., Dommen, J., Prévôt, A. S.
H., and Baltensperger, U.: Aging of biogenic secondary organic aerosol via gas-phase OH radical reactions, P. Natl. Acad. Sci., 109, 13503–13508, doi:10.1073/pnas.1115186109, 2012.
Doussin, J. F., Ritz, D., Durand-Jolibois, R., Monod, A., and Carlier, P.: Design of an environmental chamber for the study of atmo- spheric chemistry: New developments in the analytical device, Analusis, 25, 236–242, 1997.
Griffin, R. J., Cocker III, D. R., Flagan, R. C., and Sein- feld, J. H.: Organic aerosol formation from the oxidation of biogenic hydrocarbons, J. Geophys. Res., 104, 3555–3567, doi:10.1029/1998jd100049, 1999.
Grosjean, D.: Wall loss of gaseous pollutants in outdoor Teflon chambers, Environ. Sci. Technol., 19, 1059–1065, doi:10.1021/es00141a006, 1985.
Hess, G. D., Carnovale, F., Cope, M. E., and Johnson, G. M.: The evaluation of some photochemical smog reaction mechanisms – I. Temperature and initial composition effects, Atmos. Environ.
A, 26, 625–641, doi:10.1016/0960-1686(92)90174-J, 1992.
Hoffmann, T., Odum, J. R., Bowman, F., Collins, D., Klockow, D., Flagan, R. C., and Seinfeld, J. H.: Formation of organic aerosols from the oxidation of biogenic hydrocarbons, J. Atmos. Chem., 26, 189–222, 1997.
Hynes, R. G., Angove, D. E., Saunders, S. M., Haverd, V., and Azzi, M.: Evaluation of two MCM v3.1 alkene mechanisms using in- door environmental chamber data, Atmos. Environ., 39, 7251–
7262, 2005.
Jayne, J. T., Leard, D. C., Zhang, X., Davidovits, P., Smith, K.
A., Kolb, C. E., and Worsnop, D. R.: Development of an Aerosol Mass Spectrometer for Size and Composition Anal- ysis of Submicron Particles, Aerosol. Sci. Tech., 33, 49–70, doi:10.1080/027868200410840, 2000.
Jeffries, H. E., Kamens, R. M., Sexton, K. G., and Gerhardt, A.
A.: Outdoor smog chamber experiments to test photochemical models, EPA-600/3-82-016a, April, 1982.
Jeffries, H. E., Sexton, K. G., Kamens, R. M., and Holleman, M. S.:
Outdoor smog chamber experiments to test photochemical mod- els: phase II, Final Report, EPA-600/3-85-029, 1985.
Johnson, D., Jenkin, M. E., Wirtz, K., and Martin-Reviejo, M.:
Simulating the Formation of Secondary Organic Aerosol from the Photooxidation of Toluene, Environ. Chem., 1, 150–165, doi:10.1071/EN04069, 2004.
Jordan, A., Haidacher, S., Hanel, G., Hartungen, E., Mark, L., See- hauser, H., Schottkowsky, R., Sulzer, P., and Mark, T. D.: A high resolution and high sensitivity proton-transfer-reaction time-of- flight mass spectrometer (PTR-TOF-MS), Int. J. Mass Spec- trom., 286, 122–128, 2009.
Keywood, M. D., Varutbangkul, V., Bahreini, R., Flagan, R. C., and Seinfeld, J. H.: Secondary Organic Aerosol Formation from the Ozonolysis of Cycloalkenes and Related Compounds, Environ.
Sci. Technol., 38, 4157–4164, doi:10.1021/es035363o, 2004.
Leone, J. A., Flagan, R. C., Grosjean, D., and Seinfeld, J. H.:
An outdoor smog chamber and modeling study of toluene – NO
xphotooxidation, Int. J. Chem. Kinet., 17, 177–216, doi:10.1002/kin.550170206, 1985.
Lindinger, W., Hansel, A., and Jordan, A.: On-line monitoring of volatile organic compounds at pptv levels by means of proton- transfer-reaction mass spectrometry (PTR-MS) medical applica- tions, food control and environmental research, Int. J. Mass Spec- trom., 173, 191–241, 1998.
Martín-Reviejo, M. and Wirtz, K.: Is Benzene a Precursor for Sec- ondary Organic Aerosol?, Environ. Sci. Technol., 39, 1045–
1054, doi:10.1021/es049802a, 2005.
Metzger, A., Dommen, J., Gaeggeler, K., Duplissy, J., Prevot, A.
S. H., Kleffmann, J., Elshorbany, Y., Wisthaler, A., and Bal-
tensperger, U.: Evaluation of 1,3,5 trimethylbenzene degradation
in the detailed tropospheric chemistry mechanism, MCMv3.1,
using environmental chamber data, Atmos. Chem. Phys., 8, 6453–6468, doi:10.5194/acp-8-6453-2008, 2008.
Odum, J. R., Hoffmann, T., Bowman, F., Collins, D., Flagan, R.
C., and Seinfeld, J. H.: Gas/Particle Partitioning and Secondary Organic Aerosol Yields, Environ. Sci. Technol., 30, 2580–2585, doi:10.1021/es950943+, 1996.
Odum, J. R., Jungkamp, T. P. W., Griffin, R. J., Forstner, H. J.
L., Flagan, R. C., and Seinfeld, J. H.: Aromatics, Reformulated Gasoline, and Atmospheric Organic Aerosol Formation, Environ.
Sci. Technol., 31, 1890–1897, doi:10.1021/es960535l, 1997.
Pandis, S. N., Paulson, S. E., Seinfeld, J. H., and Flagan, R. C.:
Aerosol formation in the photooxidation of isoprene and β- pinene, Atmos. Environ. A, 25, 997–1008, 1991.
Pankow, J. F.: An Absorption-Model of Gas-Particle Partitioning of Organic-Compounds in the Atmosphere, Atmos. Environ., 28, 185–188, 1994a.
Pankow, J. F.: An Absorption-Model of the Gas Aerosol Partitioning Involved in the Formation of Secondary Organic Aerosol, Atmos.
Environ., 28, 189–193, 1994b.
Pathak, R. K., Stanier, C. O., Donahue, N. M., and Pandis, S. N.: Ozonolysis of alpha-pinene at atmospherically rele- vant concentrations: Temperature dependence of aerosol mass fractions (yields), J. Geophys. Res.-Atmos., 112, D03201, doi:10.1029/2006JD007436, 2007.
Paulsen, D., Dommen, J., Kalberer, M., Prévôt, A. S. H., Richter, R., Sax, M., Steinbacher, M., Weingartner, E., and Baltensperger, U.:
Secondary Organic Aerosol Formation by Irradiation of 1,3,5- Trimethylbenzene – NO
x-H
2O in a New Reaction Chamber for Atmospheric Chemistry and Physics, Environ. Sci. Technol., 39, 2668–2678, doi:10.1021/es0489137, 2005.
Pinho, P. G., Pio, C. A., Carter, W. P. L., and Jenkin, M. E.: Evalua- tion of alkene degradation in the detailed tropospheric chemistry mechanism, MCM v3, using environmental chamber data, J. At- mos. Chem., 55, 55–79, doi:10.1007/s10874-006-9025-y, 2006.
Ren, K., Li, J., Wang, W., and Zhang, H.: Investigation on experi- ment system for modeling of photochemical smog, Acta Scienti- aeCircumatantiae, 25, 1431–1435, 2005.
Rollins, A. W., Kiendler-Scharr, A., Fry, J. L., Brauers, T., Brown, S. S., Dorn, H.-P., Dubé, W. P., Fuchs, H., Mensah, A., Mentel, T.
F., Rohrer, F., Tillmann, R., Wegener, R., Wooldridge, P. J., and Cohen, R. C.: Isoprene oxidation by nitrate radical: alkyl nitrate and secondary organic aerosol yields, Atmos. Chem. Phys., 9, 6685–6703, doi:10.5194/acp-9-6685-2009, 2009.
Saathoff, H., Moehler, O., Schurath, U., Kamm, S., Dippel, B., and Mihelcic, D.: The AIDA soot aerosol characterisation cam- paign 1999, J. Aerosol Sci., 34, 1277–1296, doi:10.1016/S0021- 8502(03)00363-X, 2003.
Saathoff, H., Naumann, K.-H., Möhler, O., Jonsson, Å. M., Hal- lquist, M., Kiendler-Scharr, A., Mentel, Th. F., Tillmann, R., and Schurath, U.: Temperature dependence of yields of secondary or- ganic aerosols from the ozonolysis of α-pinene and limonene, Atmos. Chem. Phys., 9, 1551–1577, doi:10.5194/acp-9-1551- 2009, 2009.
Saunders, S. M., Jenkin, M. E., Derwent, R. G., and Pilling, M.
J.: Protocol for the development of the Master Chemical Mech- anism, MCM v3 (Part A): tropospheric degradation of non- aromatic volatile organic compounds, Atmos. Chem. Phys., 3, 161–180, doi:10.5194/acp-3-161-2003, 2003.
Simonaitis, R., Meagher, J. F., and Bailey, E. M.: Evaluation of the condensed carbon bond (CB-IV) mechanism against smog cham- ber data at low VOC and NO
xconcentrations, Atmos. Environ., 31, 27–43, doi:10.1016/S1352-2310(96)00155-0, 1997.
Stern, J. E., Flagan, R. C., Grosjean, D., and Seinfeld, J. H.:
Aerosol formation and growth in atmospheric aromatic hydro- carbon photooxidation, Environ. Sci. Technol., 21, 1224–1231, doi:10.1021/es00165a011, 1987.
Takekawa, H., Minoura, H., and Yamazaki, S.: Temperature depen- dence of secondary organic aerosol formation by photo-oxidation of hydrocarbons, Atmos. Environ., 37, 3413–3424, 2003.
Tang, J. H., Wang, X. M., Feng, Y. L., Sheng, G. Y., and Fu, J.
M.: Determination of C-1 similar to C-10 carbonyls in the atmo- sphere, Chinese J. Anal. Chem., 31, 1468–1472, 2003.
Tobias, H. J. and Ziemann, P. J.: Compound identification in or- ganic aerosols using temperature programmed thermal desorp- tion particle beam mass spectrometry, Anal. Chem., 71, 3428–
3435, 1999.
Vlasenko, A., Macdonald, A .M., Sjostedt, S. J., and Abbatt, J. P. D.:
Formaldehyde measurements by Proton transfer reaction – Mass Spectrometry (PTR-MS): correction for humidity effects, At- mos. Meas. Tech., 3, 1055–1062, doi:10.5194/amt-3-1055-2010, 2010.
Wang, J., Doussin, J. F., Perrier, S., Perraudin, E., Katrib, Y., Pan- gui, E., and Picquet-Varrault, B.: Design of a new multi-phase experimental simulation chamber for atmospheric photosmog, aerosol and cloud chemistry research, Atmos. Meas. Tech., 4, 2465–2494, doi:10.5194/amt-4-2465-2011, 2011.
Wang, W., Xie, Y., Lin, Z., and Wang, H.: Study on reaction rate constants of CH
4and its lifetime, China Environ. Sci., 15, 258–
261, 1995.
Wang, X. M. and Wu, T.:Release of isoprene and monoterpenes dur- ing the aerobic decomposition of orange wastes from laboratory incubation experiments, Environ. Sci. Technol., 42, 3265–3270, 2008.
Wirtz, K. and Martin-Reviejo, M.: Density of secondary organic aerosols, J. Aerosol Sci., 34, S223–S224, 2003.
Wu, S., Lü, Z., Hao, J., Zhao, Z., Li, J., Takekawa, H., Minoura, H., and Yasuda, A.: Construction and characterization of an at- mospheric simulation smog chamber, Adv. Atmos. Sci., 24, 250–
258, doi:10.1007/s00376-007-0250-3, 2007.
Xu, Y., Jia, L., Ge, M., Du, L., Wang, G., and Wang, D.: A kinetic study of the reaction of ozone with ethylene in a smog cham- ber under atmospheric conditions, Chinese Sci. Bull., 51, 2839–
2843, doi:10.1007/s11434-006-2180-3, 2006.
Zádor, J., Wagner, V., Wirtz, K., and Pilling, M. J.: Quantitative as- sessment of uncertainties for a model of tropospheric ethene ox- idation using the European Photoreactor (EUPHORE), Atmos.
Environ., 39, 2805–2817, doi:10.1016/j.atmosenv.2004.06.052, 2005.
Zhang, Q., He, K. B., and Huo, H.: Clean China’s air, Nature, 484, 161–162, 2012.
Zhang, Y. L., Guo, H., Wang, X. M., Simpson, I. J., Barletta, B., Blake, D. R., Meinardi, S., Rowland, F. S., Cheng, H. R., Saun- ders, S. M., and Lam, S. H. M.: Emission patterns and spa- tiotemporal variations of halocarbons in the Pearl River Delta region, southern China, J. Geophys. Res.-Atmos., 115, D15309, doi:10.1029/2009JD013726, 2010.
Atmos. Meas. Tech., 7, 301–313, 2014 www.atmos-meas-tech.net/7/301/2014/
Zhang, Y. L., Wang, X. M., Blake, D. R., Li, L. F., Zhang, Z., Wang, S. Y., Guo, H., Lee, F. S. C., Gao, B., Chan, L. Y., Wu, D., and Rowland, F. S.:Aromatic hydrocarbons as ozone precursors be- fore and after outbreak of the 2008 financial crisis in the Pearl River Delta region, south China, J. Geophys. Res.-Atmos., 117, D15306, doi:10.1029/2011JD017356, 2012.
Zhang, Y., Wang, X., Zhang, Z., Lü, S., Shao, M., Lee, F. S. C., and Yu, J.: Species profiles and normalized reactivity of volatile or- ganic compounds from gasoline evaporation in China, Atmos.
Environ., 79, 110–118, doi:10.1016/j.atmosenv.2013.06.029,
2013.