Effect of Electric Current on Microstructural Evolution
in a Cold-Rolled 3
%
Si Steel
Wenbin Dai
1, Xinli Wang
2,+, Hongming Zhao
3and Xiang Zhao
1,+ 1School of Materials and Metallurgy, Northeastern University, Shenyang 110004, P. R. China2Research Institute, Northeastern University, Shenyang 110004, P. R. China
3Baosteel Co., Ltd, Shanghai, 200941, P. R. China
The effect of electric current pulse (ECP) treatment on grain orientation in a cold-rolled Fe3%Si steel was investigated in this study. Results showed that the recrystallized nuclei preferred to form along the current direction in the primary period of recrystallization. The theoretical analysis revealed that the anisotropic nucleation orientation was ascribed to the different dislocation mobility derived from the electron wind force during the passing of electric current. Hence, the ECP treatment should be a special and effective method to control the nucleation orientation, and the present work is of great technological and physical importance. [doi:10.2320/matertrans.M2011272]
(Received September 1, 2011; Accepted October 27, 2011; Published December 7, 2011)
Keywords: electric current pulse, recrystallization, nucleation
1. Introduction
To provide high performance materials, the fabrication of ideal anisotropic products and the controlling of recrystalli-zation texture are feasible methods.1,2) Therein, the inves-tigation of the sources of the directionality of the recrystal-lization texture is still an important work.
As to the b.c.c structural low carbon steels, the lattice surface energy (E(hkl)) differs in different critical planes,
namely, E(110)>E(111)>E(211)>E(100)for planes parallel to
the rolling plane.3) Theoretically, because of the different
lattice surface energy, the effect of anisotropy of free surface energy can be neglected except that the grain size is much larger than the thickness of specimen in vacuum or an inert atmosphere.4) In fact, Zhao et al. found that when a high magnetic field paralleled to the rolling direction during annealing a low carbon steel, the h100i orientation was easier to recrystallize than h110iorientation.5,6) Namely, the magnetic field direction could affect the nucleation orienta-tion. In addition, our previous study also showed that the
ð111Þh112inanotwins in¡phase originated from the¢phase nuclei and directionally nucleated on the {110} planes in a CuZn alloy treated by electric current pulse (ECP), and it was ascribed to a remarkable anisotropic electric con-ductivity along the current direction under a high current density.7) Hence, the preferred nucleation orientation might
also have a close relationship with the current direction under ECP treatment, and the influence of electric current direction on recrystallized grain orientation was investigated in this study.
2. Experimental
An Fe3%Si sheet with chemical composition at 0.002% C, 2.10% Si, 0.90% Al, 0.35% Mn, 0.018% P, 0.0025% S, 0.0012% N, and bal. Fe was selected as research material in
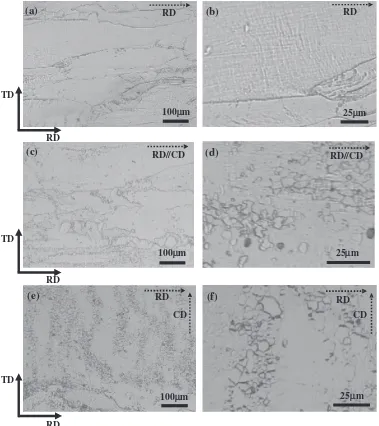
this study, and the average grain size was about 200 µm. After 85%cold-rolled at room temperature, elongated grains of about several hundreds micrometers were distributed along the rolling direction (RD) [Fig. 1(a)]. By using the electro-spark discharge technique, dogbone-shaped samples of 10 mm length, 5 mm width, and 0.56 mm thick [Fig. 2(a)] were cut from cold-rolled sheet and divided into two groups, depending on whether the length direction of sample was parallel or perpendicular to RD. Obviously, the current direction (CD) of ECP was the length direction of dogbone-shaped sample [Fig. 1(a)]. For the CD¦ RD group, the CD paralleled to the transverse direction (TD), namely, CD//TD. ECP was produced through a discharge of capacitor banks under ambient conditions. A similar single damped oscillation pulse with six peaks was in-situ detected using a Rogowski coil and a TDS3012 digital storage oscilloscope. To make the caused Joule heating identical, a same current density was exerted upon two groups (CD// RD and CD ¦RD). As revealed in in Fig. 2(b), the pulse duration (t) of the ECP was 700 µs, the period (tp) was 112 µs
and the maximum current density (jm) was 8.5 kA·mm¹2.
According to these parameters, the temperature rise caused by ECP can be calculated as about 905°C.7) In order to
prepare samples for texture measurement, the middle affected parts were cut from the samples, and then polished and lightly etched. For each specimen, three incomplete {110}, {200} and {211} pole figures were measured up to a maximal polar angle of 70° by the Schulz back-reflection method using Co-Ka radiation.8)The corresponding orienta-tion distribuorienta-tion funcorienta-tions (ODFs) were calculated with the two-step method and the results were presented in the constant ¤2=45° sections (Bunge’s notation).9) To prepare
specimens for microstructure observation, the middle affected parts were cut from the selected samples, and then the investigated surfaces (rolling planes) were mechanically polished and the electro-polished in a solution of 5% perchloric acid (HClO4), and 95% ethanol (C2H5OH) in
volume at 15° temperature. The orientation imaging analysis was performed by a JSM-6500F SEM equipped with electron +Corresponding author, E-mail: wangxl520@hotmail.com, zhaox@mail.
neu.edu.cn
back scattered diffraction (EBSD) and HKL’s Channel 5 software. The “beam controlled” mode was applied with a step size of 0.4 µm. Three different areas were selected on each sample and the total area covered about 20000 grains for each sample. The average micro-hardness value was measured by a 401 MVDTM digital sclerometer on the polished surfaces under an applied load of 50 g for 15 s over 30 points. Optical microscope was used to characterize the microstructures of samples.
3. Results and Discussion
Figure 1 shows the optical microscope microstructure of samples before and after ECP treatment. Due to the heavy cold rolling, the initial normal grains elongated along the RD to the length of about several hundreds micrometers [Figs. 1(a) and 1(b)]. Although the experimental conditions were identical, the microstructure of the CD //RD group was obviously different from that of the CD¦RD group.
In the CD// RD group, lots of small recrystallized grains nucleated along the grain boundaries and a few small grains emerged inside the coarse elongated grains [Figs. 1(c) and 1(d)]. On the contrary, the microstructure of the CD¦RD group shown in Figs. 1(e) and 1(f) revealed that a much large amount of recrystallized grains nucleated inside the coarse grains by forming a laminar like structure along the current direction, and only a few recrystallized nuclei were observed at the grain boundaries.
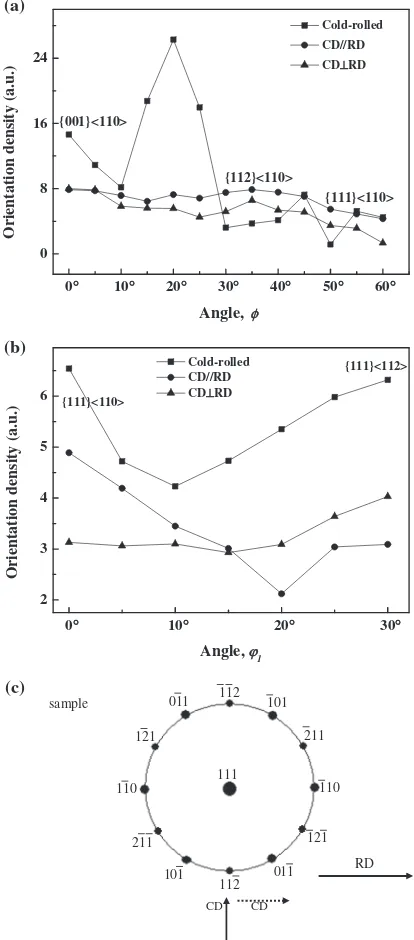
Figure 3 plots the orientation intensity of £-fiber and ¡-fiber textures of samples before and after ECP treatment. The texture of cold-rolled sample was composed of two main deformation texture components, i.e., the ¡-fiber (RD//
h110i) and the £-fiber (normal direction (ND)// h111i). Figure 3(a) plots the intensity tendency of the ¡-fiber. The stronger components of the cold-rolled samples were the {001}h110icomponent and the{111}h110icomponent. For the ECP treated samples, due to the partially recrystallization, the intensity of{112}h110icomponent was increased, while
100μm
(a)
RDRD TD
(c)
RD//CD100μm
RD TD
(e)
RDCD
100μm
RD TD
25μm
(b)
RD(d)
25μm RD//CD
(f)
25μm RD
CD
[image:2.595.109.488.70.496.2]the intensities and sharpness of the {001}h110i component and the{111}h110icomponent in the¡-fiber were decreased. In addition, the average intensity of¡-fiber of the CD ¦RD group was lower than that of the CD// RD group. Figure 3(b) illustrates the intensity tendency of the £-fiber. For the CD// RD group, the intensity of {111}h110i component in the £-fiber was stronger than that of {111}h112i component. As to the CD ¦RD group, the {111}h112i component in the £-fiber was enhanced, simultaneously with the{110}h001iGoss component texture. As schematically illustrated in Fig. 3(c), there was a 30° orientation relationship betweenh110iandh112idirection if only considering the orientation relationship of the {111} crystal planes. Hence, the RD paralleled toh110i diretction, and the {111}h110i texture component of the CD //RD group was consequently strengthened. On the other hand, when the RD paralleled to the h110i direction and the CD paralleled to the h112i direction, the {111}h112i texture component of the CD¦RD group was strengthened. Obviously, preferred nucleation orientation was observed to distribute along the current direction.
Through micro-hardness measurement, it was found that the micro-hardness was decreased from the cold-rolled samples 380 HV to 275 HV and 279 HV for the CD //RD group and the CD¦ RD group, respectively. Obviously, the decrease of micro-hardness should be ascribed to the partially recrystallization induced by ECP.
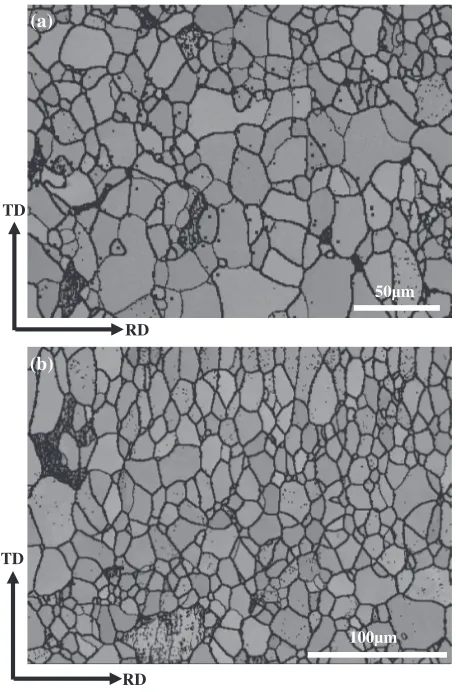
To clear the recrystallization process, the further detailed studies on the recrystallized grains of the CD//RD group and the CD ¦RD group were explored by EBSD measure-ment. The EBSD maps of recrystallized grains are shown in Fig. 4, and their corresponding micro-ODF constant ¤2=45° sections of recrystallized grains with different size
are illustrated in Fig. 5. As known, the actual orientation distribution in a polycrystal is the result of the manufacturing process and thus texture contains detailed information about the production history of a work piece. Figure 5 shows the transition of the recrystallization texture for different grains.
0°° 0 8 16 24 60° 50° 40° 30° 20° 10°
Orientation density (a.u.)
Angle,φ
Cold-rolled CD//RD CD⊥RD
{001}<110> {112}<110> {111}<110> (a) 0° 2 3 4 5 6 30° 20° 10°
Orientation density (a.u.)
Angle, ϕ1 Cold-rolled CD//RD CD⊥RD {111}<110> {111}<112> (b) 112 101 211 011 121 110 211 101 112 011 110 121 111 sample RD CD CD (c)
Fig. 3 Variation in the orientation intensity of£-fiber and¡-fiber textures of the cold-rolled specimen and the ECPed specimens (a)¡-fiber textures (b)£-fiber textures, and (c) Schematic illustration of h110i andh112i directions of (111)h110i oriented grains. In the CD//RD group, CD parallels to the h110i orientation; while in the CD¦RD group, CD parallels to the h112i orientation. The solid arrow in (c) denotes the current direction of the CD¦RD group, and the dot arrow denotes the current direction of the CD//RD group.
(a) 0.0 -8 -4 0 4 8 Curr
ent density (kA·mm
-2 )
Time, t / ms
(b) To oscilloscope Sample 220V Control circuit Trigger circuit Charge circuit Switch Copper electrodes Current probe Capacitor banks 0.8 0.6 0.4 0.2
[image:3.595.62.280.65.415.2] [image:3.595.323.530.73.543.2]According to the distribution of the grain area obtained from EBSD results, the grains are divided into three groups, i.e., the tiny grains (grain areas between 10 and 30 µm2), the medium grains (between 30 and 100 µm2), and the big grains (larger than 100 µm2). Therein, the big grains had a rapid
nucleation rate at the early stage of recrystallization, and the nucleation of tiny grains lagged behind the other grains. From Fig. 5, it can be seen that the sharpness of the {001}h110i component (¡-fiber) induced by cold rolling remained
unchanged no matter with the grain size for the CD //RD group during the recrystallization process induced by ECP. However, for the CD¦RD group, there was an enhance-ment of the£-fiber, especially the{111}h112i component of the medium grains and the{111}h110icomponent of the big grains, whereas the intensity of the¡-fiber decreased to some extent. Visibly, the nucleation site in the two conditions was different.
From Figs. 1 and 4, it can be concluded that lots of small recrystallized grains were induced by ECP treatment within the duration of 700 µs. According to the classical electro-migration theories,1012) the average atom drift velocity V
ie
resulting from an electric current can be calculated as
Vie¼Jcie i ¼
D
kT jejZjµ ð1Þ
where Jie is the atomic flux, ci is the atomic density, D*
is the self-diffusion coefficient, Z* is the effective charge,
e is an electron charge, k is an Boltzmann’s constant, T is the absolute temperature, µ is the resistivity, and j is the electric current density. Obviously, the atom drift velocity is influenced by the exerted current density. Since same electric current density was exerted on the ECP treated samples, the effects of rapid heating rate and the enhancement of migration of atoms must be identical. Hence, the effect of atom drift velocity must not be the reason for the formation of anisotropic recrystallization nucleation.
Naturally, the anisotropic recrystallization nucleation observed at the same current density but different direction can be ascribed to the different dislocation mobility with respect to the current direction. Theoretically, though the most important driving force for recrystallization may be the stored energy due to dislocations, dislocations cannot directly be related to the recrystallization texture, unless they give rise to some anisotropic characteristics.4,13)As known, in a current-carrying metallic material, the drift electrons can exert a force on dislocations, namely electron wind force, which can be written as:14,15)
Few¼ ðµD=NDÞenej ð2Þ
where Few is the electron-wind force per unit dislocation
length, µD/NDis the specific resistivity per unit dislocation
length,NDis the dislocation density,eis an electron charge,
neis the electron density, andjis the electric current density.
If there is a different angle between the current direction and the arrangement direction of dislocations, a different electron-wind force might be exerted on the dislocation mobility. Though the lattice surface energy for the low carbon steels
E(110)>E(111)>E(211)>E(100), due to the effect of electron
wind force, the application of electric current accelerates the dislocations’mobility alongh110idirection paralleling to the current direction for the CD// RD group; while for the CD¦RD group, it accelerates the dislocation mobility in
h112i direction paralleling to the current direction. This simple explanation further suggests that the nuclei prefers to form by directional nucleation on the crystalline orientation paralleling to the current direction due to the different accelerated dislocation mobility by electric current. In addition, since the {111}h112i component is prone to lead to the {110}h001i Goss orientation after recrystallization, big grains
medium grains tiny grains
ϕ1
Φ (a)
(b)
CD//RD
CD⊥RD
Fig. 5 ODF constant ¤2=45° sections of recrystallized grains with
different size (a) the CD//RD group, and (b) the CD¦RD group.
100µm 50µm
(b) (a)
TD
RD
TD
RD
[image:4.595.56.284.69.415.2] [image:4.595.49.289.468.625.2]the {110}h001i Goss component texture is accordingly detected in the CD¦RD group, which also reveals that the application of electric current strongly accelerates the dislocation mobility along the current direction.
4. Conclusion
In the CD// RD group, the recrystallization grains prefer to nucleate from the {111}h110i component; while in the CD¦RD group, the recrystallized nuclei prefers to form from the {111}h112i component. Hence, the application of electric current induces the recrystallization nucleation along the current direction. The further theoretical analysis reveals that the anisotropic nucleation orientation is ascribed to the different dislocation mobility derived from the electron wind force during the passing of electric current.
Acknowledgement
This study was supported by the National Nature Science Foundation of China, Grant No. 50901018. The authors thank Prof. Tadao Watanabe for his valuable advice on this work, and also thank Prof. J. D. Guo and Mr. B. Q. Wang of the Institute of Metal Research, Chinese Academy of Sciences, for their help with the ECP experiments.
REFERENCES
1) R. D. Doherty, D. A. Hughes, F. J. Humphreys, J. J. Jonas, D. Juul Jensen, M. E. Kassner, W. E. King, T. R. McNelley, H. J. McQueen and A. D. Rollett:Mater. Sci. Eng. A238(1997) 219274.
2) M. Dzubinsky and F. Kovac:Scr. Mater.45(2001) 12051211.
3) N. Rajmohan, Y. Hayakawa, J. A. Szpunar and J. H. Root:Acta Mater. 45(1997) 24852494.
4) D. N. Lee:Scr. Metall. Mater.32(1995) 16891694.
5) C. S. He, Y. D. Zhang, X. Zhao, L. Zuo, J. C. He, K. Watanabe, T. Zhang and G. Nishijima: 2001 Annual Reports (High Field Laboratory for Superconducting Materials, Institute for Materials Research, Tohoku University) pp. 215218.
6) Y. D. Zhang, C. Esling, J. Muller, C. S. He, X. Zhao and L. Zuo:Appl. Phys. Lett.87(2005) 212504.
7) W. B. Dai, X. L. Wang, L. Zhao and J. G. Yu:Mater. Trans.52(2011) 20222026.
8) L. G. Schulz:J. Appl. Phys.20(1949) 10301033.
9) Z. D. Liang, J. Z. Xu and F. Wang: Three dimensional orientation analysis of textured materials-ODF analysis. (Northeastern Institute Press, Shenyang, 1980), pp. 108109.
10) P. S. Ho and T. Kwok:Rep. Prog. Phys.52(1989) 301348.
11) I. A. Blech:J. Appl. Phys.47(1976) 12031208.
12) H. B. Huntington and A. R. Grone:J. Phys. Chem. Solids20(1961) 7687.
13) S. C. Paolinelli, M. A. Cunha and A. B. Cota:J. Magn. Magn. Mater. 320(2008) e641e644.
14) K. Okazaki, M. Kagawa and H. Conrad:Scr. Metall.12(1978) 1063 1068.