Munich Personal RePEc Archive
Optimization of government trade
behavior and its implication for small
developing economy (the case of Ukraine)
Sokolovska, Olena and Sokolovskyi, Dmytro
Research Institute of Fiscal Policy, State Fiscal Service of Ukraine, Institute of Industrial Economy of National Academy of sciences of Ukraine
13 June 2016
1. Introduction
The government’s choice of certain level of integration depends principally on
impact of integration process on development of national economy. That is, the rational
government’s behavior with regard to joining to certain trade agreement is conditioned
both by maximization of efficiency of potential possibilities and minimization of
related risks for domestic economy.
Tariff and export taxes as other taxes are used in order to achieve both fiscal and
regulatory goals in the area of international trade, i.e. to provide tax revenue from
external economic activity (commodities imports and exports) and to regulate flows of
commodities sold to other countries and bought in other states.
It should be noted that problems, concerning trade regulation through the use of
trade taxes are typical firstly for weak and/or authoritarian economies. Governments
of developed market economies generally do not face the centralized regulation of
commodity flows.
Such conditions determine different types of government behavior: to reduce (or
to eliminate) export taxes on primary and raw-materials in order to develop appropriate
export-oriented industries and to provide currency earnings, or to use tariff regulation
in order to promote both the use of resources in the domestic economy and production
with high value-added.
The trade of developing and transition countries is characterized by export
orientation (there are some exceptions, e.g. the North Korea), the lack of resources for
domestic production, the little value-added and relatively low quality of goods. All this
leads to the low competitiveness of such goods in the world market.
Consequently the most part of goods, produced in these countries, becomes
competitive in the world markets contingent upon low price, and therefore upon its low
profitability. In turn, this low profitability leads to the risk of the failure of the foreign
trade activity of companies in transition countries, to its dependence from additional
countries, from the level of the tax burden in them, and also whether there are export
taxes (in exporting countries) and import tariffs (in importing countries).
Now Ukrainian government set a course for Ukraine’s joining to European Union (hereafter EU); notably, it elaborated the EU-Ukraine Association Agenda to
prepare and facilitate the implementation of the Association Agreement for 2014-2017.
Also main directions of sectoral coordination are agreed, new conditions of
Ukraine-EU commodity trade are defined, particularly the unilateral reduction or elimination of
the EU customs duties for commodities originating in Ukraine in the framework of
Autonomous Preferential Trade Regime (hereafter APTR).
But now Ukraine imposes several export taxes, primarily, on raw materials
(ferrous and non-ferrous scrap metals, sunflower seeds etc.), and their share in the total
trade tax revenue is negligible (less than 5% of total revenue). At the same time, despite
that EU countries starting from May 2014 have eliminated a substantial part of import
tariffs applied to goods originating in Ukraine (under provisions of Autonomous
preferential trade regime (Sokolovska, 2016), Ukraine’s exports which is subject of the import tariffs in destination countries is about 50% of total country’s exports.
According to the trade theory the reduction of a tariff ceteris paribus leads to the
increase of commodity flows. Taking into account that now raw materials and
intermediate products consist a large part of Ukrainian export to the EU, the reduction
or elimination of import tariffs could lead to the increase of their exports, therefore
favoring to recognizing Ukraine as net exporter of raw materials and semi-finished
goods. This is the case firstly for agricultural goods (which, however, are regulated by
EU by non-tariff measures, notably, quotas), and also for output of mining and
processing industries and metallurgy. Notably, a considerable part of Ukrainian
metallurgical export to the EU, consists of raw materials and unfinished goods, which
are processed later on European plants in order to create high value added production.
But in current economic environment government’s behavior should be focused on
departure from the image of raw materials exporting country since such economic
But in real economic conditions when commodity flows are influenced by other
factors along with tariffs, tariffs (as distorting element) could not be the main reason
of changes of commodity flows. In this context tariffs could be eliminated in order to
reduce their distorting effects in international trade.
So, the government faces the problem of defining the level of the tax (customs)
burden, taking into account that the heavier is the tax burden the higher is budget
revenues, proceeded from both exports and imports, but the lesser are their volumes.
The latter, firstly, narrows an external trade of the country, and secondly due to
narrowing of the tax base as a result nevertheless could lead to the reduction of budget
revenues. Otherwise, the reduction of the tax (customs) burden could also lead to the
reduction of budget revenues despite the enlarging of the tax base.
The reasonability of applying customs duties for goods with different elasticities
(both for monopoly markets and markets closer to perfect competition) are considered
in Sokolovskyi & Sokolovska (2011). The obtained results could be enlarged for
different types of the world market demand on certain goods, notably, the high level of
demand could be considered as similar to the monopoly industry while the low level
of demand – as similar to the industry, closer to perfect competition.
So, the main purpose of the paper is to determine the most efficient government
trade behavior by defining elements of such behavior and their conformity to certain
economic framework, and by determining whether commodity exports are sensitive to
reduction or elimination of tariffs (as in the case of Ukrainian exports and EU import
duties).
To do this we structured paper as follows. Section 2 reviews main theoretical
and empirical research on the trade policy and government behavior. Section 3
provides brief theoretical background of use of trade taxes and non-tariff barriers.
Section 4 describes both methodology and theoretical model. Section 5 provides an
empirical estimation of sensitivity of commodity exports to the reduction of tariffs with
2. Literature review
Theoretical background of trade policy and government behavior could be found
in Calmfors & Horn (1986), Kerr & Gaisford (2007), Mansfield & Milner (2012),
Mahrenbach (2013), etc.
The largest part of research studies the impact of trade policy on economic
growth. See for example Krueger (1974), Rivera & Romer (1991), Lundstrom (2003),
Mahmood (2014) etc. These papers typically use a panel data in order to investigate
such impact. Generally, they conclude that trade policy is highly significant for the
economic growth. Another set of papers studies government trade policy in free trade
agreements (e.g. see Bagwell & Staiger (2003), Ethier (2004, 2007), Ludema & Mayda
(2013), Grossman & Horn (2013), Saggi et al. (2015) etc.).
Studies of government economic behavior, taking into account economic,
political and institutional factors in the trade policy, deserve a special mention.
Grossman & Helpman (1994) developed a model in which special-interest
groups make political contributions aimed to influence on government’s trade policy,
studying the structure of trade protection arising in the political equilibrium. They
conclude that the protection provided to all politically organized industries increases
with the relative weight that the government devotes to campaign contributions vis-à -vis voter welfare, and, falls with the fraction of voters, belonging to an organized lobby
group. Further Gawande & Magee (2012) have introduced into Grossman-Helpman
model the possibility of free-riding in a way that allows industries to be partially
organized, having made a distinction between cooperative and non-cooperative
lobbying. They found that free-riding reduces the estimated weight on social welfare
in the policy maker utility function. And thus the free-rider problem could help explain
why many advanced countries have low trade barriers despite having politicians who
are less than saints.
Gawande et al. (2009) examined quantitatively the welfare-mindedness of
governments, having observed government. They conclude that political institutions
having a larger number of checks and balances embedded in the trade policy decisions,
degree of urbanization and the degree of competition are also important determinants
of the weight governments put on social welfare in the decision making process.
Further authors continued to study this problem by evaluating the relative importance
of three factors that motivate redistributive government behavior: tariff revenues,
consumer welfare, and producer profits. Using tariff data from 40 countries, they found
that developing countries with weak tax systems often weigh tariff revenue heavily,
while more developed countries weigh producer interests the most (Gawande et al.
2015).
Mansfield & Milner (2014) studied government behavior in preferential trade
agreements. They supposed that political leaders can gain from such agreements
because of the signals they send to their publics and the more democratic their political
system is, the more they can gain from implementing trade agreements. Stoyanov &
Yildiz (2015) analyzed the government behavior in preferential and multilateral trade
agreements when they choose whether to participate in preferential or multilateral trade
agreements under political pressures from domestic special interest groups. They
conclude that heterogeneity in political preferences across countries plays an important
3. Methodology and theoretical model
Nigel A. Chalk (Chalk, 2001) analyzed classical graphical model of conditions
of increasing the tax revenue due to the reduction of the tax burden. Fig. 1 presents the
extended Chalk’s (2001), graph for convenience is oppositely “rotated”, notably, the
profitability of investors is situated on the X-axis in ascending (but not in descending)
[image:7.595.122.473.318.713.2]order.
Figure 1. Revenue of investors and government revenue in cases of standard and
reduced tariff rate
p
x
p=kx
p=k(1-t+Dt)x
p=k(1-t)x
p0
x1
p
x
p=kx
p=k(t-Dt)x p=ktx
p0
x1 B
A
C
b) government revenue
Fig. 1 shows the dependence both of revenues of investors and government
revenue from different tax (customs) burden, faced by investors. The reduction of the
tax burden generally leads to the enlargement of the tax base (increase of investment),
but in is not necessarily the case that such enlargement will lead to the increase of
budget revenue. According to the logics, the basic principles of which are substantiated
by Laffer (Trabandt, 2011), for defined distribution of companies’ profitability (industries) there is a critical value of the tax burden, at which the budget revenues are
highest. If the level of the tax burden exceeds the mentioned critical value, then its
reduction (to the critical value as well) leads to the increase of budget revenues.
Consequently the levels of the tax burden less than critical values unambiguously lead
[image:8.595.123.473.53.460.2]In the closed form we obtained conditions under which the introduction of tax
incentive regime could increase or reduce the tax revenue.
Let’s define the tariff revenue both in cases of standard (τ) and reduced (τ–Δτ) rates. According to the functions presented on Fig. 1, when the standard tariff (τ) rate
applies the revenue which exceeds the level of the simple reproduction
y x 1t y0
is received by investors which are situated in the interval
10 ; 1p x k t
; y x
t (the lower curve) denotes the amount of the tariff they pay.Under the conditions of tax incentive regime (τ–Δτ), the number of investors
receiving the revenue which exceeds the level of the simple reproduction, increases to
the interval
0
; 1 1p
x k Dt t
, but the amount of the tariff paid by them reduces to the
y x t Dt . Thus we have an oppositely directed dynamics of two multipliers which
compose the total amount of the tariff revenue. Consequently whether the tariff
reduction will increase the revenue depends on the concrete values of concrete
variables. Diagrammatically on Fig. 1 the tariff revenue under standard rate design is
defined by the total area of B and C sectors, and under tax incentive regime – by the total area of A and B sectors, respectively. The sector B is common to both designs, so
the increase of revenue due to introduction of tax incentive regime, compared to the
standard one, denotes the larger area of the sector A, compared to the sector C.
Formally, it can be written as.
Tax revenue under standard regime:
1
1 0 1 x
p p
P p x dx
t
t t
, (1)
1
1 0 1 x p pP p x dx
t t
t t t t
D
D D
, (2)where p0 is the level of simple reproduction;
p x is the productivity of investment in economy, ranked according to the higher
values;
p–1 is the function, inverse to p;
x1 is the highest level of normalized profitability (in industry or region).
In order that the expansion of foreing trade will lead to the tariff revenue, the
satisfaction of the condition P
t P
t Dt
is needed, i.e. the fulfillment of thefollowing requirement:
1 1 0 1 1 0 1 1 x p p x p pp x dx
P P
p x dx
t
t t
t t
t t t
t
D
D
D
;
1 1 0 1 1 0 1 1 1 x p p x p pp x dx
p x dx
t t t t t
D
D
Conversely, at
1 1 0 1 1 0 1 1 1 x p p x p pp x dx
p x dx
t t t t t
D
D
even the expansion of foreign trade will not compensate the reduction of the tariff
burden and will lead to the reduction of budget revenues.
The more detailed analysis of both standard and tax incentive regimes is
presented in Sokolovska & Sokolovskyi (2015). For this study it is necessary to
understand that the level of tariff reduction should be clearly defined, and if it is not
possible, the industries should be categorized by their productivity in order to provide
reduced tariff rates for the appropriate companies, which otherwise could curtail their
production.
4. Empirical estimation
Let’s briefly consider current situation with tariff regulation in Ukraine-EU commodity trade.
Now Ukraine applies import duties (general, reduced and preferential) for
products originating in EU. Starting from May 2014 EU provided Ukraine the
autonomous trade preferences in view of the security, political and economic
challenges faced by Ukraine, and in order to support country’s economy. Previously, EU governments applied import duties according Council Regulation (EC)
№1186/2009 at rates common for all third countries.
Late in April 2014 EU provided Ukraine the APTR, involving the unilateral
reduction or elimination of EU customs duties on goods originating in Ukraine: on
April 16, 2014 the EU Council adopted an appropriate decision and on April 22, 2014
an appropriate Regulation of European Parliament and of the Council was published in
the Official Journal of the European Union.
preferences started May 2014 and lasted until November 2014. Effective as of
introduction of APTR, EU governments set import duties at the level of the first year
after coming in force the Agreement of Deep and Comprehensive Free Trade Area
(hereafter DCFTA) between Ukraine and EU.
In the framework of tariff and non-tariff regulation this proposal concerned the
following commodities.
1. Industrial Products. Existing EU tariffs for industrial goods exported from Ukraine
were removed immediately for 94,7% of commodities. For the remaining handful
of products (some chemical products, etc.) tariffs were reduced.
2. Agricultural Products. For agricultural goods, the EU has taken important but more
limited action to open up its market to Ukrainian agriculture in order to ensure the
European agricultural sector is not harmed by this unilateral trade action. Notably,
the EU granted immediate and unlimited preferences to 82,2% of Ukraine's exports.
For the other products (cereals, pork, beef, poultry and a handful of additional
products) a partial liberalization was achieved by the granting of duty-free tariff rate
quotas (hereafter TRQs), which limit the amount of certain goods able to benefit
from the trade preference.
3. Processed food products. The EU granted immediate preferences to 83,4% of
Ukraine's exports. The remaining 15,9% were partially liberalized through TRQs.
On September, 2014 the implementation of statements of Ukraine-EU
Association Agreement (2013), related to the DCFTA was postponed to the beginning
of 2016. At the same time the APTR was unilaterally extended to the December 31,
2015. This means that after January 1, 2016 the import duty rates applied by EU
governments to products originating in Ukraine, remained unchanged. Ukrainian
government, in return, will start the gradual reduction of import duties for goods
originating in EU in order to allow domestic economic agents to adjust to the new
competitive conditions. The transition period will be 3-10 years, for automotive
4.1. Data and econometric methodology
In order to estimate the impact of unilateral reduction of import duties by EU
governments on Ukrainian export flows we provide econometrical and statistical
analysis.
As main indicators we’ve chosen the following commodities, according to
current Ukrainian Classification of Commodities for Foreign Economic Activity.
1. Sunflower oil.
2. Crude oil.
3. Pig iron.
4. Steam boilers.
5. Boilers for district heating (except steam boilers).
6. Electrical generator units.
7. Electrical generators (except electrical generator units).
8. Electrical transformers.
Main criteria in order to choose commodities for further analysis include:
change of import duty in the framework of APTR;
absence of import quotas applied by EU;
considerable (no less than 10%) part of export in the commodity group (according to
Ukrainian Classification of Commodities for Foreign Economic Activity) – only for commodities with reduced or eliminated rates of import duty;
availability of relevant statistical data concerning sales, exports and world prices;
diversity of commodities: products of mining and processing industries; metallurgy;
machinery.
We provided a two-stage analysis. On the first stage we tested individual
statistical dependencies between target parameter (Ukraine’s commodity exports to
EU) and independent parameters (tariff rate in EU countries, world market prices, rate
of exchange, etc.). On the second stage we used non-linear multiply regression with
normal distribution and power link function.
According to the available data we provide analysis for the short (2013-2014)
The weighted average import duty rate (before reduction) was calculated
according to the WTO (2012) methodology.
Considering that in 2014-2015 heavily due to geopolitical problems there was
general country’s economic fall, notably, in industrial sector. In order to obtain more relevant results we normalized the commodity sales and commodity exports on the
index of industrial output in USD (taking into account the dynamics of currency rate).
Firstly, we calculated individual statistical relationships. A significant
[image:14.595.57.532.322.446.2]correlation was determined for sunflower oil, crude oil and pig iron (Table 1.)
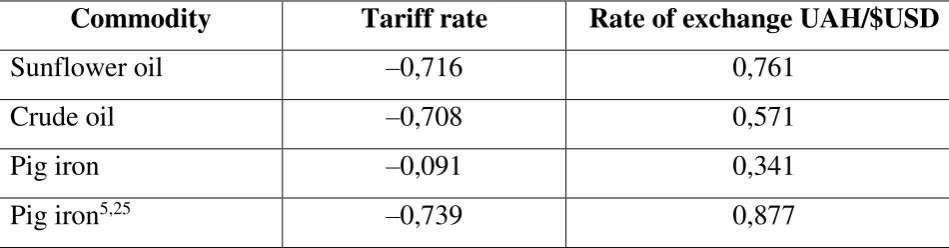
Table 1. Statistical relationships between exports and tariff rates and rate of exchange
for sunflower oil, crude oil and pig iron in the short-run
Commodity Tariff rate Rate of exchange UAH/$USD
Sunflower oil –0,716 0,761
Crude oil –0,708 0,571
Pig iron –0,091 0,341
Pig iron5,25 –0,739 0,877
Data analysis proved that exports of sunflower oil is significantly correlated with
both tariff rate (direct correlation) and rate of exchange (inverse correlation); that does
not run counter to economic sense: reduction of tariff rate and increase of rate of
exchange, ceteris paribus, lead to increase of exporters’ total revenue from exports and
their revenue in national currency, respectively. So, exports become more profitable in
both of these cases.
The inverse correlation in the short run is also observed for crude oil exports and
tariff rate, while the significant correlation with rate of exchange is absent. The reason
is that the crude oil does not need further processing, and, consequently, the
semi-finished products, wage payments for workers, employed in processing, and any other
expenditures made on the customs territory of Ukraine in its national currency.
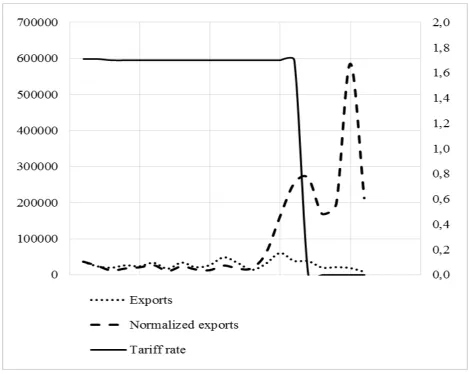
There is no significant statistical relationship between exports of pig iron and
region, where the most of Ukrainian metallurgical plants are situated, determined the
decrease in metallurgy industry, which was significantly more, than in the whole
economy. This factor, in turn, determined the decrease of metallurgy exports, which
could not be compensated even by elimination of tariffs. But, however, there is some
impact of the latter factor. Thus, the exports, normalized on power function of
industrial production index (optimal value of power for the available data is 5,25)
[image:15.595.63.533.295.669.2]demonstrates sufficient correlation (-0,74) with tariff rate (Fig. 2).
Figure 2. Graphical collocation of tariff rates and pig iron exports (in both absolute
and normalized values)
For machinery production (steam boilers, boilers for district heating (except
steam boilers), electrical generator units, electrical generators (except electrical
0,7), so we provide further analysis only for three strategically important commodities:
sunflower oil, crude oil and pig iron.
In order to analyze in more detail the impact of different factors on commodity
exports we applied non-linear multiple regression models.
In these models we used both linear and power link functions; the latter generally
is better to model economic processes in emerging economies. For calculations we
used STATISTICA 10 Enterprise tools.
4.2. Empirical results and discussion
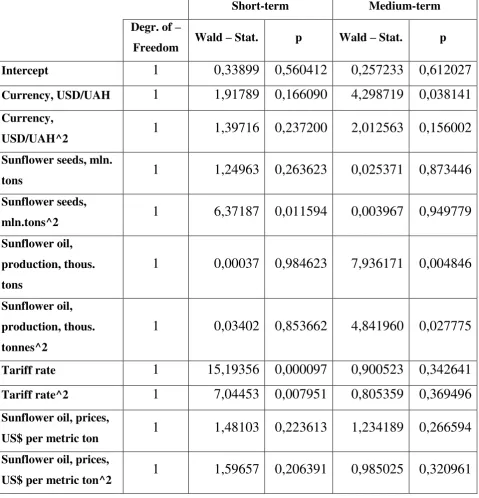
Fig. 3 presents an example of results of calculations for sunflower oil for the
short term in Statistica 10 (significant factors are highlighted in red), while the Table
2 the results of calculations for sunflower oil for both short and medium term
[image:16.595.65.566.433.721.2](significant factors are italicized).
Figure. 3. Results of estimation of impact of different factors on sunflower oil
Table 2. Results of estimation of impact of different factors on sunflower oil exports
in the short and medium term
Short-term Medium-term
Degr. of –
Freedom Wald – Stat. p Wald – Stat. p
Intercept 1 0,33899 0,560412 0,257233 0,612027
Currency, USD/UAH 1 1,91789 0,166090 4,298719 0,038141
Currency,
USD/UAH^2 1 1,39716 0,237200 2,012563 0,156002
Sunflower seeds, mln.
tons 1 1,24963 0,263623 0,025371 0,873446
Sunflower seeds,
mln.tons^2 1 6,37187 0,011594 0,003967 0,949779
Sunflower oil,
production, thous.
tons
1 0,00037 0,984623 7,936171 0,004846
Sunflower oil,
production, thous.
tonnes^2
1 0,03402 0,853662 4,841960 0,027775
Tariff rate 1 15,19356 0,000097 0,900523 0,342641
Tariff rate^2 1 7,04453 0,007951 0,805359 0,369496
Sunflower oil, prices,
US$ per metric ton 1 1,48103 0,223613 1,234189 0,266594
Sunflower oil, prices,
US$ per metric ton^2 1 1,59657 0,206391 0,985025 0,320961
We included into analysis of sunflower oil exports the sunflower plantings, since
sunflower seeds are the main component of sunflower oil production, moreover
Ukraine does not import them. The non-linear multiple regression model was built
The analysis of regression results with Wald-test (WaldStat.)1 showed the significance of only tariff rate parameter; confidence interval (p) is within tolerance
(р<0,05).
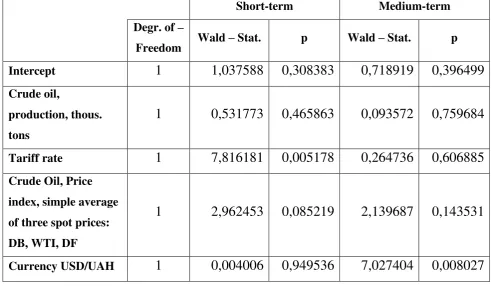
In estimating the impact of different factors on Ukrainian crude oil exports to the
EU, it has been found that in this case coefficients at non-linear terms of regression
equation are set to zero. So, we decide to apply linear multiple regression with normal
distribution and power link function. The results in both short and medium term are
[image:18.595.54.546.324.610.2]presented in Table 3.
Table 3. Results of estimation of impact of different factors on crude oil exports in
the short and medium term
Short-term Medium-term
Degr. of –
Freedom Wald – Stat. p Wald – Stat. p
Intercept 1 1,037588 0,308383 0,718919 0,396499
Crude oil,
production, thous.
tons
1 0,531773 0,465863 0,093572 0,759684
Tariff rate 1 7,816181 0,005178 0,264736 0,606885
Crude Oil, Price
index, simple average
of three spot prices:
DB, WTI, DF
1 2,962453 0,085219 2,139687 0,143531
Currency USD/UAH 1 0,004006 0,949536 7,027404 0,008027
1Wald statistics (Wald test) is a parametrical statistical test used for testing hypotheses, related to the
The regression results showed that in the short run the factor which has the
significant impact on crude oil exports is the tariff rate, while in the medium term only
the currency factor is significant.
In estimating the impact of different factors on pig iron exports with both linear
and non-linear multiple regression models we found that the effect of other factors
neutralizes relatively modest impact of tariff rate both in the short and medium term.
(Table 4).
Table 4. Results or estimation or impact or different factors or pig iron exports in the
short and medium term
Short-term Medium-term
Degr. of –
Freedom
Wald –
Stat. p
Wald –
Stat. p
Intercept 1 0,53641 0,463926 0,792004 0,373495
Currency, UAH/$USD 1 22,90290 0,000002 6,115723 0,013398
Currency, UAH/$USD^2 1 20,23452 0,000007 4,585844 0,032237
Pig iron, production, mln
tons 1 0,15892 0,690157 0,021037 0,884679
Pig iron, production, mln
tons^2 1 0,09351 0,759764 0,073099 0,786876
Pig iron, prices, $USD per
ton 1 0,84880 0,356891 0,637460 0,424632
Pig iron, prices, $USD per
ton^2 1 0,81670 0,366146 0,456520 0,499255
Tariff rate 1 0,14763 0,700813 0,446381 0,504059
Tariff rate^2 1 0,15775 0,691241 0,464178 0,495678
The obtained results under certain conditions could be extended on the whole
metallurgy sector that, in turn, allows to conclude that trade of metallurgical products
is influenced, principally, not by macroeconomic factors, but by internal framework in
the industry.
tariff rate for two commodities: sunflower oil and crude oil, both in the terms of
individual statistical dependence and multiply regression in the short term. For the
medium term such correlation was significant only for the sunflower oil. It can be
explained by the fact that tariff affects continuously on exports at the same level.
However, recently crude oil prices have been reduced considerably; that conditioned
their significant impact on Ukrainian crude oil exports (since Ukraine has no market
power for this commodity on world markets) in the medium term that has “overlapped”
the impact of tariffs.
Concerning the third commodity – the pig iron, analysis showed a relative weak correlation between exports and tariff rate both in the short and medium term. Because
of geopolitical problems in Ukraine and current situation in the Donbass region, the
decrease in metallurgy industry was significantly more, than in the whole economy,
and this factor determined principally the decrease of metallurgy exports, which could
not be compensated even by elimination of tariffs. But, however, we observed some
impact of the latter factor. At once, multiply regression does not show the dependence
of these factors. This allowed us to conclude that virtual impact of tariff rates on pig
iron exports is relatively weak compared to other factors and they are not a crucial
factor in defining the extent of such impact.
Consequently, the elimination of tariffs by EU governments in the framework of
APRT and DCFTA on primary goods and product with law value-added originating in
5. Conclusion
The analysis of advantages and disadvantages of government patterns of trade
behavior showed that in order to regulate the small open developing economy its
government should provide policy, based on applying of tax instruments, notably,
tariffs; non-tariff measures in such conditions are as auxiliary tools.
An econometric analysis provided in order to determine whether commodity
exports are sensitive to reduction or elimination of tariffs (as in the case of Ukrainian
exports and EU import duties) showed that now in Ukrainian economy there are
commodities which are both sensitive and resistant to changes of tariff rates.
The originality of paper consists in developing of model of efficient government
behavior in trade policy decision-making depending on the framework of national
economy; also both conditions of untimely changes of government behavior patterns
and ineffective frameworks appeared as consequence of these changes, were defined.
In the empirical context we determined the possibility of use of certain elements of
government trade policy in the framework of small transition economy of Ukraine. A
rational use of this fact could moderate the government trade policy and do not expose
the budget to the risk in the context of changes in foreign trade activity.
An accurate estimation of criteria of changes (depending on the economic
framework) of behavioral pattern is quite difficult, since it is difficult to determine
whether an economy is ready to introduce tariff or non-tariff restrictions. So,
specification and formalization of conditions of moments of changes of strategies