• No results found

Forecasting oil price realized volatility: A new approach

N/A
N/A
Protected

Academic year: 2020

Share "Forecasting oil price realized volatility: A new approach"

Copied!
43
0
0

Loading.... (view fulltext now)

Full text

Figure

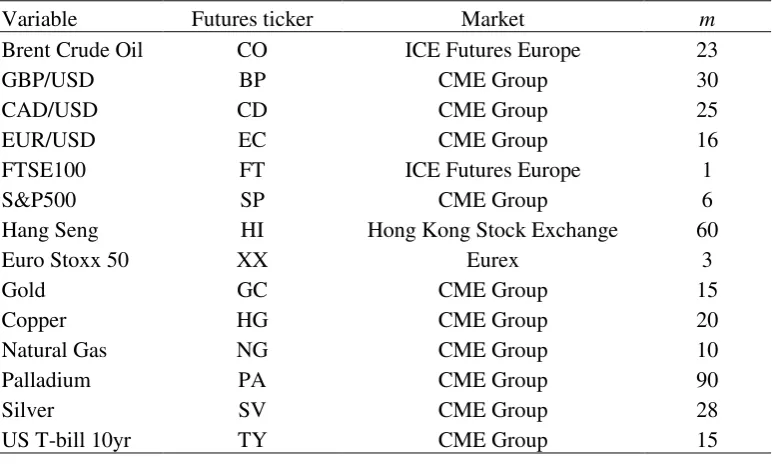
Table 1: Optimal Sampling frequencies for the realized volatility construction.
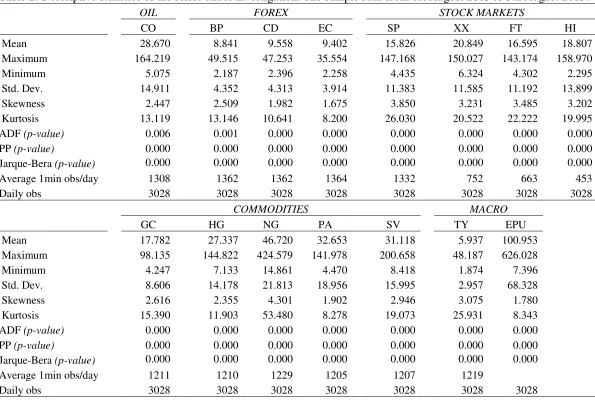
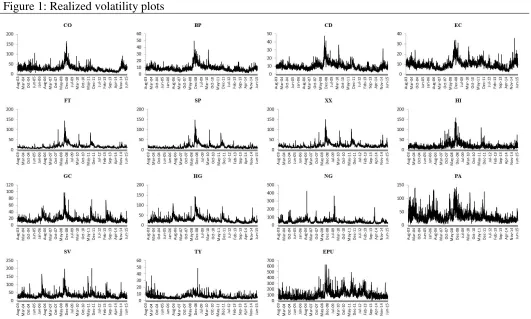
Table 2: Descriptive statistics of the series under investigation. The sample runs from 1st August 2003 to 5th August 2015
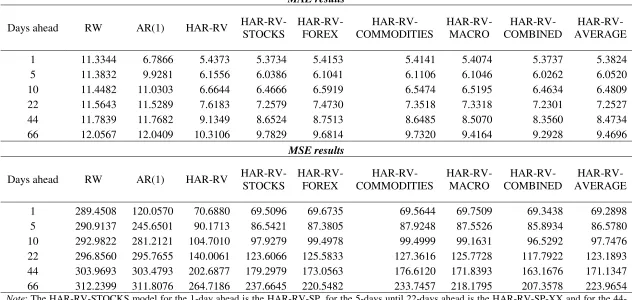
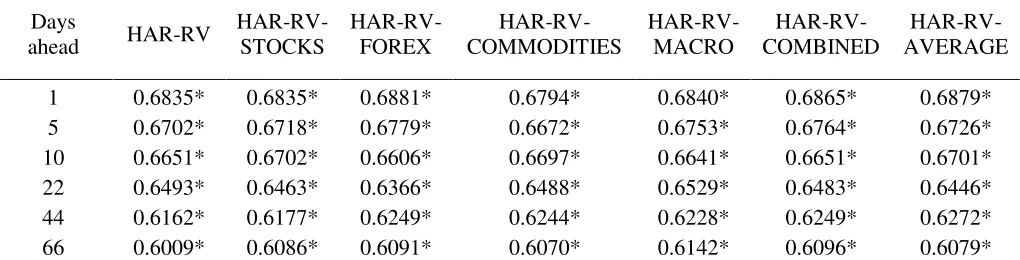
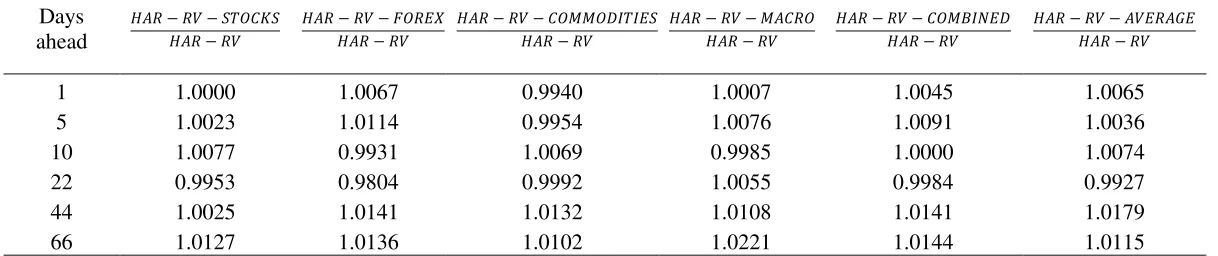
Table 3: MAE and MSE results
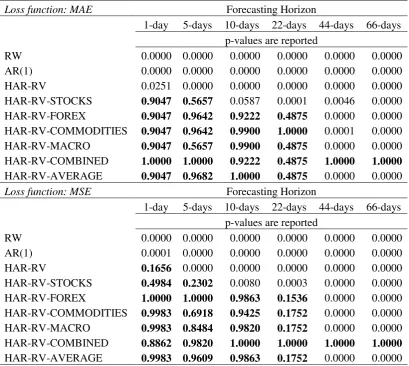
Table 4: Comparison between MAE (MSE) and MeAE (MeSE)
+7

References

Related documents