Influence of Grain Boundary Migration on {001} Texture Formation
in Al-3 mass%Mg Based Alloys during High Temperature
Compression Deformation
Kazuto Okayasu, Hiroki Takekoshi
*and Hiroshi Fukutomi
Division of Materials Science and Engineering, Graduate School of Yokohama National University, Yokohama 240-8501, Japan
Uniaxial compression tests were conducted on Al-3 mass%Mg alloy and Al-3 mass%Mg-0.2 mass%Sc alloy under various amounts of strain and strain rate at 723 K. High temperature yielding phenomena were observed at 723 K and strain rates ranging from1:0104s1to 5:0103s1. Texture examination elucidated that fiber textures were constructed in all the deformation conditions. Texture measurement revealed that the main component of the fiber texture changed fromf011g þ f001gto {001} with an increase in strain when the viscous motion of dislocation is the dominant deformation mechanism in the binary alloy. Texture changes are also seen at strength of the {001} component in the binary alloy that increased with increase in strain rates between5:0104s1and5:0103s1up to a strain of1:0, while in the ternary alloy, neither variation of the pole density at (011) nor (001) in inverse pole figure is observed in the same deformation conditions. It is considered that Al3Sc precipitates contribute to the suppression of grain boundary migration. This means that the grain boundary migration contribute to the development of {001} fiber texture. [doi:10.2320/matertrans.L-MRA2007869]
(Received February 1, 2007; Accepted June 5, 2007; Published July 25, 2007)
Keywords: texture, grain boundary migration, scandium trialuminide precipitates, solute atmosphere, electron back-scattered diffraction, high temperature deformation
1. Introduction
The use of aluminum alloys is expected to increase since the automotive lightening is one of the major subjects for resource saving. However, the press formability of aluminum sheet is insufficient compared to that of mild steel. Texture control is a promising method to improve the formability. The texture varies depending on deformation mode, defor-mation mechanism and heat treatment. Therefore, the under-standing of the interrelationship among these factors is important to develop the method to control textures.
In solid solution hardening type Al-Mg alloy, a high temperature yielding phenomenon1) is observed at high
temperatures and certain strain rate. It is known that the high temperature yielding is attributed to the dislocation motion with the Cottrell atmosphere.2)
The authors3,4) have been investigated the behaviors of compression deformation and texture formation in an Al-3 mass%Mg solid solution at high temperatures. Texture measurement revealed that the main component of the fiber texture changed from {011} (compression plane) tof011g þ f001g and to {001} with an increase in strain when the viscous motion of dislocation is the dominant mechanism of the deformation. It is suggested that the grain boundary migration contributes to the formation of {001} fiber texture. In this study, behaviors of texture formation in both single phase Al-3 mass%Mg and Al-3 mass%Mg-0.2 mass%Sc with Al3Sc precipitates which are stable at high temperatures were
experimentally investigated at 723 K under various amounts of strain and strain rates, in order to elucidate the role of grain boundary migration in the formation of {001} texture.
2. Experimental Procedure
2.1 Materials and compression tests
[image:1.595.303.550.742.783.2]The ingot of 3 mass%Mg (hereafter expressed as Al-3Mg) alloy was prepared by melting and casting in air. The surface layers of the ingots were removed by machining. After the homogenization, the ingot was rolled to 50% of their original thickness at room temperature. The ingot of Al-3 mass%Mg-0.2 mass%Sc (hereafter expressed as Al- Al-3Mg-0.2Sc) alloy was kindly provided by Kobe Steel, Ltd. in the form of 30% cold rolled plate. After dividing into small pieces, they were additionally rolled to 50% reduction at room temperature. In total, about 68% reduction of their original thickness was given by cold rolling. The chemical compositions (in mass%) of these alloys are shown in Table 1.
Cylindrical specimens with various sizes were prepared by spark erosion machining for compression tests. Aspect ratio of specimens was kept at 1.5 for all sizes of specimens. The specimens of Al-3Mg alloy were annealed at 773 K for 1.2 h before the tests. The specimens of Al-3Mg-0.2Sc alloy were solution treated at 873 K for 1 h and were water quenched. In order to precipitate Al3Sc, the specimens were aged at 773 K
for 49 h and were quenched into water before the tests. Compression tests were conducted under constant cross-head speed conditions at 723 K in air. Final strain rates were evaluated by the calculation based on the crosshead speed and final height of specimens. In this paper, the final strain
Table 1 Chemical compositions of the alloys (mass%).
Alloy Mg Si Fe Zn Al
Al–3Mg 3.32 0.06 0.01 — bal.
Al–3Mg–0.2Sc 3.10 0.03 0.04 0.01 bal.
*Graduate Student, Yokohama National University. Present address: Hino
Motors Ltd., Hino 191-8660, Japan
Special Issue on Crystallographic Orientation Distribution and Related Properties in Advanced Materials
rate is used to express the deformation condition. Final strain rates were in a range between1:0104s1and5:0103
s1. The infrared-ray furnace was used for heating.
Imme-diately after the deformation, the furnace was opened and the power supply was switched off simultaneously, and then specimens were quenched into water within at most 20 s, in order to prevent the change in microstructure after high temperature compression test.
2.2 Microstructure observation and texture measure-ment
After the compression tests, the mid-plane section of the specimens were prepared by mechanical and electrolytic polishing. Microstructures were observed using optical microscope (OM) and scanning electron microscope (SEM). Texture measurements were conducted on the mid-plane sections by the Schulz reflection method using nickel filtered copper Kradiation. The diffracted X-ray intensities were measured on 111, 200 and 220 reflections and {111}, {001} and {011} pole figures were constructed. Based on these three pole figures, orientation distribution function (ODF) was calculated by the Dahms-Bunge method.5)
Textures were examined on the basis of pole figures and inverse pole figures calculated from ODF.
2.3 Grain structure map
Local crystal orientations were measured by the electron back-scattered diffraction (EBSD) technique. The measure-ments were performed every 4mm. The minimum rotation angle between neighboring points of measurement was calculated by the commercial program (OIM Analysis Version 3.08) developed by TexSEM Laboratories, Inc. Whenis between 5 and 15, it is defined as a low angle grain boundary. Whenis larger than 15, it is defined as a high angle grain boundary. Figures on the position and the shape of grains were drawn based on the orientation measurement. These figures are expressed ‘‘grain structure maps’’ in the present paper.
3. Results
3.1 Initial microstructures
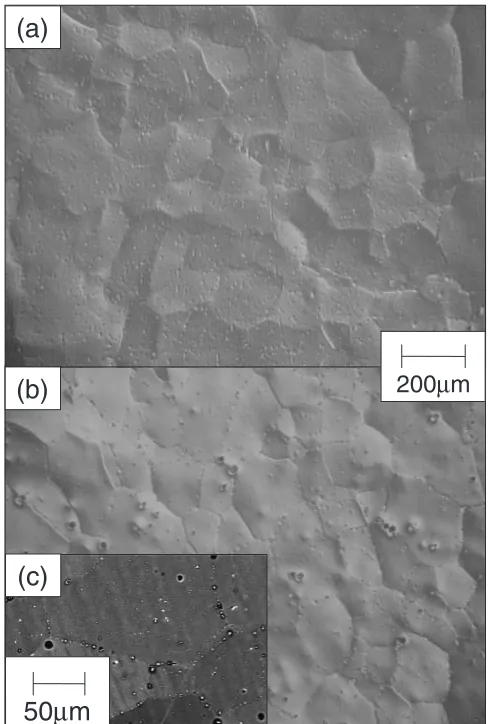
Figures 1(a)(b) and (c) show OM and SEM micrographs before compression, respectively. Figure 1(a) exhibits for Al-3Mg, Figs. 1(b) and (c) for Al-3Mg-0.2Sc. Figure 1(c) was taken using backscattered electron mode. Many Al3Sc
precipitates smaller than 1mmare observed in grains, while large particles, probably Al3Sc, exist along the grain
boundaries as white particles. The average grain sizes of these Al-3Mg and Al-3Mg-0.2Sc alloys derived from OM micrographs using linear intercept method are 90mm and 99mm, respectively. These two alloys consist of equiaxed grains, and grain orientations were confirmed to be random.
3.2 Stress – Strain Curves
Figure 2 shows the true stress - true strain curves examined at 723 K under strain rates of1:0104s1,1:0103s1
and5:0103s1. Figures 2(a) and (b) exhibit the results of Al-3Mg and Al-3Mg-0.2Sc, respectively. The high temper-ature yielding phenomena are observed in all the cases. Flow
stresses decrease with decrease in strain rate. The level of flow stress of Al-3Mg-0.2Sc shown in Fig. 2(b) is less than half of that reported by Ihara and Miura6)where the aging was conducted at 723 K (50 K lower than the present case) for
105s (about one half of the present case). The stress-strain
200
µ
m
(a)
(b)
(c)
50
µ
m
Fig. 1 Optical micrographs and backscattered electron micrograph before compression. (a) shows the microstructure of Al-3Mg. (b) and (c) show the microstructures of Al-3Mg-0.2Sc. Al3Sc precipitates are shown in (c) as white particles.
0
0.5
1
0
10
20
30
True Strain,
ε
ε =5.0 10-3s-1
Al-3Mg, 723K
ε =1.0 10-3s-1
ε =1.0 10-4s-1
(a)
True Stress,
σ
/MPa
0.5
1
1.5
0
10
20
30
True Strain,
ε
ε =5.0 10-3s-1
Al-3Mg-0.2Sc, 723K
ε =1.0 10-3s-1
ε =1.0 10-4s-1
(b)
[image:2.595.304.548.71.433.2] [image:2.595.308.548.506.661.2]curves for Al-3Mg-0.2Sc are similar to that of Al-3Mg reported by the other researchers1,7)as shown in Fig. 2. This
indicates that the precipitates are coarse due to long time aging and hence their effect on the dislocation motion is quite limited.
3.3 Texture behaviors
The {111} pole figures are examined after the deformation at 723 K under a strain rate of 1:0103s1 up to a true
strain of 1:0 for Al-3Mg (Fig. 3(a)) and Al-3Mg-0.2Sc (Fig. 3(b)). Pole density is projected onto the compression plane. The average pole density is used as units. The pole density is distributed on latitude circle in both figures. This
means the formation of fiber textures in both alloys. In the present study, formation of fiber texture was confirmed for all of the deformation conditions by the examination on pole figures. In Fig. 3(a), the area of high pole density appears about 35and 55away from the center. In Fig. 3(b), the area of high pole density appears about 35away from the center. The area of high pole density spreads to about 55away from the center.
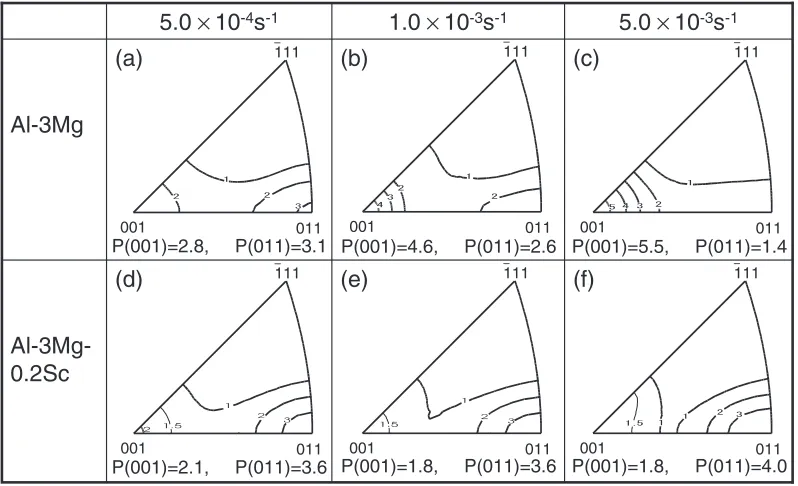
Figure 4 shows the inverse pole figures for the specimen deformed at 723 K up to a strain of1:0 under strain rates of 5:0104s1, 1:0103s1 and 5:0103s1. The results of Al-3Mg and Al-3Mg-0.2Sc are given in Figs. 4(a)– (c) and (d)–(f), respectively. Again, the average pole density
1
3
1
1 1
1 1 1
1
1 1
1 1
3 3
3 3 5 3
1
1
1 1
5
5
7
7
7
55°
35°
(a)
3 1
1
1 1
1 1
1
1 1
1 1
1
1 1
3 3
5 5
3
3
3 55°
35°
(b)
Fig. 3 {111} pole figures for the specimens of (a) Al-3Mg and (b) Al-3Mg-0.2Sc compressed at 723 K under a final strain rate of 1:0103s1up to a strain of1:0. The pole density is projected onto the compression plane. The average pole density is used as units.
(f)
(e)
(d)
Al-3Mg-0.2Sc
(c)
(b)
(a)
Al-3Mg
5.0
×
10
-3s
-11.0
×
10
-3s
-15.0
×
10
-4s
-1P(001)=2.1, P(011)=3.6
001 011
111
P(001)=1.8, P(011)=3.6
001 011
111
P(001)=1.8, P(011)=4.0
001 011
111
P(001)=2.8, P(011)=3.1
001 011
111
P(001)=4.6, P(011)=2.6
001 011
111
P(001)=5.5, P(011)=1.4
001 011
111
[image:3.595.123.474.78.264.2] [image:3.595.99.498.315.558.2]is used as units for drawing the contour lines. Accumulation of pole density is observed at (001) and (011) in all of six inverse pole figures, namely f001g þ f011g double fiber texture is constructed irrespective of the kind of alloys and deformation conditions. However, difference in the effect of deformation condition on the texture development is ob-served between Al-3Mg and Al-3Mg-0.2Sc. Comparison of pole densities at (001) and (011) given below the figures suggests that development in {001} component and weak-ening in {011} component occur in the case of Al-3Mg as shown in Figs. 4(a)–(c), while no big change in the pole densities at (001) nor (011) exists between Figs. 4(d) and (f) for Al-3Mg-0.2Sc.
Figures 5(a) and (b) show the inverse pole figures for Al-3Mg compressed at 723 K up to true strains of1:4under a final strain rate of 5:0104s1 and 1:0103s1,
respectively. With an increase in strain from1:0(Figs. 4(a) and (b)) to 1:4 (Figs. 5(a) and (b)), the pole intensity increases at (001) and decreases at (011); a sharp fiber texture with {001} component is formed in Al-3Mg alloy. However, with an increase in strain from 1:0 (Fig. 4(d)) to 1:5
(Fig. 6) for Al-3Mg-0.2Sc alloy, weakening in {011} component and no change in {001} component are observed.
3.4 Grain structure after deformation
A part of the Grain structure maps derived from EBSD
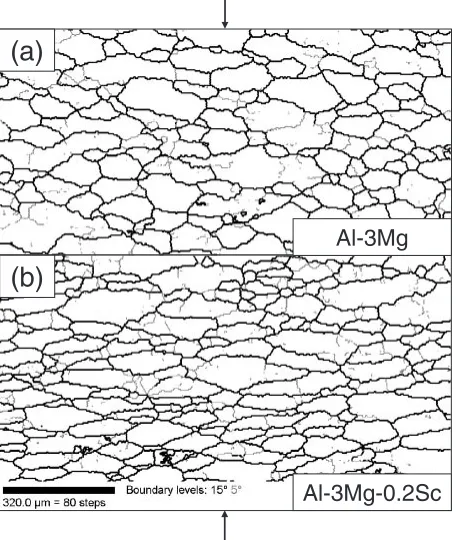
measurements on the specimens deformed at 723 K are shown in Figs. 7 and 8. High angle grain boundaries are drawn by a misorientation angle greater than 15using black thick lines. Low angle grain boundaries are drawn by a misorientation angle between 5 and 15 using gray thin lines. Figures 7(a) and (b) correspond to inverse pole figures shown in Figs. 4(a) and (d), respectively. The observations are conducted on the transverse section; the arrows in the figures indicate the compression axes. The mean grain aspect ratios (vertical length/horizontal length of the crystal grains) evaluated by linear intercept methods from these grain structure maps are about 0.7 and 0.3, respectively.
The grain structure maps for compression plane are shown on Al-3Mg (Fig. 8(a)) and Al-3Mg-0.2Sc (Fig. 8(b)) com-pressed at 723 K under a strain rate of5:0104s1up to a strain of about1:5. There are a lot of grains with irregular shape in Fig. 8(a). The shape of the grains suggests that several subdivided grains combine to one big grain by grain boundary migration. A small number of the low angle grain boundaries exist in Fig. 8(a). In contrast, a large number of the low angle grain boundaries, and small grains exist around the big grains in Al-3Mg-0.2Sc alloy as shown in Fig. 8(b).
4. Discussion
4.1 Mechanism of high temperature deformation
In solid solution hardening type alloys, it is known that the dislocations can move with the Cottrell atmosphere in a certain range of high temperature deformation conditions:1,2) so called atmosphere dragging becomes possible. Work softening is one of the indications of atmosphere dragging. It
(a) (b)
P(001)=4.8, P(011)=1.9
001 011 111
P(001)=7.0, P(011)=1.6
001 011 111
Fig. 5 Inverse pole figures for Al-3Mg compressed at 723 K, up to a true strain of 1:4 under final strain rates of (a) 5:0104s1 and (b) 1:0103s1.
P(001)=2.1, P(011)=2.8
001
011
111
Fig. 6 Inverse pole figure for Al-3Mg-0.2Sc compressed at 723 K, up to a true strain of1:5under a final strain rate of5:0104s1.
(a)
(b)
Al-3Mg
Al-3Mg-0.2Sc
[image:4.595.51.290.71.194.2] [image:4.595.314.542.75.345.2] [image:4.595.88.246.259.426.2]is understood that the dislocation velocity decreases around the yield point due to the multiplication of dislocations, resulting in the decrease in the flow stress. Although there are other possibilities causing work softening during high temperature deformation, such as dynamic recrystalliza-tion,8–10) adiabatic deformation11)etc., atmosphere dragging is most plausible in the present case. In order to examine the occurrence of dynamic recrystallization, the compression test was conducted at 723 K up to a true strain of0:1close to the peak strain under the same initial strain rate as in Fig. 4(b), and microstructure was observed. Figure 9 shows the grain structure map after the deformation. No new grains are observed. This means that work softening can not be attributed to dynamic recrystallization.
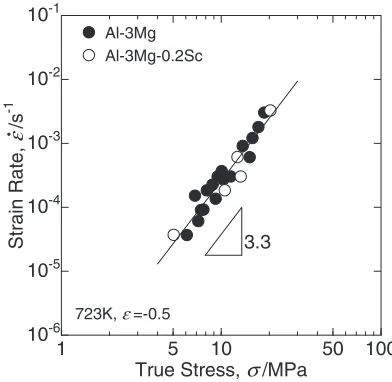
Figure 10 is the double logarithmic plot showing the true stress vs. true strain rate relationship for the compression at 723 K. The true stress is evaluated at a true strain of0:5. The filled circles and the open circles show the results on Al-3Mg and Al-Al-3Mg-0.2Sc, respectively. Both alloys fall on the same straight line. The stress exponent evaluated from the slope of the line is about 3. This coincides with the results reported by the other researchers.12,13) Namely in these deformation conditions, it is considered that the deformation is controlled by the viscous motion of dislocations.2,12)
The grain aspect ratio in Fig. 7(b) is about 0.3. The aspect ratio for the true strain of1:0derived from the geometrical evaluation under the constant volume assumption is 0.22: this suggests that the Al3Sc precipitates effectively reduced the
grain boundary migration. The stress levels for Al-3Mg-0.2Sc are almost the same as that of Al-3Mg. This indicates that the Al3Sc precipitates produced by long time aging are
not effective obstacles for dislocation motion.
4.2 Texture change
As shown in Figs. 4(a) and 5(a), the formation of {011} texture of Al-3Mg alloy precedes the development of {001} texture. The {001} texture does not seem to be formed by continuous orientation change from the {011} texture, because two independent density peaks are observed around (001) and (011) in inverse pole figure. The inverse pole figures of Al-3Mg-0.2Sc (Figs. 4(d)–(f)) show that the development of {001} texture does not occur because of reducing grain boundary migration by Al3Sc precipitates.
(a)
(b)
Fig. 8 Grain structure maps, derived from EBSD measurement, of (a) Al-3Mg and (b) Al-3Mg-0.2Sc compressed at 723 K under a strain rate of5:0104s1up to a true strain of1:4and1:5, respectively.
Al-3Mg
Fig. 9 Grain structure map, derived from EBSD measurement, of Al-3Mg compressed at 723 K up to a true strain of0:1under the same initial strain rate as in Fig. 4(b).
1 5 10 50 100
10-6 10-5 10-4 10-3 10-2 10-1
723K, ε =-0.5
True Stress, σ/MPa
Strain Rate,
ε
/s
-1
3.3 Al-3Mg
[image:5.595.128.470.69.261.2]Al-3Mg-0.2Sc
[image:5.595.49.291.309.441.2] [image:5.595.327.523.311.502.2]This means that {001} component of texture in Figs. 4(a)–(c) develops by consuming {011} and other grains. Inverse pole figures of Al-3Mg-0.2Sc with increase in strain from 1:0
(Fig. 4(d)) to 1:5 (Fig. 6) show the weakening in {011} textures. This suggests the occurrence of dynamic recrystal-lization during high temperature deformation. Figure 8(b) is also an evidence for dynamic recrystallization where a lot of small grains are observed around large grains.
4.3 Development mechanism of {001} texture
Otsuka and Horiuchi14)investigated the lattice rotation of Al-3 mol%Mg single crystals with various orientations by tensile creep tests where the viscous motion of dislocations dominates the deformation. The present authors3) also investigated lattice rotation of Al-3 mass%Mg single crystals by compression tests where the viscous motion of dislocation is the dominant deformation mechanism. The amount of lattice rotation was quite small when the initial orientations are close to (001), which coincides with the result by Otsuka and Horiuchi. These findings suggest that {001} orientation is stable for the uniaxial deformation. Weak but obvious peak in the pole density at (001) of Al-3Mg-0.2Sc appearing in Figs. 4(d) to (f) suggests that the grains with {001} orientations remained after the large amount of deformation due to their stability. Gourdet and Montheillet15)have been
reported stability of {001} orientation as quasi-stable orientation using single crystals of AA1199 pure aluminum. They showed that a cubic sample of {001} orientation retained high pole density, at its original location after compression at 380C to strain of 1:5under strain rate of
102s1. This is an evidence that {001} orientation is stable
for the uniaxial deformation at high temperature.
In the case of the single crystals with initial orientations far from {001}, the amount of lattice rotation was larger than that for the orientations close to {001}. The direction of the lattice rotation coincided with the expectation based on the single slip of {111}h110isystem.3)
Development of {011} texture is also found on Al-3Mg-0.2Sc as shown in Figs. 4(d)–(f). This indicates that the formation of {011} fiber texture can be attributed to the slip deformation by {111}h011islip. It is thus concluded that the texture change in Al-3Mg from f011g þ f001g to {001} textures is caused by grain boundary migration which extends the grains with {001} orientation.
5. Conclusions
In order to understand the formation mechanism of {001}
fiber texture during the high temperature uniaxial compres-sion deformation of Al-3 mass%Mg solid solution alloy, deformation and texture development behaviors of Al-3Mg and Al-3Mg-0.2Sc alloys were investigated under various temperatures and strain rates up to various amounts of true strain. It has been found that fiber texture is constructed in all the deformation conditions. Increase in strain rates results in the change in the main component of the fiber texture for Al-3Mg, while no obvious change in the main component is observed in the case of Al-3Mg-0.2Sc. That is, the transition from f001g þ f011g fiber texture to {001} fiber texture is strongly suppressed by Al3Sc precipitates. It is thus
con-cluded that development of the {001} texture is attributable to the growth of {001} oriented grains by grain boundary migration.
Acknowledgements
The authors thank Ms. H. Shimada, graduate student of Yokohama National University, for her assistance in con-ducting experiments. The authors also appreciate to The Japan Light Metal Educational Foundation, Inc. for the financial support.
REFERENCES
1) R. Horiuchi, H. Yoshinaga and S. Hama: Trans. Japan Inst. Metals6
(1965) 123–130.
2) A. H. Cottrell and M. A. Jaswon: Proc. R. Soc.A 199(1949) 104–114. 3) K. Okayasu and H. Fukutomi: Mater. Sci. Forum495–497(2005) 579–
584.
4) K. Okayasu and H. Fukutomi: J. Japan Inst. Metals70(2006) 562–567. 5) M. Dahms and H. J. Bunge: J. Appl. Cryst.22(1989) 439–447. 6) K. Ihara and Y. Miura: Mater. Sci. Eng. A387–389(2004) 647–650. 7) S. R. Chen and U. F. Kocks:Hot Deformation of Aluminum Alloys, ed.
by T. G. Langdon, H. D. Merchant, J. G. Morris and M. A. Zaidi, (The Minerals, Metals and Materials Society, 1991) pp. 89–104.
8) M. J. Luton and M. Sellars: Acta Metall.17(1969) 1033–1043. 9) T. Sakai and J. J. Jonas: Acta Metall.32(1984) 189–209. 10) M. Hasegawa and H. Fukutomi: Acta Mater.51(2003) 3939–3950. 11) Y. B. Guo, Q. Wen and M. F. Horstemeyer: Int. J. Mech. Sci.47(2005)
1423–1441.
12) R. Horiuchi and M. Otsuka: Trans. Japan Inst. Metals13(1972) 284– 293.