Isolation of Magnetite Nanoparticles by Colloidal Dispersant
in Aqueous Solution
Chang-Neng Shauo
1, Chuen-Guang Chao
1and Ming-Chin Cheng
21
Department of Materials Science and Engineering, National Chiao Tung University, 1001 Ta Hsueh Road, Hsinchu, 300, Taiwan, R. O. China
2Materials & Electro-Optics Research Division, Chung Shan Institute of Science and Technology,
P. O. Box. 90008-8-8, Lung-Tan, Tao-Yuan, 325, Taiwan, R. O. China
Nanometer-scale magnetite particles were prepared in a dispersing system with a dispersant at a very low concentration. The mean sizes of the particles prepared under optimum conditions were determined using transmission electron microscopy (TEM) to be approximately 3.8 nm. X-ray diffraction and electron diffraction pattern showed that the particles’ phase was consistent with magnetite. The magnetic characteristics were studied using a vibration sample magnetometer (VSM). The dried samples exhibited approximately superparamagnetic behavior.
(Received August 11, 2005; Accepted November 4, 2005; Published January 15, 2006)
Keywords: Nanometer-scale, magnetite, dispersing system, dispersant, superparamagnetism
1. Introduction
The preparation of ultrafine particles with nanometer dimensions is a field of intense research because of the novel properties exhibited by such particles. Particles of such small dimensions have important industrial applications, ranging from the fabrication of ceramics through magnetic recording and bioprocessing to catalysis. Magnetic particles have been synthesized by chemical reaction in microemulsion. Tradi-tionally, this reaction has been performed using a micro-emulsion system, Aerosol OT (AOT)/n-heptane/water.1–3)In
this study, nanometer-scale magnetite particles are synthe-sized in a new dispersing system that consists of a polymeric dispersant and water.
Dispersing agents can be divided into the following two classes4)according to chemical structure-polymeric
disper-sants and surfactants. The primary differences between these two types of dispersant are their molecular weights, their stabilization mechanism and stability.
Polymeric dispersants stabilize paints, coatings and ink systems by steric stabilization. They have a two-component structure, which meets the following requirements.
(1) They must be able to be strongly adsorbed onto the surface of particles and so must have a particular anchoring group.
(2) The molecule must contain polymeric chains that sterically stabilize the required solvent or the resin solution system.
In contrast, the stabilization mechanism of surfactants is electrostatic: the polar groups forming an electrical double layer around the pigments particles. Due to the Brownian movement the pigment particles frequently encounter each other in the liquid medium thus having a strong tendency to re-flocculate on the let down stage. Because of their chemical structure (e.g.: low molecular weight) and the electrostatic method of stabilization, surfactants may cause as water sensitivity: Surfactants generally have a tendency to provide water sensitivity to the final coating, thus making them inappropriate for use in outdoor application.
The effectiveness of polymeric dispersants is determined
by the adsorption of the anchoring groups onto the pigment surface. The anchoring groups can be amino, carboxylic, sulfonic or phosphoric acids, or their salts. The crucial requirement is that the chains are successfully anchored to the surface of the pigment, and that the surface of the particles is covered with sufficiently dense chains to ensure that the particle–particle interaction is of at least the minimized.
The surfaces of pigments depend on anchoring groups of polymeric dispersants. The associated wide range of anchor-ing mechanisms allows polymeric dispersants to disperse inorganic pigments including magnetite, and pigments with polar surfaces. Therefore, the polymeric dispersant that can disperse the magnetite is also able to restrict the growth of magnetite and to suspend it during synthesis in the dispersing system. The absorption of anchoring groups onto the new nuclei of the magnetite restricts their growth, minimizing the particle–particle interaction during the reaction in the dispersing system. Therefore, this approach is suitable for the synthesis of various inorganic particles. Additionally, the colloidal particles prepared by this approach may be more stable than traditional surfactants, such as sodium oleic acid, dodecylamine, sodium carboxymethylcellulose and Poly(vi-nylalcohol) (PVA),5–8)because the dispersant used is more stable. In the traditional technique for stabilizing pigments in water, the stabilizing charges are commonly disturbed by impurities, including other ions; other pigments with various zeta-potentials have a destabilizing effect, associated with a reduction in the repulsive force. Steric stabilization prevents this problem, making polymeric dispersants very effective in dispersing all species of pigment, even organic pigment, which are very difficult to deflocculate by traditional surfactants.
water to yield a dispersing system. Very little dispersant is required, and the approach is therefore much easier to implement, and costs much less, than traditional micro-emulsion approaches. Because of the use of the dispersant, attempts have been made to stabilize, isolate and prepare homogeneously dispersed magnetite nanometer particles in the form of an organic resin to produce a colloidal system, such as printing ink. The fact that this can be done is the greatest advantage of this approach. This work aims to compare the size and magnetic characteristics of magnetite prepared by co-precipitation (no dispersant added) with that of magnetite prepared using a dispersing system.
2. Experimental Methods
Pure FeCl2
.
4H2O (Katayama Chemical Co. Ltd.), FeCl3.
6H2O and NaOH (Merck) were used. The dispersant was of
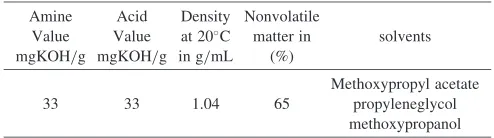
commercial grade (Disperbyk 181 BYK-Chemie GmbH), whose physical data was shown in Table 1. Deionized water was further purified by distillation (18.2 M).
Magnetite was prepared as follows. 0.15 M FeCl2.4H2O/
0.3 M FeCl3.6H2O and four concentrations of dispersant
were dissolved in 400 mL of distilled and deionized water. The concentrations (mass%) of the dispersant were 0,2:13 104, 1:07103 and 5:34103. The concentrations of
the dispersant presented herein are mass% which is equiv-alent to the total amount of the composition basis. Table 2 presents the composition of the samples of the dispersing system. 3 M NaOH aqueous solutions had previously been prepared. Then, in a N2 purged environment, a particular
volume of the NaOH solution was dropped into the iron salt solution with vigorous stirring, and the pH of the mixed solution was maintained at pH110:2. When these two solutions were mixed, the system immediately turned black. The reactant was then heated at 80C for 60 min. The
magnetite (plus bound dispersant) was washed thoroughly three times in deionized water and isolated by magnetic separation from the dissolved dispersant, to remove the unbound dispersant. Magnetite particles were thus obtained. The phase analysis of the powders that had been dried at 70C in an oven for 24 h, was conducted by powder X-ray
diffraction (XRD) using a MAC Science M03X diffractom-eter at room temperature, with Cu Kradiation at 40 KV and
20 mA. The diameter and morphology of the magnetite particles, which were dispersed in water, more than 100 particles were investigated by transmission electron mi-croscopy (TEM) on a JEOL JEM-2010 transmission electron microscope.
The adsorption of dispersant on the surface of magnetite powders was studied by GC/MS (Agilent 5973 GC/MS) with pyrolysis 400C for 0.5 min. The temperature of the
oven was programmed to rise from 40 to 300C at 8C/min.
The amount of dispersant attached to the magnetite particles were determined by thermogravimetry (Perkin Elmer Ther-mal Analysis) with linear heating in air at 10C/min to
700C. Dynamic light scattering (DLS) (Photal ELS-800,
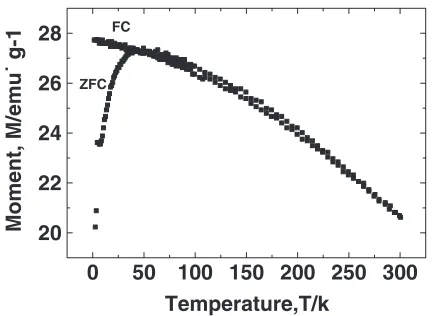
OTSUKA Electronics) was used to measure the re-suspen-sion of the colloidal samples, after they had been stored for three months. Before any measurement was made, the colloidal samples were shaken by ultrasound for 5 min. The magnetization of the dried powder was measured at room temperature using a vibration sample magnetometer (Lake-shore). The hysterisis loop was plotted in an applied field of H¼1:5KOe. The magnetic susceptibility and magnetization were measured on a Quantum Design, Inc. model 7-T MPMS superconducting quantum interference device (SQUID) magnetometer. In the dc-magnetic susceptibility measure-ment, two different procedures were used: (1) zero field cooling (ZFC), where the sample was slowly cooled in zero field to a temperature of 2 K at which the measuring field of 1.0 kOe was switch on and the magnetization was measuring as a function of temperature from 2 to 300 K, and (2) field cooling (FC), where the field of 1.0 kOe was turned on at a temperature well above the superparamagnetic blocking temperature before the sample was cooled down to 2 K.
3. Results and Discussion
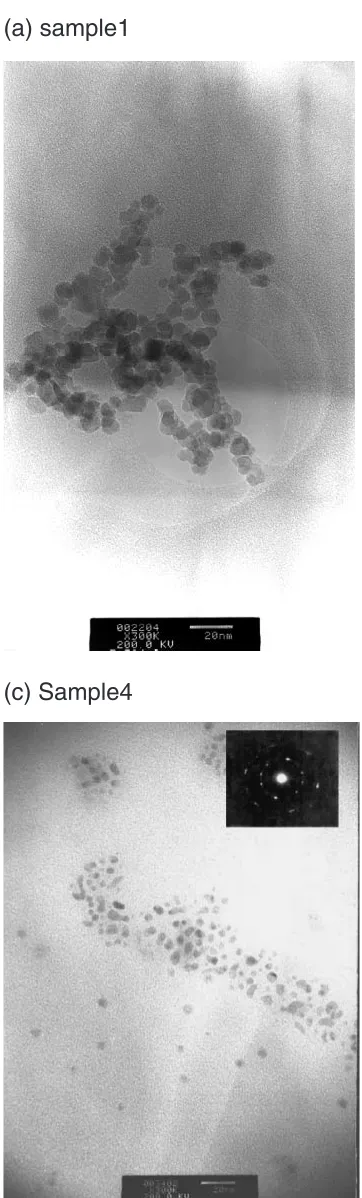
The sizes of the particles of the samples were obtained by TEM. The TEM images in Fig. 1 are of (a) sample 1, the average particle size d is around 8.3 nm; (b) sample 3,
d5:9nm, and (c) sample 4, d3:8nm. They indicate clearly that more dispersant is associated with smaller particles. The photograph of sample 4 (diagram c) shows that the magnetite synthesized with 5:34103 (mass%)
dispersant is isolated. The other samples aggregate during drying. A critical obstacle to assembling and maintaining a nanoscale material from molecular clusters is the tendency not to aggregate and to reduce the energy associated with the high surface area to volume ratio.9)Without dispersant, the
[image:2.595.45.292.612.681.2]particles are directly contact with each other as uncontrolled flocculates. In contrast, no direct particle–particle contact occurs between controlled flocculates. The distribution of the spaces shows the existence of the potential barrier of the absorbed layer of the dispersant molecules. The thickness of the potential barrier of the absorbed layer was estimated to be 1.8–5.3 nm. The dispersant molecules are always located between the particles. Figure 1(c) clearly shows the benefit of the coexistence of the dispersant, at the moment of precipitation, in protecting the newly formed minute particles against rapid flocculation. The dispersant is critical herein because the surface of the particles is covered with enough dense polymer chains to ensure that the particle–particle Table 1 Physical data of the dispersant.
Amine Value mgKOH/g
Acid Value mgKOH/g
Density at 20C in g/mL
Nonvolatile matter in
(%)
solvents
33 33 1.04 65
Methoxypropyl acetate propyleneglycol methoxypropanol
Table 2 Compositions of dispersing systems.
sample H2O (mL) /dispersant (g)
concentration
(mass%) Fe 2þ/Fe3þ
1 400/0 0 1/2
[image:2.595.45.290.711.785.2]interaction is minimized. Therefore, this method was used to stabilize and isolate a mesoscopic form of magnetite.
Figure 2 presents the variation in the X-ray diffraction patterns with dispersant concentration. The main peaks coincided in all cases. The two most intense diffraction peaks were at2¼35:55with ad-value of 0.253 nm, and at
2¼62:89with ad-value of 0.1483 nm. They were similar to that of standard Fe3O4. It was consistent with the electron
diffraction pattern presented in the inset of Fig. 1(c). The peaks (sample 4) associated with the particles clearly became broader as dispersant was added. The sizes of the nano-crystallites were determined using Scherrer’s formula,10)
¼ 0:89
Lcos;
whereL is an average crystallite size, and represents the
(a) sample1
(b) sample3
(c) Sample4
[image:3.595.125.455.70.668.2]X-ray radiation wavelength. is the half-width of a diffraction line at . An increase in represents a drop in
L. The broadening of the XRD peaks (sample 4) is therefore dominated by drop in the crystallite size, which is directly related to the drop in the particle size.
Figure 3 presents the relationship among the concentration of the dispersant, the sizes of the particles and the total weight loss. After the samples had been heated to 700C, the weight
loss increased with the concentration of the dispersant. The weight loss after heating dominated by the amount of dispersant adsorbed on the magnetite, and water content in the lattice. The possible weight gain caused by the partial oxidation of Fe3O4 to -Fe2O3 is at most approximately
5 mass%.11)
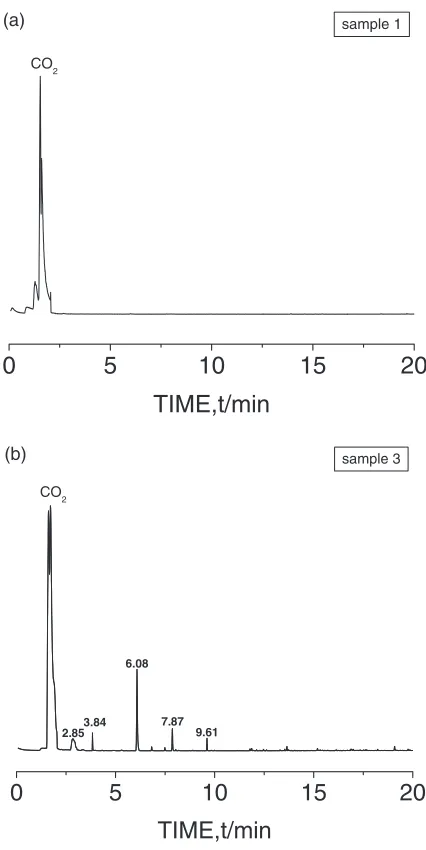
Figure 4 presents the difference between the GC/MS spectra of samples 1 and 3. Figure 4(b) presents six significant absorption bands at 1.62, 2.85, 3.84, 6.08, 7.87 and 9.61 min. These bands were associated with CO2,
benzene, benzenecarbothioic acid, styrene,-methylstyrene and acetophenone, respectively. However, sample 1 yields only one absorption band at 1.62 min, corresponding to CO2.
These data indicate that the dispersant was irreversibly adsorbed onto the surface of Fe3O4 particles in sample 3
[Fig. 4(b)], due to the addition of the dispersant, even after careful washing. In contrast, ignoring the significant peak from CO2 in sample 1 [Fig. 4(a)], there was no peak
observed, because no dispersant added.
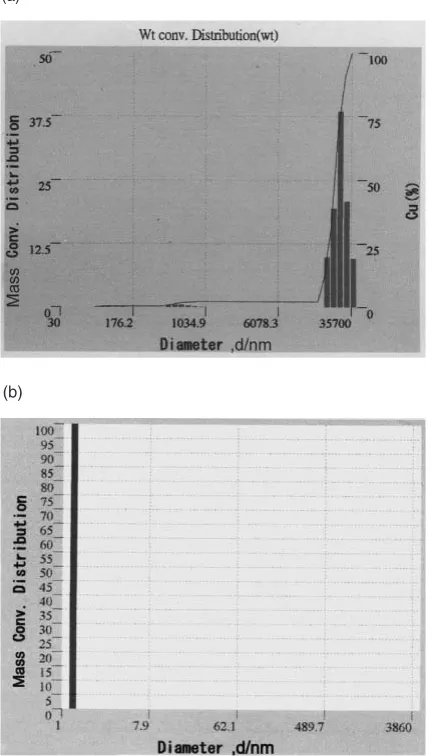
After being stored for three months, every sample exhibited partial sedimentation. All samples were re-sus-pended again by ultrasounication for 5 min. Figure 5 presents the difference between the size distributions of particles in samples 1 and 4 after they had been stored for three months, and after shaking. Sample 4 [Fig. 5(b)] exhibits a mono-dispersed as measured by DLS, withDð100Þ ¼1:2nm. The value obtained by TEM was 3.8 nm. The difference between these two values may result from inaccuracies in the instruments. This result shows that the magnetite is effec-tively suspended in aqueous media. It is supported by the TEM image [Fig. 1(c)], which shows that the particles are spatially well separated. However, sample 1 [Fig. 5(a)] to which no dispersant was added comprises particles whose sizes are broadly distributed, for whichDð100Þ ¼35700nm, is that magnetite flocculates and cannot easily be re-suspended in the absence of a dispersant. Figure 5(b) shows that the chains of the dispersant are successfully anchored to the surface of the particles, stabilizing the colloidal system, and even if they have flocculated, they can be effectively re-suspended easily. The figure also shows that the absorption of
20 30 40 50 60 sample 4
sample 1
440
511
400
311
220
2θ
Fig. 2 X-ray diffraction data for samples of Fe3O4obtained from aqueous reactions both with (sample 4) and without (sample 1) dispersant.
9 10 11
weight loss(mass%)
0 1x10-32x10-3 3x10⁻³ 4x10-35x10-36x10-3
3 4 5 6 7 8 9
Particle size,d/nm
Dispersant concentration(mass%)
Fig. 3 Relationship among concentration of dispersant, particles size and weight loss.
0
5
10
15
20
CO2
TIME,t/min
sample 1
(a)
0
5
10
15
20
9.61 7.87 6.08
3.84 2.85 CO
2
TIME,t/min
sample 3 (b)
[image:4.595.319.532.69.494.2] [image:4.595.61.277.75.230.2] [image:4.595.64.278.284.414.2]the chains of dispersant onto the new nucleus of the magnetite restricts the growth of magnetite, minimizing the particle–particle interaction during the reaction in the dispersing system. Figures 1(c) and 5(b) clearly present the dispersant envelope of the magnetite particles and keep them apart locally.
Figure 6 presents the hysteresis loops of samples 1, 3 and 4 obtained at room temperature. The properties of magnetite particles were shown in Table 3. The absolute values of saturation magnetization decreased as the particles size decreased. According to a previous study,12)the saturation
magnetization in bulk magnetite particles is 92 emu/g. The values herein are lower than that of the bulk magnetite particles in that work. Saturation magnetization has been reported to decrease as the particles size of magnetite decreases below 30 or 20 nm, because of superparamagnet-ism.13)The critical particle size at which magnetite exhibits
paramagnetism is approximately 25 nm, based on theoretical calculation from the equationKV ¼25kBT, wherekB,T,K
andV are the Boltzmann constant, the absolute temperature, the anisotropy constant and the particle volume, respective-ly.14)The coercive force,Hc, decreases and becomes almost
zero as the particles size decreases below 3.8 nm (Fig. 7). According to a previous work,15,16) dipolar interactions
between particles may cause hysteresis even when the particle diameter is below the critical value. The particle size of the magnetite prepared herein was much smaller than 25 nm, and all of the plots exhibited little hysteresis and clearly fell on the same universal curve, so these samples are expected to be superparamagnetic above the blocking temperature. Ne´el and Brown showed that for particles of volume V, a critical temperature Tb, called the blocking
temperature, exists below which the magnetic moment of the particles is fixed, such that their approach to thermodynamic equilibrium is blocked.
According to the study of Chikazumiet al., it is concluded that not only individual magnetic particle but also the clusters of these particles play an important role in magnetic phenomena. As shown in Fig. 6, it suggests that a steep rise of the experimental magnetization curve may be due to a contribution of relatively large particles, while a slow saturation may be due to relatively small particles. In one case, however, from such magnetic measurements, it is
(a)
(b)
Fig. 5 Particle sizes distribution determined from DLS.
sample 3 sample 1
-10000 0 10000 -60
-40 -20 0 20 40 60
sample 4
Magnetization, M /emu˙ g-1
Applied field, H/Oe
[image:5.595.321.535.77.216.2]Fig. 6 Magnetic hysteresis of samples, measured at room temperature.
Table 3 Properties of magnetite particles.
sample 1 2 3 4
concentration of
dispersant (mass%) 0 2:1310
4 1:07103 5:34103
Size (nm) 8.2 7.3 5.9 3.8
Saturation magnetization
(emu/g) 50.06 — 48.06 45.95 Coercive force (Oe) 5.4 4.9 4.1 1.3
0 1x10⁻³ 2x10⁻³ 3x10⁻³ 4x10⁻³ 5x10⁻³ 6x10⁻³ 3
4 5 6 7 8 9
Particle size,d/nm
Dispersant concentration(mass%) 1 2 3 4 5 6
Hc/Oes
[image:5.595.62.278.80.458.2] [image:5.595.310.543.261.510.2]concluded that the magnetic moments of the particles are oscillating thermally more or less freely. However, the superparamagnetism becomes appreciable only partly. The suppression of the superparamagnetism may be attributable, in part, to the hindrance of thermal agitation at the surface due to adsorption by the dispersant.
As shown in Fig. 6, the significant features of the magnet-ization curves are small remnant magnetmagnet-ization which results in small coercive field (5:4Oes, Fig. 7), and large saturation field. These facts indicate that magnetite fine particles are loosely coupled with each other through dipole– dipole interaction and magnetic moment of each particle directs rather freely from the other particles as the case of isolated particles.17) Because the VSM samples are dried
powder, the particles which are loosely contact each other in all samples, so it is considered that Fig. 6 have similar curves even though the aggregation states of three particle assem-blies are different. Figure 8 shows the plot of the magnet-ization M versus temperature T in sample 4. The magnet-ization exhibits similar behavior for both the ZFC and FC samples at temperature above 40 K, but changes dramatically at lower temperature. For the FC sample, the magnetization continues to increase with decreasing temperature. In con-trast, the magnetization curve for the ZFC sample shows a well-defined peak at about 40 K. The two curves are distinguishable at temperatures much lower than the temper-ature where the ZFC curve shows a maximum and the FC curve continues to increase after that temperature. The peak in the ZFC curve is probably associated with the super-paramagnetic blocking temperature of the sample, which in turn is determined by the magnetic anisotropy of the particles and their size. The broadness of the peak in the ZFC curve is probably due to the particle size distribution. The sharp maximum of the ZFC atTmax¼40K and splitting between
ZFC and FC curves just aboveTmaxindicate a narrow particle
size distribution.18)
4. Conclusions
Magnetite nanoparticles were successfully synthesized using a dispersing system. The structure and composition of
the particles were characterized by XRD and the electron diffraction pattern, which showed that the samples comprised magnetite. More dispersant corresponds to smaller particles and a more stable colloid. The TEM image shows that the dispersing system prepared by dissolving 5:34103
(mass%) of dispersant in aqueous media was optimal, and that the synthesized magnetite particles had an average diameter of 3.8 nm, which is approximately 45% of that of the sample without dispersant added. The size of the magnetite particles shows the involvement of the dispersant, which provides localized nucleation sites and sets an upper limit on the size of particles, minimizing the aggregation. The magnetic measurements showed that the magnetite nano-particles were approximately superparamagnetism. They showed that the new approach is a very effective method synthesizing magnetite nanoparticles.
Acknowledgement
The authors would also like to thank the National Science Council of the Republic of China, Taiwan, for financially supporting this research under Contract No. NSC93-2216-E009-013. Researchers at Chung Shan Institute of Science and Technology is appreciated for performing XRD, GC/MS, VSM and TEM analyses.
REFERENCES
1) Z. L. Liu, X. Wang, K. L. Yao, G. H. Du, Q. H. Lu, Z. H. Ding, J. Tao, Q. Ning, X. P. Luo, D. Y. Tian and D. Xi: J. Mater. Sci.39(2004) 2633–2636.
2) L. Liz, M. A. Lopez Quintela, J. Mira and J. Rivas: J. Mater. Sci.29
(1994) 3797–3801.
3) M. Gobe, K. Kon-no, K. Kandori and A. Kitahara: J. Collo. Inter. Sci.
93(1983) 293–295.
4) http://www.specialchem4coating.com.
5) J. F. Scamehorn, R. S. Schechter and W. H. Wade: J. Collo. Inter. Sci.
85(1982) 463–478.
6) A. Wooding, M. Kilner and D. B. Lambrick: J. Collo. Inter. Sci.144
(1991) 236–242.
7) V. Pillai, P. Kumar and D. O. Shah: J. Magn. Magn. Mater.116(1992) L299–L304.
8) R. K. Iler: J. Collo. Inter. Sci.51(1975) 338–393.
9) R. F. Ziolo, E. P. Giannelis, B. A. Weinstein, M. P. O’horo, B. N. Ganguly, V. Mehrotra, M. W. Russell and D. R. Huffman: Science257
(1992) 219–222.
10) H. P. Klug and L. E. Alexander: X-RAY DIFFRACTION PROCE-DURE. (NEW YORK: JOHNWILEY & SONS; 1974) CH. 9. p. 687– 690.
11) J. Lee, T. Isobe and M. Senna: J. Collo. Inter. Sci.177(1996) 490–494. 12) D. H. Han, J. P. Wang and H. L. Luo: J. Magn. Magn. Mater.136
(1994) 176–182.
13) T. Sugimoto: Adv. Colloid Interface Sci.28(1987) 65–108. 14) S. Chikazumi, S. Taketomi, M. Mizukami, H. Miyajima, M. Setogawa
and Y. Kurihara: J. Magn. Magn. Mater.65(1987) 245–251. 15) I. Nakatani, M. Hijikata and K. Ozawa: J. Magn. Magn. Mater.122
(1993) 10–14.
16) N. A. D. Burke, H. D. H. Stover, F. P. Daeson, J. D. Lavers, P. K. Jain and H. Oka: IEEE Trans. Magn.37(2001) 2660–2662.
17) K. Yamaguchi, K. Matsumoto and T. Fujii: J. Appl. Phys.67(1990) 4493–4498.
18) J. K. Vassiliou, V. Mehrotra, M. W. Russell and E. P. Giannelis: J. Appl. Phys.73(1993) 5109–5116.
0 50 100 150 200 250 300 20
22 24 26 28
ZFC FC
Moment, M/emu˙ g-1
Temperature,T/k
[image:6.595.62.278.69.227.2]