Composite Materials based on Light Elements for Hydrogen Storage
Takayuki Ichikawa
1, Nobuko Hanada
2, Shigehito Isobe
2, Haiyan Leng
2and Hironobu Fujii
1 1Materials Science Center, N-BARD, Hiroshima University, Higashi-Hiroshima 739-8526, Japan2Graduate School of Advanced Sciences of Matter, Hiroshima University, Higashi-Hiroshima 739-8530, Japan
In this paper, we review our recent experimental results on hydrogen storage properties of light elements Li, C and Mg based nano-composite materials. The results are summarized as follows: In the Li-N-H system, such as the ball milled 1:1 mixture of Li amide and Li hydride containing a small amount of TiCl3(1 mol%), a large amount of hydrogen (6mass%) is absorbed and desorbed in the temperature range from 150 to 250C with good reversibility and high reaction rate. Furthermore, in the ball milled mixture of 3Mg(NH
2)2and 8LiH, 7mass% of hydrogen is reversibly stored in the temperature from 140 to 220C, indicating one of the suitable hydrogen storage materials. In graphite containing a small amount of nanometer sized Fe (2at.%), a large amount of hydrogen (7mass%) is chemisorbed by ball milling for 80 h under less than 1 MPa of H2-gas pressure. However, the chemisorbed hydrogen capacity decreases with increase in the milling pressure for the 80 h ball milled graphite (down to4:1mass% at 6 MPa), while the physisorbed hydrogen capacity in graphite increases with increase in the milling pressure, reaching up to0:51:0mass% at 6 MPa. Unfortunately, the desorption temperature of chemisorbed hydrogen is higher than 300C. Therefore, some break-through is necessary for the development of carbon-based materials as one of the hydrogen storage systems. On the other hand, some nano-composite Mg catalyzed by Ni nano-particle or Nb oxide reveals superior reversible hydrogen storage properties:
6:5mass% of hydrogen is reversibly stored in the temperature range from 150 to 250C. Especially, the Nb metals uniformly dispersed in nanometer scale on the surface of MgH2, which was produced by reduction of Nb2O5, is the best catalyst we have studied so far. Thus, it seems that some Mg nano-composites catalyzed by nano-particles of d-electron transition metals is acceptable for practical applications.
(Received July 21, 2004; Accepted September 28, 2004)
Keywords: hydrogen storage, mechanical ball milling, lithium amide-imide system, metal nitrogen hydrogen system, ammonia, magnesium hydride, nano-structured graphite, catalyst, d-electron transition metal
1. Introduction
Protection of the earth from pollution is one of the most important issues to be solved by the human race. However, the fast growing world population, increasing globalization and emerging nations on the threshold of becoming highly mobile societies will yield more and more atmospheric pollution. Thus, hydrogen energy systems have been pro-posed as a means to reduce greenhouse gas and other harmful emissions from stationary and mobile sources. In order to realize hydrogen energy systems in the near future, we have to develop energy storage and transportation technologies. One of the key technologies we need to develop is a high performance hydrogen storage (H-storage) tank, especially, which is to be used in fuel-cell electric vehicles (FCEV). Containers of liquid hydrogen, high-pressure gas hydrogen, and absorbed hydrogen in chemical or metal hydrides with light elements in the periodic table are being investigated all
over the world.1–5) These methods have advantages and
disadvantages, but the method chosen will have to be compact, light, safe and affordable as on-board storage.
Condensation into liquid is particularly attractive from the viewpoint of the energy density. However, the condensation
temperature of hydrogen at 0.1 MPa is 253C and heat
transfer through the container leads directly to the loss of hydrogen. Larger containers have a smaller surface to volume ratio than small ones, so that the loss of hydrogen due to evaporation is smaller. Therefore, it is useful for a tanker, truck or bus with huge liquid hydrogen containers, but unsuitable as a hydrogen container for the compact FCEV.
In most countries, classical high-pressure tanks made of cheap steel are regularly filled up to 15 or 20 MPa. In order to run a compact FCEV for 400 km, it needs a tank that can store 4 kg of hydrogen. This means that, an internal volume of
0.225 liters is required, but this is too large a volume for a compact car. Recently, novel high-pressure tanks made of carbon-fiber-reinforced composite materials are being devel-oped; these are tested up to 60 MPa and filled up to 35 MPa for regular use. The novel high-pressure tanks would contain
about4kg hydrogen by weight, but still has the
disadvant-age that the fuel tank would be too large by volume for a compact FCEV. In order to overcome this disadvantage, a very-high-pressure tank of up to 70 MPa has been considered for FCEV. However, there is considerable risk in using very-high-pressure vessels. The compression itself is the most dangerous and complicated part. There are still problems remaining that need to be solved for high-pressure containers. It is well known that metal hydride systems can store more hydrogen in a safe and efficient way than liquid hydrogen or high-pressure hydrogen. However, materials with good storage capabilities and reversibility only desorb hydrogen at relatively high temperatures, which are too high for fuel cell application, while materials fitting these requirements are too heavy or too expensive for commercial application.
In these situations, H-storage research projects have been initiated all over the world. In 2003 in Japan, the New Energy
and Industrial Technology Development Organization
(NEDO) has set a target to develop reversible H-storage
media capable of delivering 5.5 mass% H at less than 150C
as a research and development program on H-storage materials. In USA, the Department of Energy (DOE) has set a target to develop and verify on-board H-storage systems
achieving 2 kWh/kg (6 mass%) at less than 100C by 2010.
Internationally, the International Energy Agency (IEA) has set a target to achieve a reversible H-storage medium with
5 mass% H2 recoverable at T <80C. In recent years, in
order to achieve the above targets, new materials with lighter elements, such as lithium (Li), sodium (Na), carbon (C) or
magnesium (Mg) based materials, have been developed to overcome the disadvantage of heavy weight in conventional metal hydrides.
In this paper, we review our recent experimental results on the H-storage properties of light elements Li, C and Mg based nano-composite materials, which were designed by a mechano-chemical method.
2. Hydrogen Storage Properties of Lithium Based Materials
To overcome the disadvantage of too heavy weight of conventional metal hydrides for H-storage, some chemical hydrides composed of light elements such as Li and Na have been attracted as new H-storage materials in these days. In particular, the H-storage properties of some alanate systems
have been studied by many researchers till now,6–34)in which
hydrogen is desorbed by the following 2-step reactions:
MAlH4!1/3M3AlH6þ2/3AlþH2 ð1Þ
1/3M3AlH6!MHþ1/3Alþ1/2H2: ð2Þ
Here, the total hydrogen capacities for M¼Na and Li are
theoretically calculated to be 5.6 and 8.0 mass%, respective-ly. Both the enthalpy changes of the reactions (1) and (2) for
M¼Na were estimated to be endothermic and the
reversi-bility of both the reactions were experimentally confirmed. Then, some catalysts containing Ti or Zr-elements were doped to improve the reaction rate. On the other hand, the
enthalpy changes of the reactions (1) and (2) for M¼Li have
been estimated to be respectively exothermic and endother-mic by DTA measurements. Therefore, only the second
reaction (2) for M¼Li should be reversible for H-storage.
However, the hydrogenating reaction could not be confirmed so far, because the reaction rate might be too slow for realizing the hydrogenating reaction under moderate
temper-ature and H2gas pressure.
Concerning with chemical hydrides composed of lithium and boron, many data have been also accumulated. The
lithium tetrahydroborate (LiBH4) was first synthesized in
194035) by the reaction of the ethyl lithium with diborane
(B2H6). Until now, direct synthesis from Li or LiH, B and H2
at elevated conditions up to 650C and 15 MPa of H
2pressure
has been tried by many researchers, but all the attempts
failed. Quite recently, Orimo et al. have succeeded to
synthesize LiBH4 from LiH and B at 500C and under
35 MPa of H2 gas pressure.36) On the other hand, the
hydrogen desorption (HD) process from LiBH4 was
exam-ined by Fedneva et al. in 1964.37) Three endothermic
reactions at110,280 and480C were observed in the
TDS spectra. The first peak corresponds to polymorphic
transformation, the second one to the fusion of LiBH4and the
third one starts at 380C and liberates 80% of the hydrogen in
LiBH4. Recently, Zu¨ttelet al.showed that a slight amount of
hydrogen was desorbed during the structural transformation
around 100C and major hydrogen desorption of 13.5 mass%
started at200C when the SiO
2-powder was added to the
LiBH4.38)
On the Li-N-H systems, there have been new develop-ments for H-storage in recent years. We have also started to study their H-storage properties in ball milled mixture of
metal hydrides and amides prepared by a mechano-chemical method. About our recent development on Li-N-H systems for H-storage, we will review in the following session.
2.1 Novel reaction of LiNH2 and LiH for hydrogen storage
As early as 1910, Dafert and Miklauz39)had reported that
the reaction between Li3N and H2 proceeded at 200–300C
and generated Li3NH4. However, the product was proved to
be a mixture of lithium amide and lithium hydride by Ruff
and Goerges40)as follows;
Li3Nþ2H2 !LiNH2þ2LiH: ð3Þ
Furthermore, they had claimed that the mixture was
decom-posed into lithium imide and released H2 on heating as
follows;
LiNH2þ2LiH!Li2NHþLiHþH2: ð4Þ
These were the first reports concerning hydrogen absorption and desorption reactions on Li-N-H systems. After that, there had been no researches on H-storage properties in Li-N-H systems for almost one century.
In recent years, Chenet al.41)and Hu and Ruckenstein42)
demonstrated that Li3N reversibly absorbed and desorbed
hydrogen by the following 2-step reactions at relatively low temperatures under moderate pressures;
Li3Nþ2H2$Li2NHþLiHþH2$LiNH2þ2LiH: ð5Þ
They reported that a high capacity of hydrogen (9:4
mass%) was reversibly stored in the above system. Since that, some alkali and alkali earth metal nitrides or their imides have become one of the promising families for H-storage
media.41–48)
The enthalpy change of the first step of the reaction (5)
could be estimated to be 148 kJ/mol H2 and that of the
second step to be 45 kJ/mol H2.41)Since the second reaction
has a much smaller enthalpy change for hydrogen release than the first one and has a potential for storing still a large amount of hydrogen (6.5 mass%), we focused on the second step of the reaction (5), which is expressed as follows;
LiNH2þLiH$Li2NHþH2: ð6Þ
In the above reaction, we could commercially buy both of
LiNH2 and LiH except Li2NH.
So, first of all, we started to study HD properties from the
1:1 mixture of purchased LiNH2 and LiH.46) To achieve a
good contact between LiNH2and LiH in nanometer scale, the
mixture was ball-milled by a planetary mill equipment
(Fritsch P7) under a H2-gas atmosphere of 1 MPa for 2 h. A
profile of thermal desorption mass spectroscopy (TDMS) for the ball milled mixture are shown in Fig. 1. We notice that
the NH3gas in addition to hydrogen gas is desorbed from the
ball milled mixture at higher temperature region around
350C, where the hydrogen desorption synchronizes with the
NH3 desorption. Usually, it is known that the NH3 gas is
emitted by the following decomposition reaction on heating process;
2LiNH2 !Li2NHþNH3: ð7Þ
and is estimated to be 84 kJ/mol NH3. Therefore, the NH3
emission from the mixture at higher temperatures might be
due to thermal decomposition of remaining LiNH2that could
not react with LiH because of slow reaction speed between
LiNH2 and LiH.
Then, in order to improve the reaction rate, we examined the catalytic effect on the HD properties in the ball milled 1:1
mixture of LiNH2and LiH.46)A small amount (1 at%) of Fe,
Co, or Ni metal with several nanometers diameter, and the
chloride of VCl3 or TiCl3 (1 mol%) was added to the 1:1
mixture as a catalyst before ball milling and then ball milled
for 2 h under 1 MPa of H2-gas at room temperature. In Fig. 2,
the TDMS profiles for H2and NH3gases are shown for all the
doped mixtures. The mixture containing a small amount of
TiCl3 (1 mol%) shows the most superior HD properties
among all the doped mixtures; the product shows the sharpest desorption curve and desorbs a large amount of hydrogen
(5.5–6.0 mass%) in the temperature range from 150 to 250C
at a heating rate of 5C/min. This indicates that the reaction
speed is dramatically improved by doping 1 mol% of TiCl3as
a catalyst and the doping leads to lower activation energy for the HD reaction (4) than in the mixture with no catalyst.
Here, it is noteworthy that no NH3gas emission was detected
at all in the TDMS measurement up to 450C for the mixture
doped 1 mol% TiCl3 as a catalyst within our experimental
accuracy. This result indicates that all of the LiNH2 were
completely consumed by reacting with LiH until 300C and
transformed into Li2NH and H2, leading to no NH3 gas
emission at all.
Next, we examined the reversibility of the hydrogen desorption and absorption reactions for the ball milled 1:1
mixture with the 1 mol% TiCl3catalysts.46)The reversibility
was tested by the following cyclic processes; the hydrogen
desorption was performed by keeping the product at 220C
for 12 h under high-vacuum and then the hydrogen absorption was done under pure hydrogen gas up to 3 MPa. In Fig. 3, are shown the TDMS profiles after several cycles. The amount of desorbed hydrogen slightly decreases after 2nd cycle, suggesting that a small amount of stable compounds like
Li2O, TiN or LiCl has been produced during the first heating
process. However, since the effective hydrogen capacity was still higher than 5 mass% after the initial dehydrogenation reaction and the reaction rate did not change after 2nd cycle
until 10th cycle (almost same as 3rd cycles data), we
conclude that the cycle retention is excellent.46)
Furthermore, we investigated the kinetics of the HD reaction. Figure 4 shows the logarithmic plot of the residual
100 200 300 400
Intensity (a. u.)
Temperature, T /°C
H2 NH3
Fig. 1 TDMS profiles for H2and NH3gases from the mixture of LiNH2 and LiH in the 1:1 mole ratio prepared by mechanically milling under 1 MPa H2atmosphere for 2 h.
100 200 300 400
TiCl3
Intensity (a. u.)
Temperature, T/°C
VCl3 Co Fe Ni
H2
NH3
none
Fig. 2 TDMS profiles for H2 and NH3 gases from the ball milled 1:1 mixture of LiNH2and LiH with 1 mol% of catalysts (Ninano, Fenano, Conano, VCl3and TiCl3) by mechanically milling under 1 MPa H2atmosphere for 2 h.
[image:3.595.345.512.71.379.2] [image:3.595.89.251.72.203.2] [image:3.595.329.519.453.656.2]hydrogen content ratioXH2ðtÞ=XH2ð0Þas a function of time for the desorption process from the ball milled 1:1 mixtures with
and without 1 mol% TiCl3 catalyst. Here,XH2ðtÞ=XH2ð0Þwas
determined by the thermo-gravimetric analysis (TGA), which were performed under no partial pressure of hydrogen and
NH3 using He gas as a flow gas. In this figure, the
temperature fluctuations from a programming temperature are also plotted as a function of time. We notice that the
reaction rate of the product with 1 mol% TiCl3as a catalyst is
much faster than that without catalyst and almost 90% of hydrogen is desorbed within 20 min from the catalyzed
mixture at 210C. In addition, one can see that both the
logarithmic plots are linear against time after measuring temperatures reached at the programming ones, indicating
that both the HD reactions are of first order.46)
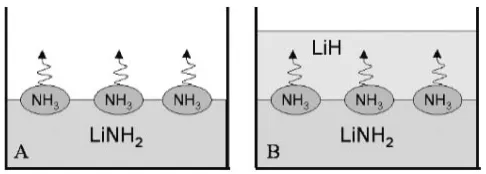
As is described above, it was clarified that the HD reaction is of first order and very fast, although it is considered to be solid-solid reaction. In order to make clear the origin of such unusual reaction behaviors, we examined the TDMS profiles
of NH3 and hydrogen gaseous emissions from a
single-layered sample of ball milled LiNH2 and a two-layered
sample composed of ball milled LiNH2and LiH,47)where the
ball milled LiH layer is placed on the ball milled LiNH2layer
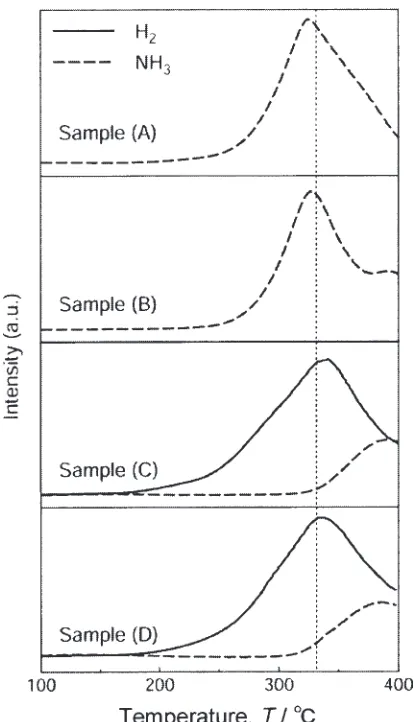
as schematically shown in Fig. 5. The detected TDMS
profiles for hydrogen and the NH3gases are shown in Fig. 6
for single-layered LiNH2 with a 1 mol% TiCl3 catalyst (A)
and without any catalyst (B), and two-layered samples with
the TiCl3 catalyst (C) and without any catalyst (D) as well.
We can see that the emission of NH3from LiNH2itself starts
from 220C, and takes a broad peak at 330C, while the
desorption of H2 from the two-layered sample synchronizes
with NH3 emission from LiNH2, irrespective of doping a
1 mol% TiCl3. This indicates that NH3emitted from LiNH2
immediately reacts with LiH and releases H2. That is, either
the reaction,
LiHþNH3!LiNH2þH2; ð8Þ
or the reaction,
2LiHþNH3!Li2NHþ2H2; ð9Þ
would be realized in this experiment. If the reaction (8) is
realized, the reaction is calculated to be exothermic (42kJ/
mol) from the literature. Therefore, the reaction (8) should
progress in the milling process under NH3-gas atmosphere
even at room temperature. Then, we performed ball mill
treatment of LiH (40mg) under NH3-gas atmosphere of
0.4 MPa for 2 h, which corresponds to the 1:1 molar ratio of
LiH and NH3. The examined X-ray diffraction (XRD) profile
indicated that the product is assigned to be a single phased
LiNH2after milling. Thus, we clarified that the reaction (8) is
one of the elemental reactions in the HD reaction (6). From the above results, we conclude that the following 2-step elemental reactions mediated by ammonia are essential for the HD reaction (6):
2LiNH2!Li2NHþNH3 ð7Þ
and
LiHþNH3!LiNH2þH2: ð8Þ
In Fig. 6, we notice two other interesting points to be
considered. One is that H2-releasing temperature from the
two-layered sample is lower than that of NH3from the single
layered sample. The other is that the doping of TiCl3 in
LiNH2and LiH gave no strong influence on both of the NH3
and H2 emission processes.
It is of interest to point out that the onset of hydrogen
desorption from the TiCl3-doped 1:1 mixture of LiH and
LiNH2 prepared by ball milling method is much lower
temperature than that in two-layered sample composed of
LiH and LiNH2with a small amount of TiCl3(1 mol%). This
indicates that TiCl3 acts as an excellent catalyst on the H2
desorption from the ball milled 1:1 mixture, but not acts as a
catalyst on both of the NH3 and H2 emissions in both
elemental reactions (7) and (8) themselves. Therefore, it
seems likely that the catalyst TiCl3 acts as a role for the
transfer of NH3 molecule from LiNH2 to LiH in nanometer
scale. Moreover, the above results suggest that LiH plays a role of something like a catalyst for the decomposition of
LiNH2 in the ball milled mixture, because the HD
temper-ature from the 1:1 mixture is actually much lower than the
NH3emission temperature from LiNH2itself. A preliminary
Fig. 4 Logarithmic plots of normalized remaining hydrogen amount,
XH2ðtÞ=XH2ðtÞ, and linear plots of measuring temperature as a function of time for the 1:1 ball milled powders with and without 1 mass% TiCl3 catalyst.
[image:4.595.65.275.68.314.2] [image:4.595.305.548.71.158.2]Raman scattering experiment for LiNH2 indicated that a
quite small amount of NH3molecule started to be liberated
from the LiNH2 particle surface around 70C, while the
decomposition of LiNH2 into Li2NH and NH3 normally
started from more than 200C.
From the above results, we conclude that the HD reaction (6) is controlled by the two-step gas-solid elemental reactions (7) and (8) mediated by ammonia. Thus, we can understand that the HD reaction (6) is first order and shows the fast reaction rate. Then, the HD reaction in reaction (6) can be expressed as follows;
LiHþLiNH2!
1
2LiHþ
1
2LiHþ
1
2NH3
þ1
2Li2NH
! 1
2LiHþ
1
2LiNH2þ
1
2Li2NHþ
1
2H2
! 1
4LiHþ
1
4LiNH2þ
1
2þ
1 4
Li2NHþ
1
2þ
1
4
H2
!
! 1
2nLiHþ
1
2nLiNH2þ
Xn
k¼1
1
2k
Li2NHþ
Xn
k¼1
1
2kH2
!Li2NHþH2: ð10Þ
That is to say: At the first step, LiNH2 decomposes into
Li2NH/2 and NH3/2, and then the emitted NH3/2 quickly
reacts with LiH/2, transforming into LiNH2/2 and H2/2. At
the second one, the produced LiNH2/2 decomposes into
Li2NH/4 + NH3/4 and then NH3/4 + LiH/4 transform to
LiNH2/4 + H2/4, and such successive steps continue until
LiNH2 and LiH completely transform into Li2NH and H2.
These successive multi step reaction might progress at low temperature by doping some appropriate catalysts like
TiCl3.47)
2.2 Novel reaction of Mg(NH2)2 and LiH for hydrogen storage
As discussed in the above section, we clarified that the HD
reaction between LiNH2and LiH was controlled by the
gas-solid 2-step elemental reactions mediated by ammonia. Similarly, we can expect that the reaction between
magne-sium amide Mg(NH2)2and LiH would also proceed through
NH3-mediating gas-solid reactions as well.
Unfortunately, we can not commercially obtain Mg(NH2)2
yet. So, we first synthesized Mg(NH2)2by ball milling MgH2
in a gaseous NH3atmosphere of 0.4 MPa using a rocking mill
with a frequency of 10 Hz for 13 h at room temperature, according to the following reaction:
MgH2þ2NH3!Mg(NH2)2þ2H2 ð11Þ
Then, a mixture of Mg(NH2)2and LiH with a molar ratio of
3:8 was mechanically milled under a hydrogen gas atmo-sphere of 1 MPa at 400 rpm for 2 h and the HD properties were examined. The TDMS and TGA profiles of the ball milled mixture without any catalysts are shown in Fig. 7. The
results indicate that a large amount of hydrogen (7mass%)
start to be desorbed at 140C and the desorption peaks at
190C at a heating rate of 5C/min almost without emitting
NH3. Here, it is noteworthy that the HD properties of the ball
milled mixture of 3Mg(NH2)2and 8LiH are much better than
those of LiNH2 and LiH2–43)from the viewpoint of both the
hydrogen capacity and the desorption temperature. The
reason may be due to the fact that Mg(NH2)2is less stable and
more easily decomposes into the corresponding imide and
nitride than LiNH2because of the smaller enthalpy change or
larger entropy change in the dehydrogenation reaction. The XRD profile of the mixture after releasing hydrogen at
400C is shown in Fig. 8(a). This shows that the product is
the mixed phases of Li2NH and Mg3N2. Therefore, the HD
reaction from the ball milled mixture of 3Mg(NH2)2 and
8LiH can be expressed by the following chemical formula;
3Mg(NH2)2þ8LiH!Mg3N2þ4Li2NHþ8H2: ð12Þ
From the reaction (12), we can theoretically calculate the
amount of H-storage capacity to be7mass%, which is in
good agreement with the experimental amount of desorbed Fig. 6 TDMS profiles for hydrogen and the NH3gases from single-layered
[image:5.595.65.272.69.430.2]hydrogen.
Next, we examined the reversibility of the reaction (12) by
following procedure. First, the milled mixture of 3Mg(NH2)2
and 8LiH is dehydrogenated in vacuum at 170C for 8 h.
Secondly, the mixture is hydrogenated by slow cooling in the
furnace after keeping it at 200C under a H
2 pressure of
3 MPa for 8 h. As shown in Fig. 8(b), the profile indicates that
the dehydrogenating reaction from 3Mg(NH2)2 and 8LiH to
Mg3N2 and 4Li2NH proceeds even at 170C in vacuum.
After the re-hydrogenating treatment, the product is again
transformed into the original mixture of 3Mg(NH2)2 and
8LiH (see Fig. 8(c)). Thus, we conclude that the chemical reaction (12) is completely reversible.
Similar to the progress of the HD reaction between LiNH2
and LiH,47)the dehydrogenation reaction from the mixture of
3Mg(NH2)2and 8LiH should proceed by the following three
kinds of elementary reactions: (i) The first one is that
3Mg(NH2)2 decomposes to 3MgNH and 3NH3, and then
3MgNH continues to decompose to Mg3N2 and NH3 at
relatively higher temperatures; (ii) the second one is that the
emitting 4NH3reacts with 4LiH and transforms into 4LiNH2
and 4H2; (iii) the third one is that 4LiNH2 decomposes to
2Li2NH and 2NH3. Continuously, 2NH3 again reacts with
remaining 2LiH, transforming into 2LiNH2and 2H2and then
2LiNH2decomposes to Li2NH and NH3, and such successive
steps continue until 4LiNH2 and 4LiH completely transform
into 4Li2NH and 4H2. It seems that these successive reactions
might proceed even at lower temperature through the close
contact between Mg(NH2)2 and LiH in a nano-scale by
milling treatment.
On the other hand, the hydrogenation reaction process in the reaction (12) can not be simply understood. This is
because that pure Li2NH is hydrogenated into LiH and
LiNH2,46,47)and similarly Mg3N2 can be hydrogenated into
2MgH2and Mg(NH2)2.49)If these reactions proceed as well,
the phases of MgH2 and/or LiNH2 might appear in addition
with the phases of LiH and Mg(NH2)2 after the
hydro-genation has been performed. However the above reactions do not proceed in this work. Therefore, if there are some elementary solid-gas reactions mediated by ammonia even in the hydrogenation reaction, the hydrogenation reaction can be understood as well. Currently, the mechanism of hydro-genation for this system is under investigation. In addition,
preliminary results indicated that the H2 release pressure in
the HD reaction is higher than 5 MPa at 200C.
In conclusion, the above experimental results indicate that
the novel metal-N-H system composed of 3Mg(NH2)2 and
8LiH prepared by ball milling is one of the promising
candidates for H-storage.48)
3. Hydrogen Storage Properties of Graphite Based Materials
Generally, hydrogen is adsorbed in carbon based materials on chemisorption and physisorption. Chemisorbed hydrogen
is strongly bound with large adsorption heat of23eV and
requires high temperatures more than 300C to be released,
while physisorbed hydrogen is more weakly bound with
small adsorption heat of0:1eV, which has been considered
to be suitable for H-storage at room temperature.
Since the discovery of new carbon materials such as carbon nanotubes, fullerenes, nanofibers and so on, much attention has been paid on hydrogen adsorption on/in new
carbon systems for H-storage.50–64) In 1997, Dillon et al.
reported that single walled carbon nanotube (SWNT)50)could
store up to510mass% of hydrogen by physisorption under
a H2 gas pressure of 0.05 MPa and at room temperature by
opening the caps of SWNT. After that, many researchers have performed similar experiments on SWNT, but their data on H-storage capacity at room temperature have widely scattered from 0 to 7 mass%. Therefore, how much hydrogen absorbs in SWNT is still an unsettled issue till now. In 1998,
Chembers et al. claimed that the Herringbone-type carbon
nanofiber could adsorb up to 67 mass% of hydrogen by physisorption at room temperature and reversibly adsorbed/
desorbed70% of the adsorbed hydrogen at room
temper-50 100 150 200 250 300 350 400
−8 −6 −4 −2
b
Weight loss (mass%)
Temperature, T /°C
a
Intensity (a.u.)
3Mg(NH2)2+8LiH
LiNH2+LiH
Fig. 7 (a) Hydrogen desorption mass spectrum and (b) weight loss percent due to thermal gravimetry analysis for the mixture of 3Mg(NH2)2 and 8LiH in the heating process up to 400C under a helium flow at a 5C/min heat rate. Here, the hydrogen desorption mass spectrum for the 1:1 mixture of LiNH2and LiH with a small amount (1 mol%) of TiCl3,13)is also shown by dotted line.
20° 40° 60° 80° 100°
c
Intensity (a.u.)
2θ
Mg(NH2)2 LiH
b
Mg3N2 Li2NH
a
Mg3N2 Li2NH
[image:6.595.75.261.70.235.2] [image:6.595.73.265.334.510.2]ature.51)These data have not been reproduced yet as well. So, it is impossible to draw definitive conclusions on the prospects for H-storage on new carbon materials at present. The usage of carbon materials for H-storage seems to be significant potential, but the path to reach the goal still requires a considerable amount of research works.
Motivated by the above reports, our group have studied the H-storage properties of nonstructural graphite prepared by
ball milling for180h under hydrogen atmosphere of 1 MPa
using Cr steel pot and balls so far.52–56)The results obtained
are summarized as follows: A large amount of hydrogen is chemisorbed up to 7.4 mass% after milling for 80 h. The chemisorbed hydrogen seems to occupy two different types of the atomic sites, which has been clarified by the neutron
diffraction experiments55) and H1 NMR measurements.54)
One is the C-D(H) covalent bonding site located at the edges of the graphite sheets and the other is the defective sites
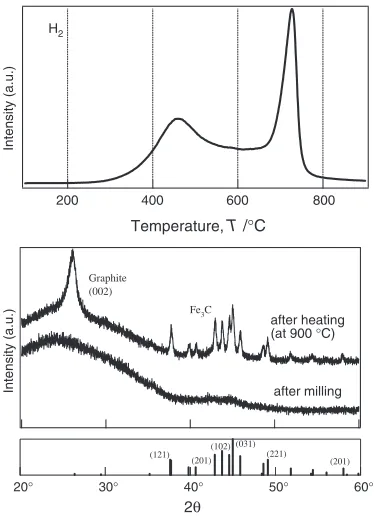
located in between the graphite layers.55) The two H
2
-desorption peaks are observed at 450 and 720C in the TDMS
profile as shown in Fig. 9; the former is due to the desorbed hydrogen from the defective sites, and the later is from the covalent bonding sites. The XRD profiles from the ball
milled graphite before and after heating up to 900C are
shown in Fig. 9. We notice that nano-structured graphite is
formed by ball milling for 80 h under H2 gas atmosphere of
1 MPa (confirmed by neutron diffraction studies), while the
(002) peak grows up after heating up to 900C, indicating
recovery of a long-range crystallization of graphite interlayer
along the c-axis, and the peaks indexed by Fe3C grow up after
heating up to 900C, indicating12at% of Fe contamination
from the Cr steel pot and balls after milling for 80 h.
3.1 Catalytic effect of 3d-transition metals on hydrogen storage properties
To clarify whether the contaminated iron acts as a catalyst for H-storage in ball milled graphite, we studied the doping
effects of 3d-transition metals on H-storage properties.65,66)
Nano-particle metals Fe, Co, Ni and Cu were used as dopants in this work. In Fig. 10, the TDMS profiles of some graphite
catalyzed by Fenano, Conano, Ninano and Cunano are shown
together with the XRD profiles before and after heating at
900C, where the these samples were prepared by ball
milling the mixture of graphite and a small amount (1 at%) of Fe, Co, Ni and Cu with several ten nanometer sizes for 32 h
under a H2gas pressure of 1 MPa, respectively, using Cr steel
pot and balls. It is to be noted that 32 h milling led to very few Fe contamination from the Cr steel pot and balls. The sample
E in Fig. 10 was prepared by mechanical milling with ZrO2
balls in ZrO2 pot, in which graphite is hardly contaminated
with iron.
As is evident from Fig. 10, the Fe-doped sample revealed the most superior H-storage properties among all the doped samples: The TDMS profile indicates that the desorption has
two peaks around 450 and 720C, the onset for hydrogen
release is 330C, and the amount of desorbed hydrogen
reaches up to4mass% for 32 h milling. It is to be noted that
the TDMS profile is similar to that obtained in the Fe contaminated graphite during milling for 80 h (Fig. 8). On the other hand, the TDMS profile of the Co-doped graphite shows that the absorbed hydrogen concentration reaches up
to 2mass% by mechanical milling for 32 h, and the
Intensity (a.u.)
800 600
400 200
H2
Intensity (a.u.) after milling after heating (at 900 °C)
Graphite (002)
Fe3C
60° 50°
40° 30°
20°
(121)
(031) (102)
(201) (221) (201)
Temperature, T /°C
2θ
Fig. 9 TDS profiles of nanostructural graphite prepared by mechanically milling in Cr steel pot and balls without any extra catalysts under hydrogen atmosphere for 80 h and XRD (after milling and after heating) profiles of corresponding nanostructural graphite before and after heat treatment up to 900C, and the indexations are given for Fe
3C.
Intensity (a.u.)
800 600 400 200
Intensity (a.u.)
80° 60° 40° 20°
B. Graphite + Co. A. Graphite + Fe
C. Graphite + Nii
E. Graphite (ZrO. 2 pot and balls)
D. Graphite + Cu H2
CH3
CH4
C2H4
after milling
after heating (at 900 °C)
2θ
[image:7.595.310.543.72.379.2]Temperature, T /°C
[image:7.595.75.262.469.727.2]desorption takes only a broad peak around 820C, but the
onset lowers down to 230C. The TDMS profiles of Ni and
Cu doped graphite are no peak structure, being similar to that of no Fe doping graphite (sample E). This indicates that the Ni and Cu doping do not show any improvement for H-storage. These results suggest that the catalytic effect of iron on H-storage properties correlates with the strongest affinity of iron with carbon (graphite) among the other 3d-transition metals.
Despite of the same milling time (32 h), the XRD profiles shows different features dependent on the doped samples as shown in the right hand side of Fig. 10. The (002) diffraction peak of hexagonal graphite corresponding to graphitic lamellar structure disappears in the Fe-doped graphite after milling for 32 h similar to the case in the Fe contaminated graphite, while the (002) peak remains even after milling in the other Co, Ni, Cu-doping and no doping graphite. This indicates that Fe contamination during milling brings a lot of defective sites between the graphene sheets and covalent bonding sites, leading to structure-less (nano-structured) broad profile in the XRD pattern, where a large amount of hydrogen is adsorbed.
From the above results, we conclude that nano-particle iron uniformly dispersed on graphite (confirmed by TEM observation) acts as the most superior catalyst for H-storage,
where hydrogen is absorbed up to7mass% for 80 h milling
under a H2atmosphere of 1 MPa and the H2desorption forms
a characteristic two-peak structure around 450 and 720C.
However, the desorption temperature of chemisorbed hydro-gen in nano-structured graphite is still too high for H-storage. Therefore, some break-through is necessary for developing graphite as one of the carbon based H-storage materials.
3.2 Milling H2-gas pressure effect on hydrogen storage properties
In the above experiment, we noticed that the inner pressure of hydrogen gas in milling pot lowered down to 0.05 MPa from 1 MPa after milling for 80 h in the closed system because of the hydrogen adsorption in graphite. Then, we studied H-storage properties of mechanically milled graphite under some hydrogen pressures up to 6 MPa in order to know whether the intrinsic H-storage properties of graphite are improved or not by increasing the milling hydrogen pressure
up to 6 MPa.66,67)
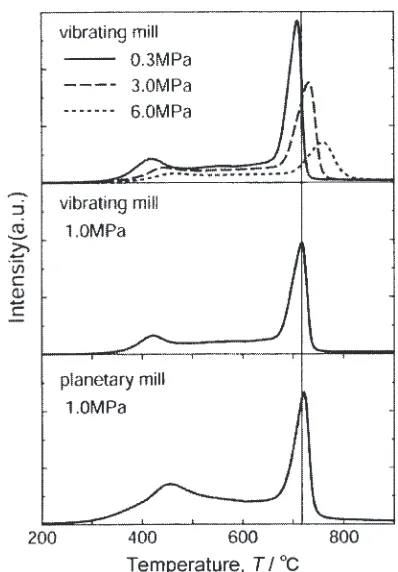
In Fig. 11, the TDMS profiles of hydrogen are shown for mechanically milled graphite at a frequency of 10 Hz for 80 h
under various H2-gas pressures by a vibrating ball mill
equipment, together with that for graphite milled at 400 rpm
for 80 h under a H2-gas pressure of 1 MPa by a planetary ball
mill method as well. We can see a common two-peak structure in all kinds of the Fe contaminated graphite. As already described above, the low temperature peak is assigned to the desorption of hydrogen trapped at some defective sites, while the high-temperature one to that of those trapped at the edges of grapheme sheets. As is evident from Fig. 11, the intensity of low temperature peak for nano-structured graphite milled by a vibrating mill method is weaker than that milled by a planetary mill one. On the other hand, the high temperature peak due to hydrogen desorption unexpectedly shifts to higher temperature side with
increas-ing the millincreas-ing pressure. However, at the same initial pressure, the position of high temperature peak due to the rotating mill process is almost the same as in the vibrating process, irrespective of the milling type. The structural properties were examined by the XRD measurements. Figure 12 shows the XRD profiles of graphite milled for 2 h under various hydrogen gas pressures. The intensity of the main (002) peak increases with increasing the milling pressure, indicating that it is hard to make the defects in graphite by milling under higher hydrogen pressure. Actual-ly, we obtained the result that the hydrogen absorption capacity determined by the oxygen combustion hydrogen analysis (OCHA) decreased with increasing the milling pressure. Those unusual results indicate that higher milling pressure of hydrogen leads to further decrease in the chemisorbed hydrogen content and further stability on the occupied sites, which are strongly related with the number of defective sites in the nano-structured graphite.
[image:8.595.326.525.68.354.2]hydrogen capacity in high-pressure milled graphite. As is
seen in the Table 1, we notice that the difference i.e.,
physisorbed hydrogen concentration, increases with increas-ing the millincreas-ing pressure. To clarify how much hydrogen is absorbed in graphite during milling under high pressures of hydrogen gas, the following experiments were performed. (i) Hydrogen gas of 6 MPa was exactly filled in the milling pot
with graphite before and after milling and kept at 25:0
0:1C. (ii) Then, the valve connecting the milling pot and the
reservoir cell was closed, and only the reservoir was degassed
below3104Pa. (iii) Finally, after the valve was opened,
the equilibrium pressures in the system were determined for
graphite milled under H2-gas pressures of 0.3, 1.0, 3.0 and
6.0 MPa. The results obtained are given in Table 2. Here, the physisorption-like hydrogen capacity was evaluated from the difference between the equilibrium pressures before and after
milling under various H2 gas pressures. We notice that a
considerable physisorbed hydrogen of 0:51:0mass% is
only observed in graphite after milling under higher pressures
than 3 MPa of H2-gas.
From the above results, we conclude that the amount of chemisorbed hydrogen decreased with increasing the milling pressure, while physisorption-like hydrogen appeared the milling pressure above 3 MPa, the amount of which increased with increasing the milling pressure. On the other hand, the higher milling pressure gave suppression of the fracture rate of graphite structure more effectively, suggesting that the hydrogen atoms trapped at the edges of the graphene sheets and between the graphene sheets near the surface are responsible for preserving the lamellar structure of nano-meter scale, which may be the host for H-storage on
physisorption.66,67)
4. Hydrogen Storage Properties of Magnesium Based Materials
Magnesium hydride (MgH2) is one of the attractive
H-storage materials because it is directly formed from the reaction of bulk Mg with gaseous hydrogen and reaches up to high hydrogen capacity (7.6 mass%). However, the reaction is too slow for practical use and needs higher temperature
than 300C for progressing the HD reaction.68–70)
Recently, the nano-structured Mg or MgH2 prepared by a
mechanical milling method has been studied to improve the reaction kinetics without reducing its high hydrogen capaci-ty.71–73) Furthermore, the H-storage properties of some
catalyzed Mg or MgH2 by a small amount of transition
metals Ti, V, Mn, Fe, Co, Ni, Cu and Pd or transition metal
oxides has been studied so far.73–83)Lianget al.have reported
some good H-storage properties of ball milled MgH2 with
5 at% transition metals (Ti, V, Mn, Fe and Ni).74–78)Zaluska
et al. have studied H-storage properties of Mg composites prepared by ball milling with 1 mass% transition metals (Pd
and Fe), in which 5mass% of hydrogen was absorbed at
300C within ten minutes under a H
2-gas pressure of
1 MPa.73) They observed that the catalyst was uniformly
distributed on the magnesium surface in the form of nano-particles. This indicates that when very small (of the size of several tens nanometers) particles of the catalyst is uniformly distributed on the metal surface, a small amount of catalysts is sufficient for improving the reaction kinetics. Recently,
Kanoyaet al.have investigated H-storage properties of some
ball milled Mg with a small amount of nano-sized metals
(Ni and Fe) as a catalyst.79)Their results indicated that
[image:9.595.76.265.68.361.2]Mg-Fig. 12 XRD profiles of the nanostructural graphite milled for 2 h by vibrating type mill equipment under various hydrogen pressure atmo-sphere.
Table 1 List of estimated H2 concentration on each H2 pressure by volumetric and OCHA methods.
H2 H2Concentration H2Concentration Pressure (volumetric method) (OCHA method)
6.0 MPa 6.1 mass% 6.1 mass%
3.0 MPa 5.9 mass% 5.7 mass%
1.0 MPa 5.7 mass% 4.5 mass%
[image:9.595.303.550.104.243.2]0.3 MPa 5.1 mass% 4.1 mass%
Table 2 List of pressure value, the gas kind during milling process by vibrating mill, equilibrium hydrogen pressure and estimated unstable H2 concentration.
Pressure Atmospheric Equilibrium Concentration Gas H2pressure (unstable H2)
Milling sample (after milling for 80 h)
6.0 MPa H2 0.882 MPa >0:5mass%
6.0 MPa Ar 0.870 MPa 0.0 mass%
3.0 MPa H2 0.882 MPa 0:5mass%
1.0 MPa H2 0.868 MPa 0.0 mass%
0.3 MPa H2 0.868 MPa 0.0 mass%
Host (before milling)
[image:9.595.46.290.443.526.2]0.33Ni-0.17Fe (at.%) absorbed 7.49 mass% of hydrogen at
300C by ball milling for only 15 min. Oelerichet al. have
reported some good catalytic effect of the transition metal
oxide for MgH2.80–83) The composites prepared by ball
milling for 100 h with 0.2 mol% Nb2O5absorbed 7 mass% of
hydrogen within 60 s and desorbed within 130 s at 300C.83)
In our group, it has been reported that Pd-coated nano-structured Mg films prepared by a RF sputtering method
absorb 5mass% at 100C under hydrogen atmosphere of
0.1 MPa and completely desorb below 100C in vacuum.
This confirms that MgH2is applicable for practical use if we
can modify bulk MgH2 into suitable nano-structure.84,85)
Prior to the studies of catalytic effect on H-storage properties
of MgH2, we examined the correlation between H-storage
properties and structural characteristics in mechanically
milled magnesium hydride MgH2 itself.86) The results
indicated that at the early stage within 2 h milling, the
amount of desorbed hydrogen decreases 16% from 7.3 to
6.1 mass% and the onset temperature of dehydrogenation
decreases by 70C from 400C, while both the powder size
and the crystallite size in powder decrease with increasing the
milling time down to 1mmand 15 nm, respectively, and the
lattice strain of 0.3% is rapidly introduced as well.
At the next step of systematic studies of improving H-storage properties in Mg systems, we studied the catalytic effect of 3d-transition metals Fe, Co, Ni, and Cu and oxide
Nb2O5 on H-storage in MgH2 without exposing to air the
products in all the preparing and measuring processes.
4.1 Catalytic effect of 3d-transition metals on H2-storage properties in milled MgH2
We examined the doping effect of nanometer-sized 3d-transition metals, Fe, Co, Ni, and Cu on H-storage properties
in MgH2prepared by mechanically milling method.
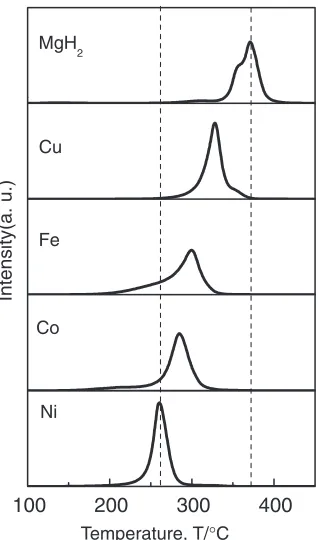
Figure 13 shows the TDMS profiles of the H2gas for pure
MgH2and some catalyzed MgH2with 1 mol% Fe, Co, Ni and
Cu nanoparticle metals prepared by ball milling for 2 h under
a H2 gas atmosphere of 1 MPa. We can see that all the
composites with nanoparticle metals as catalyst exhibit better
HD properties than the pure milled MgH2: The HD
temper-ature is lowered and a larger amount of hydrogen
(7mass%) are desorbed by introducing a small amount
(1 mol%) of catalysts. It should be noted that all the catalyzed
MgH2indicated a larger desorbed hydrogen capacity than
no-catalyzed MgH2. This may be due to release of excess
hydrogen absorbed during milling MgH2with catalysts under
H2-gas atmosphere. The Ni-doped composite shows the best
HD properties among all the catalyzed MgH2composites and
the peak temperature (260C) is about 100C lower than that
of the pure milled MgH2. In addition, it seems likely that
these HD properties depend on the states of 3d-electorns because the peak temperature of hydrogen desorption decreases with increasing a number of occupied 3d-electrons on those transition metals except for Cu, which is known as one of non-catalytic materials from the fact that the
3d-electron shell of Cu metal is fully occupied.87)
Next, we examined how the HD properties in the Ni-doped system are improved by changing the milling time, the milling revolution speed and the amount of Ni catalyst to optimize the milling conditions for H-storage.
(1) At the first step, we changed the milling time from 15 min
to 2 h at 400 rpm for 1 mol% Ni-doped MgH2composite, and
examined the TDMS profiles. The results are shown in Fig. 14. We notice that the composite milled for 15 min leads
to the onset temperature of HD reaction about at150C and
the decrease in the peak temperature to 210 from 260C. So,
we conclude that the shorter of the milling time brings the better HD properties. However, the HD spectra composed of two broad peaks and distribute in wide temperature range of
150300C.
(2) At the second step, we changed the milling revolution speed from 400 rpm to 200 rpm under the short milling time of 15 min, and performed the TDMS measurements. In Figs. 15(a) and (b), the TDMS profiles are shown for the
1 mol% Ni-doped MgH2 composite milled at 400 rpm and
200 rpm, respectively. You can see that the profile of the composite milled at 200 rpm consists in a single HD peak, but
the temperature range is still wide from 150 to 300C.
(3) Finally, we changed the amount of Ni nanoparticle catalyst from 1 mol% to 2 mol% under the same conditions of the short milling time for 15 min and the slow milling revolution speed at 200 rpm, and we performed the TDMS
measurements. As is shown in Fig. 15(c), the MgH2
composite with 2 mol% Ni shows the most superior HD profile in the TDMS curves in all the composites examined in this work.
Thus, we found that the 2 mol% Ni-doped MgH2prepared
by ball milling under the short milling time for 15 min and slow milling revolution speed at 200 rpm desorbs a large
amount of hydrogen (6:5mass%) in the temperature from
150 to 250C at the heating rate of 5C/min. From these
results, we conclude that the short milling time and slow
100 200 300 400
Ni Cu
Temperature, T/°C
Intensity(a. u.)
MgH 2
[image:10.595.349.508.70.340.2]Co Fe
milling revolution speed brings the better HD properties for
the MgH2+ 2 mol% Ni composite. To clarify the reason why
the HD properties for MgH2 are so improved by a small
amount of Ni catalyst, we examined the observation of
[image:11.595.317.534.73.221.2]morphology of the 2 mol% Ni-doped MgH2 composite. In
Fig. 16, the EDX micrographs corresponding to the Mg and
Ni element distribution are shown for MgH2 + 2 mol% Ni
composite milled for 15 min at 200 rpm. We can see that the nanoparticle Ni uniformly disperses on the surface of the
MgH2 particles by ball milling for such a short time and
under such a slow milling revolution speed. When the micron
meter sized Ni was used as a catalyst in MgH2in the milling
process, we could not find out such superior H-storage properties.
Next, we examined the reversible properties of hydriding/
dehydriding reactions for the sample of MgH2 + 2 mol%Ni
prepared by milling for 15 min at 200 rpm under H2 gas
atmosphere of 1 MPa. The reversibility was tested by the following cyclic processes: the dehydrogenation was
per-formed by holding the sample at 150C (corresponding to the
onset temperature for dehydrogenation) and at 200C
(corresponding to the peak temperature for dehydrogenation) for 12 h under high vacuum, and then the hydrogenation was performed under pure hydrogen gas up to 3 MPa at 150 and
200C for 12 h, respectively. After completing those
hydro-gen absorbing/desorbing cycles, we examined the HD properties by the TGA and TDMS measurement. The results obtained are shown in Fig. 17. The dehydrogenation
proper-ties after 2nd cycle at 150C is better than that after 2nd cycle
at 200C, but is slightly worse than that after 1st cycle after
100 200 300 400
Intensity (a. u.)
Temperature,
T
/
°
C
15min 1h MgH
[image:11.595.87.252.73.294.2]2+1mol%Ni 2h
Fig. 14 TDMS profiles of hydrogen from the MgH2composite catalyzed by 1 mol% Ni in the milling conditions for 15 min, 1 h, and 2 h at 200 rpm under a H2gas atmosphere of 1 MPa.
100
200
300
400
(c) 200rpm +2mol%Ni
Intensity (a. u.)
Temperature,
T
/
°
C
(b) 200rpm +1mol%Ni
15min (a) 400rpm
[image:11.595.87.254.360.582.2]+1mol%Ni
Fig. 15 TDMS profiles of hydrogen for the products milled MgH2 for 15 min (a) at 400 rpm with 1 mol% Ni, (b) at 200 rpm with 1 mol% Ni, and (c) at 200 rpm with 2 mol% Ni, respectively.
[image:11.595.325.524.502.727.2]150 m
µ
Fig. 16 EDX micrographs of (a) Mg and (b) Ni elements in the catalyzed MgH2composite by 2 mol% Ni prepared by milling for 15 min at 200 rpm.
50 100 150 200 250 300 350 400
−6 −4 −2 0
Weight loss(mass%)
Temperature,
T
/°CIntensity (a. u.)
2nd cycle
at 200°C
2nd cycle
at 150°C
after milling
milling. As is seen in Fig. 18, the X-ray diffraction profiles indicate that both of the products after milling and after its
dehydrogenating at 150C have a small peak corresponding
to only Ni-metal phase in addition to the main peaks for
MgH2. But, in the sample after dehydriding at 200C, there
are the peaks corresponding to not only metal Ni-metal phase
but also Mg2Ni phase. Since the catalytic effect of Mg2Ni is
weaker than Ni-metal for improving the H-storage properties,
the formation of Mg2Ni in the MgH2+Ni composite would
lead to the worse H-storage properties. This is also the reason why the short milling time and slow milling revolution speed
brings the better HD properties for the MgH2+2 mol%Ni
composite. Because the milling for a long time at high
revolution speed easily leads to the Mg2Ni phase at the phase
boundaries between the nanoparticle Ni and main Mg phases due to the strong affinity between Mg and Ni atoms.
4.2 Catalytic effect of metal oxide Nb2O5 on hydrogen storage properties
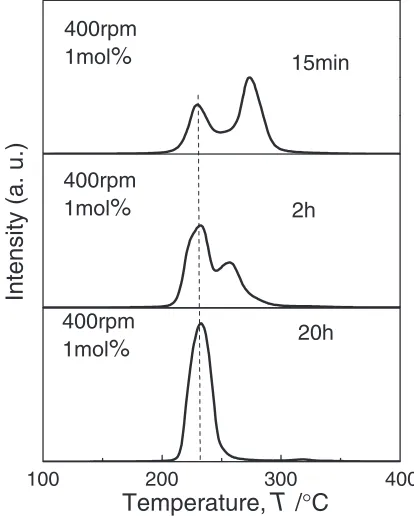
Figure 19 shows the TDMS profiles of H2 for the MgH2
composite with 1 mol% Nb2O5 prepared by ball milling for
15 min, 2 h, and 20 h at 400 rpm under a H2gas atmosphere of
1 MPa. The composite milled for 15 min has two HD peaks
around 230C and 270C, which are much lower than that for
pure MgH2 milled for 15 min (370C). This indicates that
Nb2O5 is one of the good catalysts for improving the HD
properties in MgH2. To optimize the milling condition for
improving the HD properties, we increased the milling time
up to 20 h from 15 min for the Nb2O5-doped composite. After
2 h milling, the HD peak at high temperature becomes much weaker as is shown in Fig. 19. Furthermore, the milling for
20 h leads to single HD peak around 230C, possessing a
large amount of hydrogen (6:0mass%). This result
in-dicates that the HD properties of the Nb2O5-doped composite
are much improved with increasing the milling time in contrast to the case of the Ni-catalyzed composite.
As is evident from Fig. 20(a), the composite of MgH2and
1 mol% Nb2O5 milled for 20 h shows the existence of
-MgH2and a small amount of MgO in the XRD profiles, but
there is no trace corresponding to the niobium oxide Nb2O5.
This indicates that Nb2O5 disperses on the surface of MgH2
in the nanometer scale by ball milling and acts as a good
catalyst. The XRD profile after heat treatment up to 450C in
Fig. 20(b) indicates the existence of Mg and MgO. In details, the intensity corresponding to the MgO peak is larger than
that in pure MgH2milled for 20 h in Fig. 20(c). Therefore, it
seems likely that Nb2O5 dispersed in nanometer scale is
reduced by Mg to form metal Nb and MgO during ball milling or heat treatment as follows
20° 40° 60°
dehydrogenation at 200°C
Intensity(a. u.)
2θ
after milling
dehydrogenation at 150°C
[image:12.595.65.273.70.231.2]Ni Mg2Ni
Fig. 18 X-ray diffraction profiles for the 2 mol%Ni-catalyzed MgH2 composite prepared after milling for 15 min at 200 rpm, the product after dehydrogenation at 150C and the sample after dehydrogenation at 200C.
100 200 300 400
400rpm
1mol
%
20h
Intensity (a. u.)
Temperature,
T
/
°
C
400rpm
1mol
%
2h
15min
400rpm
[image:12.595.322.529.73.331.2]1mol
%
Fig. 19 TDMS profiles of hydrogen from the MgH2 composite with 1 mol% Nb2O5prepared by milling for 15 min, 2 h, and 20 h at 400 rpm under a H2gas atmosphere of 1 MPa.
30° 40° 50° 60°
(c)
2
θ
Intensity(a. u.)
(b)
Mg β−MgH2
MgO
[image:12.595.331.519.392.622.2](a)
Fig. 20 X-ray diffraction profiles for (a) the 1 mol% Nb2O5-catalyzed MgH2composite prepared by milling for 20 h, (b) the composite after heat treatment up to 450C, (c) the pure MgH
1
2Nb2O5þ
5
2Mg!Nbþ
5
2MgO
H¼ 554:5kJ/mol Nb:
Since the standard enthalpy change of this reaction is nega-tive and large, this reduction reaction should be possible to proceed during ball milling or heat treatment. Consequently, the metallic Nb dispersed in nanometer scale could act as an
excellent catalyst on hydrogen desorption from MgH2.
Next, we examined the reversible properties of hydriding/
dehydriding reactions at 200C for the composite of MgH
2
and 1 mol%Nb2O5 milled for 20 h according to the same
cyclic processes as the MgH2 composite with Ni
nano-particle. As is shown in Fig. 21, the dehydrogenation
property after 2nd cycle at 200C is better than that after
1st cycle. This suggests that Nb2O5is reduced by Mg to form
metallic Nb during dehydriding/hydriding cycle at 200C,
leading to the hydrogen desorption of 6mass% in the
temperature range from 150 to 250C. This result indicates
that Nb is the best catalyst we have studied so far. Thus, it seems that some magnesium composites catalyzed by 3d-transition metals nano-particles is acceptable for practical
application as a H2tank for off-board H-storage.
5. Prospective
In this paper, we have presented our recent results of H-storage properties on lithium, graphite and magnesium based materials prepared by some mechanical milling methods. There were some progress on basic materials properties in lithium-N-H and catalyzed magnesium nano-composite systems for H-storage.
Especially, the kinetic properties of the H-storage reac-tions in Mg metal were significantly improved by doping a small amount of Ni metals with several ten nanometers in diameter or Nb oxides, reaching a level of practical use as a H-storage tank for off-board storage.
In some Li-N-H systems, we found that a large amount of hydrogen (more than 6 mass%) were reversibly stored in the
temperature range from 140 to 200C, the temperature of
which is still higher than the target of NEDO project or COE
target. However, recent quick developments make imagine us that the NEDO target will be cleared in near future in lithium based systems.
On the contrary, we found that the ball milled graphite could make a large amount of hydrogen (more than 7 mass%) absorbed. However, not only the desorption temperature was not only still too high for H-storage, but also the H-storage reaction was not reversible. Many efforts have been paid on improving H-storage properties in nano-structured graphite prepared by ball milling under hydrogen gas atmosphere, but the properties were still too far from the NEDO target. Therefore, in graphite system, some break-through is necessary to clear the NEDO target. Before proceeding further improving studies, it is important to know whether there is a new, hitherto unknown interaction between carbon and hydrogen whose interaction energy falls between physisorption and chemisorption or not. We believe that the basic studies such as neutron scattering experiments should give us an answer to above question whereby we can solve the carbon controversy concerning how much hydrogen is stored in carbon single wall nano-tube.
As we have mentioned above, currently, in the hydrogen research laboratories all over the world, new approach using non-traditional and nano-technological techniques have been applied to design high-performance H-storage materials. Thus, we believe that, due to this kind of research works, better H-storage materials which absorb and desorb at least
6 mass% hydrogen at temperatures lower than 150C, will be
discovered and developed for practical use on board hydro-gen tank in near future.
Acknowledgements
This work was supported by the NEDO project ‘‘Develop-ment for Safe Utilization and Infrastructure of Hydrogen Industrial Technology’’ in Japan and the Grant-in-Aid for COE Research (No. 13CE2002) of the Ministry of Education, Culture, Sports, Sciences and Technology of Japan. The authors gratefully acknowledge Miss E. Gomibuchi, Mr. K. Nabeta, Mr. K. Kimura, Mr. S. Hino and Mr. T. Nakagawa for their help in our laboratory.
REFERENCES
1) G. Sandrock: J. Alloy. Compd.293–295(1999) 877–888. 2) E. Akiba: Curr. Opin. Solid. St. M.4(1999) 267–272. 3) L. Schlapbach and A. Zu¨ttel: Nature414(2001) 353–358.
4) P. Vajeeston, P. Ravindran, R. Vidya, H. Fjellvaag and A. Kjekshus: Appl. Phys. Lett.82(2003) 2257–2259.
5) W. Grochala and P. P. Edwards: Chem. Rev.104(2004) 1283–1315. 6) B. Bogdanovic´ and M. Schwickardi: J. Alloy. Compd.253(1997) 1–9. 7) J. Huot, S. Boily, V. Guther and R. Schulz: J. Alloy. Compd.283
(1999) 304–306.
8) R. A. Zidan, S. Takara, A. G. Hee and C. M. Jensen: J. Alloy. Compd. 285(1999) 119–122.
9) L. Zaluski, A. Zalsuka and J. O. Stro¨m-Olsen: J. Alloy. Compd.290 (1999) 71–78.
10) A. Zaluska, L. Zaluski and J. O. Stro¨m-Olsen: J. Alloy. Compd.298 (2000) 125–134.
11) B. Bogdanovic´, R. A. Brand, A. Marjanovic´, M. Schwickardi and J. To¨lle: J. Alloy. Compd.302(2000) 36–58.
12) J. Chen, N. Kuriyama, Q. Xu, H. T. Takeshita and T. Sakai: J. Phys. Chem. B105(2001) 11214–11220.
100 200 300 400
Temperature, T /°C
Intensity(a. u.)
1st cycle
[image:13.595.65.272.585.745.2]2nd cycle
13) C. M. Jensen and K. J. Gross: Appl. Phys. A72(2001) 213–219. 14) K. J. Gross, G. J. Thomas and C. M. Jensen: J. Alloy. Compd.330–332
(2002) 683–690.
15) G. Sandrock, K. Gross, G. Thomas, C. Jensen, D. Meeker and S. Takara: J. Alloy. Compd.330–332(2002) 696–701.
16) G. P. Meisner, G. G. Tibbetts, F. E. Pinkerton, C. H. Olk and M. P. Balogh: J. Alloy. Compd.337(2002) 254–263.
17) G. J. Thomas, K. J. Gross, N. Y. C. Yang and C. Jensen: J. Alloy. Compd.330–332(2002) 702–707.
18) G. Sandrock, K. Gross and G. Thomas: J. Alloy. Compd.339(2002) 299–308.
19) M. Fichtner and O. Fuhr: J. Alloy. Compd.345(2002) 286–296. 20) B. Bogdanovic, M. Felderhoff, M. Germann, M. Hartel, A. Pommerin,
F. Schuth, C. Weidenthaler and B. Zibrowius: J. Alloy. Compd.350 (2003) 246–255.
21) H. Morioka, K. Kakizaki, S. C. Chung and A. Yamada: J. Alloy. Compd.353(2003) 310–314.
22) D. L. Anton: J. Alloy. Compd.356–357(2003) 400–404.
23) M. Fichtner, O. Fuhr and O. Kircher: J. Alloy. Compd.356–357(2003) 418–422.
24) K. J. Gross, E. H. Majzoub and S. W. Spangler: J. Alloy. Compd.356– 357(2003) 423–428.
25) S. M. Opalka and D. L. Anton: J. Alloy. Compd.356–357(2003) 486– 489.
26) P. Vajeeston, P. Ravindran, R. Vidya, H. Fjellvag and A. Kjekshus: Appl. Phys. Lett.82(2003) 2257–2259.
27) D. Sun, S. S. Srinivasan, T. Kiyobayashi, N. Kuriyama and C. M. Jensen: J. Phys. Chem. B107(2003) 10176–10179.
28) T. Kiyobayashi, S. S. Srinivasan, D. Sun and C. M. Jensen: J. Phys. Chem. A107(2003) 7671–7674.
29) M. E. Arroyo y de Dompablo and G. Ceder: J. Alloy. Compd.364 (2004) 6–12.
30) J. M. Bellosta von Colbe, B. Bogdanovic´, M. Felderhoff, A. Pommerin and F. Schuth: J. Alloy. Compd.370(2004) 104–109.
31) S. C. Chung and H. Morioka: J. Alloy. Compd.372(2004) 92–96. 32) D. Sun, S. S. Srinivasan, G. Chen and C. M. Jensen: J. Alloy. Compd.
373(2004) 265–269.
33) J. Graetz, J. J. Reilly, J. Johnson, A. Yu. Ignatov and T. A. Tyson: Appl. Phys. Lett.85(2004) 500–502.
34) O. Kircher and M. Fichtner: J. Appl. Phys.95(2004) 7748–7753. 35) H. J. Schlesinger and H. C. Brown: J. Am. Chem. Soc.62(1940) 3429–
3435.
36) S. Orimo, Y. Nakamori and A. Zu¨ttel: Mater. Sci. Eng. B108(2004) 51–53.
37) E. M. Fedneva, V. L. Alpatova and V. I. Mikheeva: Russ. J. Inorg. Chem.9(1964) 826–827.
38) A. Zu¨ttel, S. Rentsch, P. Fischer, P. Wenger, P. Sudan, Ph. Mauron and Ch. Emmenegger: J. Alloy. Compd.356–357(2003) 515–520. 39) F. W. Dafert and R. Miklauz: Monatsh Chem.31(1910) 981–996. 40) O. Ruff and H. Goeres: Chem. Ber.44(1910) 502–506.
41) P. Chen, Z. Xiong, J. Luo, J. Lin and K. L. Tan: Nature420(2002) 302– 304.
42) Y. H. Hu and E. Ruckenstein: Ind. Eng. Chem. Res.42(2003) 5135– 5139.
43) Z. Xiong, P. Chen, G. Wu, J. Lin and K. L. Tan: J. Mater. Chem.13 (2003) 1676–1680.
44) Y. Nakamori and S. Orimo: J. Alloy. Compd.370(2004) 271–275. 45) Y. Nakamori and S. Orimo: Mater. Sci. Eng. B108(2004) 48–50. 46) T. Ichikawa, S. Isobe, N. Hanada and H. Fujii: J. Alloy. Compd.365
(2004) 271–276.
47) T. Ichikawa, N. Hanada, S. Isobe, H. Y. Leng and H. Fujii: J. Phys. Chem. B108(2004) 7887–7892.
48) H. Y. Leng, T. Ichikawa, S. Hino, N. Hanada, S. Isobe and H. Fujii: J. Phys. Chem. B108(2004) 8763–8765.
49) Y. Nakamori, G. Kitahara, S. Orimo, K. Miwa and S. Towata: 2003 Autumn Meeting of The Japan Institute of Metals, oral presentation. 50) A. C. Dillon, K. M. Jones, T. A. Bekkedahl, C. H. Kiang, D. S. Bethune
and M. J. Heben: Nature386(1997) 377–379.
51) A. Chambers, C. Park, R. T. K. Baker and N. M. Rodriguez: J. Phys. Chem. B102(1998) 4253–4256.
52) S. Orimo, G. Majer, T. Fukunaga, A. Zu¨ttel, L. Schlapbach and
H. Fujii: Appl. Phys. Lett.75(1999) 3093–3095.
53) S. Orimo, T. Matsushima, H. Fujii, T. Fukunaga and G. Majer: J. Appl. Phys.90(2001) 1545–1549.
54) G. Majer, E. Stanik and S. Orimo: J. Alloy. Compd.356–357(2003) 617–621.
55) T. Fukunaga, K. Itoh, S. Orimo, M. Aoki and H. Fujii: J. Alloy. Compd. 327(2001) 224–229.
56) S. Orimo, A. Zu¨ttel, L. Schlapbach, G. Majer, T. Fukunaga and H. Fujii: J. Alloy. Compd.356–357(2003) 716–719.
57) Y. Ye, C. C. Ahn, C. Witham, B. Fultz, J. Liu, A. G. Rinzler, D. Colbert, K. A. Smith and R. E. Smalley: Appl. Phys. Lett.74(1999) 2307.
58) C. Park, P. E. Anderson, A. Chambers, C. D. Tan, R. Hidalgo and N. M. Rodriguez: J. Phys. Chem. B103(1999) 10572–10581.
59) C. C. Ahn, Y. Ye, B. V. Ratnakumar, C. Witham, R. C. Bowman, Jr. and B. Fultz: Appl. Phys. Lett.73(1998) 3378–3380.
60) L. Schlapbach, A. Zu¨ttel, P. Gro¨ning, O. Gro¨ning and P. Aebi: Appl. Phys. A72(2001) 245–253.
61) V. Meregalli and M. Parrinello: Appl. Phys. A72(2001) 143–146. 62) A. Zu¨ttel, Ch. Nu¨tzenadel, P. Sudan, Ph. Mauron, Ch. Emmenegger,
S. Rentsch, L. Schlapbach, A. Weidenkaff and T. Kiyobayashi: J. Alloy. Compd.330–332(2002) 676–682.
63) C. Carpetis and W. Peschka: Int. J. Hydrogen Energy5(1980) 539– 554.
64) K. A. G. Amankwah, J. S. Noh and J. A. Schwarz: Int. J. Hydrogen Energy14(1989) 437–447.
65) S. Isobe, T. Ichikawa, J. I. Gottwald, E. Gomibuchi and H. Fujii: J. Phys. Chem. Solids65(2004) 535–539.
66) T. Ichikawa, D. M. Chen, S. Isobe, E. Gomibuchi and H. Fujii: Mater. Sci. Eng. B108(2004) 138–142.
67) D. M. Chen, T. Ichikawa, H. Fujii, N. Ogita, M. Udagawa, Y. Kitano and E. Tanabe: J. Alloy. Compd.354(2003) L5–L9.
68) D. L. Cummings and G. J. Powers: Ind. Eng. Chem.13(1974) 182–192. 69) J. F. Stampfer, Jr., C. E. Holley, Jr. and J. F. Suttle: J. Am. Chem. Soc.
82(1960) 3504–3508.
70) B. Vigeholm, J. Kjoller and B. Larsen: J. Less-Common Met.74(1980) 341–350.
71) J. Huot, G. Liang, S. Boily, A. Van Neste and R. Schulz: J. Alloy. Compd.293–295(1999) 495–500.
72) F. C. Gennari, F. J. Castro and G. Urretavizcaya: J. Alloy. Compd.321 (2001) 46–53.
73) A. Zaluska, L. Zaluski and J. O. Stro¨m-Olsen: J. Alloy. Compd.288 (1999) 217–225.
74) G. Liang, J. Huot, S. Boily, A. Van Neste and R. Schulz: J. Alloy. Compd.291(1999) 295–299.
75) G. Liang, J. Huot, S. Boily, A. Van Neste and R. Schulz: J. Alloy. Compd.292(1999) 247–252.
76) G. Liang, J. Huot, S. Boily and R. Schulz: J. Alloy. Compd.305(2000) 239–245.
77) Z. Dehouche, R. Djaozandry, J. Huot, S. Boily, J. Goyette, T. K. Bose and R. Schulz: J. Alloy. Compd.305(2000) 264–271.
78) J. Huot, J. F. Pelletier, G. Liang, M. Sutton and R. Schulz: J. Alloy. Compd.330–332(2002) 727–731.
79) I. Kanoya, M. Hosoe and T. Suzuki: Honda R & D Technical Review 14(2002) 91.
80) W. Oelerich, T. Klassen and R. Bormann: J. Alloy. Compd.315(2001) 237–242.
81) W. Oelerich, T. Klassen and R. Bormann: Adv. Eng. Mater.3(2001) 487–490.
82) Z. Dehouche, T. Klassen, W. Oelerich, J. Goyette, T. K. Bose and R. Schulz: J. Alloy. Compd.347(2002) 319–323.
83) G. Barkhordarian, T. Klassen and R. Bormann: Scr. Mater.49(2003) 213–217.
84) K. Higuchi, K. Yamamoto, H. Kajioka, K. Toiyama, M. Honda, S. Orimo and H. Fujii: J. Alloy. Compd.330–332(2002) 526–530. 85) H. Fujii, K. Higuchi, K. Yamamoto, H. Kajioka, S. Orimo and
K. Toiyama: Mater. Trans.43(2002) 2721–2727.
86) N. Hanada, T. Ichikawa, S. Orimo and H. Fujii: J. Alloy. Compd.366 (2004) 269–273.