Distribution-Based Pruning of Backoff Language Models
Jianfeng Gao Microsoft Research China No. 49 Zhichun Road Haidian District
100080, China,
Kai-Fu Lee Microsoft Research China No. 49 Zhichun Road Haidian District
100080, China,
Abstract
We propose a distribution-based pruning of n-gram backoff language models. Instead of the conventional approach of pruning n-grams that are infrequent in training data, we prune n-grams that are likely to be infrequent in a new document. Our method is based on the n-gram distribution i.e. the probability that an n-gram occurs in a new document. Experimental results show that our method performed 7-9% (word perplexity reduction) better than conventional cutoff methods.
1
Introduction
Statistical language modelling (SLM) has been successfully applied to many domains such as speech recognition (Jelinek, 1990), information retrieval (Miller et al., 1999), and spoken language understanding (Zue, 1995). In particular, n-gram language model (LM) has been demonstrated to be highly effective for these domains. N-gram LM estimates the probability of a word given previous words, P(wn|w1,…,wn-1).
In applying an SLM, it is usually the case that more training data will improve a language model. However, as training data size increases, LM size increases, which can lead to models that are too large for practical use.
To deal with the problem, count cutoff (Jelinek, 1990) is widely used to prune language models. The cutoff method deletes from the LM those n-grams that occur infrequently in the training data. The cutoff method assumes that if an n-gram is infrequent in training data, it is also infrequent in testing data. But in the real world, training data rarely
matches testing data perfectly. Therefore, the count cutoff method is not perfect.
In this paper, we propose a distribution-based cutoff method. This approach estimates if an n-gram is “likely to be infrequent in testing data”. To determine this likelihood, we divide the training data into partitions, and use a cross-validation-like approach. Experiments show that this method performed 7-9% (word perplexity reduction) better than conventional cutoff methods.
In section 2, we discuss prior SLM research, including backoff bigram LM, perplexity, and related works on LM pruning methods. In section 3, we propose a new criterion for LM pruning based on n-gram distribution, and discuss in detail how to estimate the distribution. In section 4, we compare our method with count cutoff, and present experimental results in perplexity. Finally, we present our conclusions in section 5.
2
Backoff Bigram and Cutoff
One of the most successful forms of SLM is the n-gram LM. N-gram LM estimates the probability of a word given the n-1 previous words, P(wn|w1,…,wn-1). In practice, n is usually
set to 2 (bigram), or 3 (trigram). For simplicity, we restrict our discussion to bigram, P(wn|wn-1),
which assumes that the probability of a word depends only on the identity of the immediately preceding word. But our approach extends to any n-gram.
Perplexity is the most common metric for evaluating a bigram LM. It is defined as,
∑
= = −
− N
i
i iw
w P N
PP 1
1)
| ( log 1
where N is the length of the testing data. The perplexity can be roughly interpreted as the geometric mean of the branching factor of the document when presented to the language model. Clearly, lower perplexities are better.
One of the key issues in language modelling is the problem of data sparseness. To deal with the problem, (Katz, 1987) proposed a backoff scheme, which is widely used in bigram language modelling. Backoff scheme estimates the probability of an unseen bigram by utilizing unigram estimates. It is of the form:
>
=
−
− −
−
otherwise
w
P
w
w
w
c
w
w
P
w
w
P
i i
i i i
i d i
i
)
(
)
(
0
)
,
(
)
|
(
)
|
(
1
1 1
1
α
(2)where c(wi-1,wi) is the frequency of word pair
(wi-1,wi) in training data, Pd represents the
Good-Turing discounted estimate for seen word pairs, and α(wi-1) is a normalization
factor.
Due to the memory limitation in realistic applications, only a finite set of word pairs have conditional probabilities P(wn|wn-1) explicitly
represented in the model, especially when the model is trained on a large corpus. The remaining word pairs are assigned a probability by back-off (i.e. unigram estimates). The goal of bigram pruning is to remove uncommon explicit bigram estimates P(wn|wn-1) from the
model to reduce the number of parameters, while minimizing the performance loss.
The most common way to eliminate unused count is by means of count cutoffs (Jelinek, 1990). A cutoff is chosen, say 2, and all probabilities stored in the model with 2 or fewer counts are removed. This method assumes that there is not much difference between a bigram occurring once, twice, or not at all. Just by excluding those bigrams with a small count from a model, a significant saving in memory can be achieved. In a typical training corpus, roughly 65% of unique bigram sequences occur only once.
Recently, several improvements over count cutoffs have been proposed. (Seymore and Rosenfeld, 1996) proposed a different pruning scheme for backoff models, where bigrams are ranked by a weighted difference of the log probability estimate before and after pruning.
Bigrams with difference less than a threshold are pruned.
(Stolcke, 1998) proposed a criterion for pruning based on the relative entropy between the original and the pruned model. The relative entropy measure can be expressed as a relative change in training data perplexity. All bigrams that change perplexity by less than a threshold are removed from the model. Stolcke also concluded that, for practical purpose, the method in (Seymore and Rosenfeld, 1996) is a very good approximation to this method.
All previous cutoff methods described above use a similar criterion for pruning, that is, the difference (or information loss) between the original estimate and the backoff estimate. After ranking, all bigrams with difference small enough will be pruned, since they contain no more information.
3
Distribution-Based Cutoff
As described in the previous section, previous cutoff methods assume that training data covers testing data. Bigrams that are infrequent in training data are also assumed to be infrequent in testing data, and will be cutoff. But in the real world, no matter how large the training data, it is still always very sparse compared to all data in the world. Furthermore, training data will be biased by its mixture of domain, time, or style, etc. For example, if we use newspaper in training, a name like “Lewinsky” may have high frequency in certain years but not others; if we use Gone with the Wind in training, “Scarlett O’Hara” will have disproportionately high probability and will not be cutoff.
We propose another approach to pruning. We aim to keep bigrams that are more likely to occur in a new document. We therefore propose a new criterion for pruning parameters from bigram models, based on the bigram distribution i.e. the probability that a bigram will occur in a new document. All bigrams with the probability less than a threshold are removed.
bigram distribution modelling. Then we investigate the effects of the definition of the subunit, and experiment with various ways to divide a training set into subunits. Experiments show that this not only allows a much more efficient computation for bigram distribution modelling, but also results in a more general bigram model, in spite of the domain, style, or temporal bias of training data.
3.1 Measure
of
Generality
Probability
In this section, we will discuss in detail how to estimate the probability that a bigram occurs in a new document. For simplicity, we define a document as the subunit of the training corpus. In the next section, we will loosen this constraint.
Term distribution models estimate the probability Pi(k), the proportion of times that of
a word wi appears k times in a document. In
bigram distribution models, we wish to model the probability that a word pair (wi-1,wi) occurs
in a new document. The probability can be expressed as the measure of the generality of a bigram. Thus, in what follows, it is denoted by Pgen(wi-1,wi). The higher the Pgen(wi-1,wi) is, for
one particular document, the less informative the bigram is, but for all documents, the more general the bigram is.
We now consider several methods for term distribution modelling, which are widely used in Information Retrieval, and extend them to bigram distribution modelling. These methods include models based on the Poisson distribution (Mood et al., 1974), inverse document frequency (Salton and Michael, 1983), and Katz’s K mixture (Katz, 1996).
3.1.1 The Poisson Distribution
The standard probabilistic model for the distribution of a certain type of event over units of a fixed size (such as periods of time or volumes of liquid) is the Poisson distribution, which is defined as follows:
! )
; ( ) (
k e k
P k P
k i i
i
i
λ
λ
= −λ= (3)
In the most common model of the Poisson distribution in IR, the parameter λi>0 is the
average number of occurrences of wi per
document, that is
N cfi
i =
λ
, where cfi is thenumber of documents containing wi, and N is
the total number of documents in the collection. In our case, the event we are interested in is the occurrence of a particular word pair (wi-1,wi)
and the fixed unit is the document. We can use the Poisson distribution to estimate an answer to the question: what is the probability that a word pair occurs in a document. Therefore, we get
i
e
i
P
w
w
P
gen(
i−1,
i)
=
1
−
(
0
;
λ
)
=
1
−
−λ (4)It turns out that using Poisson distribution, we have Pgen(wi-1,wi)∝c(wi-1,wi). This means that
this criterion is equivalent to count cutoff.
3.1.2 Inverse Document Frequency (IDF)
IDF is a widely used measure of specificity (Salton and Michael, 1983). It is the reverse of generality. Therefore we can also derive generality from IDF. IDF is defined as follows:
) log(
i i
df N
IDF = (5)
where, in the case of bigram distribution, N is the total number of documents, and dfi is the
number of documents that the contain word
pair (wi-1,wi). The formula
i
df N
=
log gives full
weight to a word pair (wi-1,wi) that occurred in
one document. Therefore, let’s assume,
i i i i
i gen
IDF w w C w w
P ( −1, )∝ ( −1, ) (6)
α i
i i i
i gen
IDF w w C w w
P ( 1, ) ( 1, )
−
− ∝ (7)
whereαis a weighting factor tuned to maximize the performance.
3.1.3 K Mixture
As stated in (Manning and Schütze, 1999), the Poisson estimates are good for non-content words, but not for content words. Several improvements over Poisson have been proposed. These include two-Poisson Model (Harter, 1975) and Katz’s K mixture model (Katz, 1996). The K mixture is the better. It is also a simpler distribution that fits empirical distributions of content words as well as non-content words. Therefore, we try to use K mixture for bigram distribution modelling. According to (Katz, 1996), K mixture model estimates the probability that word wiappears k
times in a document as follows:
k k
i k
P )
1 ( 1 )
1 ( )
( ,0
+ + + −
=
β
β
β
α
δ
α
(8)where δk,0=1 iff k=0 andδk,0=0 otherwise.α
andβ are parameters that can be fit using the observed mean λ and the observed inverse document frequency IDF as follow:
N cf
=
λ
(9)df N
IDF =log (10)
df df cf
IDF − = −
×
=
λ
2 1β
(11)β
λ
α
= (12)where again, cf is the total number of occurrence of word wiin the collection, df is the
number of documents in the collection that wi
occurs in, and N is the total number of documents.
The bigram distribution model is a variation of the above K mixture model, where we estimate the probability that a word pair (wi-1,wi) , occurs in a document by:
∑
= − = −
K
k i i
i
gen w w P k
P
1
1, ) 1 ( )
( (13)
where K is dependent on the size of the subunit, the larger the subunit, the larger the value (in our experiments, we set K from 1 to 3), and Pi(k) is the probability of word pair (wi-1,wi)
occurs k times in a document. Pi(k) is estimated
by equation (8), where α, andβare estimated by equations (9) to (12). Accordingly, cf is the total number of occurrence of a word pair (wi-1,wi) in the collection, df is the number of
documents that contain (wi-1,wi), and N is the
total number of documents.
3.1.4 Comparison
Our experiments show that K mixture is the best among the three in most cases. Some partial experimental results are shown in table 1. Therefore, in section 4, all experimental results are based on K mixture method.
Word Perplexity Size of Bigram
(Number of Bigrams)
Poisson IDF K
[image:4.595.77.275.491.617.2]Mixture 2000000 693.29 682.13 633.23 5000000 631.64 628.84 603.70 10000000 598.42 598.45 589.34 Table 1: Word perplexity comparison of different bigram distribution models.
3.2 Algorithm
The bigram distribution model suggests a simple thresholding algorithm for bigram backoff model pruning:
1. Select a thresholdθ.
2. Compute the probability that each bigram occurs in a document individually by equation (13).
3. Remove all bigrams whose probability to occur in a document is less than θ, and recomputed backoff weights.
4
Experiments
In conventional approaches, a document is defined as the subunit of training data for term distribution estimating. But for a very large training corpus that consists of millions of documents, the estimation for the bigram distribution is very time-consuming. To cope with this problem, we use a cluster of documents as the subunit. As the number of clusters can be controlled, we can define an efficient computation method, and optimise the clustering algorithm.
In what follows, we will report the experimental results with document and cluster being defined as the subunit, respectively. In our experiments, documents are clustered in three ways: by similar domain, style, or time. In all experiments described below, we use an open testing data consisting of 15 million characters that have been proofread and balanced among domain, style and time. Training data are obtained from newspaper (People’s Daily) and novels.
[image:5.595.318.530.319.454.2]4.1 Using Documents as Subunits
Figure 1 shows the results when we define a document as the subunit. We used approximately 450 million characters of People’s Daily training data (1996), which consists of 39708 documents.
0 1 2 3 4 5 6 7 8 9 10
550 600 650 700 750 800
M
illio
n
s
Word Perplexity
S
ize
(N
umber
of
B
igrams)
Count Cutoff Distribution Cutoff
Figure 1: Word perplexity comparison of cutoff pruning and distribution based bigram pruning using a document as the subunit.
4.2 Using Clusters by Domain as
Subunits
Figure 2 shows the results when we define a domain cluster as the subunit. We also used approximately 450 million characters of
People’s Daily training data (1996). To cluster the documents, we used an SVM classifier developed by Platt (Platt, 1998) to cluster documents of similar domains together automatically, and obtain a domain hierarchy incrementally. We also added a constraint to balance the size of each cluster, and finally we obtained 105 clusters. It turns out that using domain clusters as subunits performs almost as well as the case of documents as subunits. Furthermore, we found that by using the pruning criterion based on bigram distribution, a lot of domain-specific bigrams are pruned. It then results in a relatively domain-independent language model. Therefore, we call this pruning method domain subtraction based pruning.
0 1 2 3 4 5 6 7 8 9 10
550 600 650 700 750 800
M
illions
Word Perplexity
Si
ze
(N
um
ber
of
Bi
gr
am
s)
[image:5.595.76.287.460.597.2]Count Cutoff Distribution Cutoff
Figure 2: Word perplexity comparison of cutoff pruning and distribution based bigram pruning using a domain cluster as the subunit.
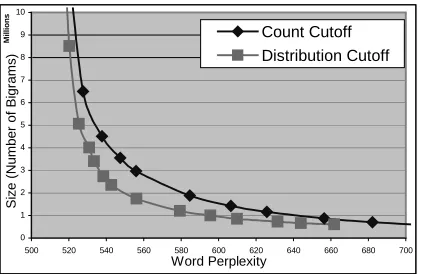
4.3 Using Clusters by Style as
Subunits
0 1 2 3 4 5 6 7 8 9 10
500 520 540 560 580 600 620 640 660 680 700
M
illions
Word Perplexity
Si
ze
(N
um
ber
of
Bi
gr
am
s)
[image:6.595.319.529.87.227.2]Count Cutoff Distribution Cutoff
Figure 3: Word perplexity comparison of cutoff pruning and distribution based bigram pruning using a style cluster as the subunit.
4.4 Using Clusters by Time as
Subunits
In practice, it is relatively easier to collect large training text from newspaper. For example, many Chinese SLMs are trained from newspaper, which has high quality and consistent in style. But the disadvantage is the temporal term phenomenon. In other words, some bigrams are used frequently during one time period, and then never used again.
Figure 4 shows the results when we define a temporal cluster as the subunit. In this experiment, we used approximately 9,200 million characters of People’s Daily training data (1978--1997). We simply clustered the document published in the same month of the same year as a cluster. Therefore, we obtained 240 clusters in total. Similarly, we found that by using the pruning criterion based on bigram distribution, a lot of time-specific bigrams are pruned. It then results in a relatively time-independent language model. Therefore, we call this pruning method temporal subtraction based pruning.
0 0.2 0.4 0.6 0.8 1 1.2 1.4
1200 1300 1400 1500 1600 1700 1800 1900 2000
M
illio
n
s
Word Perplexity
Size
(Number
of
Bigrams)
Count Cutoff
Distribution Cutoff
Figure 4: Word perplexity comparison of cutoff pruning and distribution based bigram pruning using a temporal cluster as the subunit.
4.3 Summary
In our research lab, we are particularly interested in the problem of pinyin to Chinese character conversion, which has a memory limitation of 2MB for programs. At 2MB memory, our method leads to 7-9% word perplexity reduction, as displayed in table 2.
Subunit Word Perplexity Reduction
Document 9.3%
Document Cluster by Domain
7.8%
Document Cluster by Style
7.1%
Document Cluster by Time
[image:6.595.76.287.88.225.2]7.3%
Table 2: Word perplexity reduction for bigram of size 2M.
As shown in figure 1-4, although as the size of language model is decreased, the perplexity rises sharply, the models created with the bigram distribution based pruning have consistently lower perplexity values than for the count cutoff method. Furthermore, when modelling bigram distribution on document clusters, our pruning method results in a more general n-gram backoff model, which resists to domain, style or temporal bias of training data.
5
Conclusions
[image:6.595.312.527.410.528.2]that are more likely to occur in a new document. We then developed a criterion for pruning parameters from n-gram models, based on the n-gram distribution i.e. the probability that an n-gram occurs in a document. All n-grams with the probability less than a threshold are removed. Experimental results show that the distribution-based pruning method performed 7-9% (word perplexity reduction) better than conventional cutoff methods. Furthermore, when modelling n-gram distribution on document clusters created according to domain, style, or time, the pruning method results in a more general n-gram backoff model, in spite of the domain, style or temporal bias of training data.
Acknowledgements
We would like to thank Mingjjing Li, Zheng Chen, Ming Zhou, Chang-Ning Huang and other colleagues from Microsoft Research, Jian-Yun Nie from the University of Montreal, Canada, Charles Ling from the University of Western Ontario, Canada, and Lee-Feng Chien from Academia Sinica, Taiwan, for their help in developing the ideas and implementation in this paper. We would also like to thank Jian Zhu for her help in our experiments.
References
F. Jelinek, “Self-organized language modeling for speech recognition”, in Readings in Speech
Recognition, A. Waibel and K.F. Lee, eds.,
Morgan-Kaufmann, San Mateo, CA, 1990, pp. 450-506.
D. Miller, T. Leek, R. M. Schwartz, “A hidden Markov model information retrieval system”, in
Proc. 22ndInternational Conference on Research
and Development in Information Retrieval,
Berkeley, CA, 1999, pp. 214-221.
V.W. Zue, “Navigating the information
superhighway using spoken language interfaces”, IEEE Expert, S. M. Katz, “Estimation of probabilities from sparse data for the language model component of a speech recognizer”, IEEE Transactions on Acoustic, Speech and Signal Processing, ASSP-35(3): 400-401, March, 1987.
K. Seymore, R. Rosenfeld, “Scalable backoff
language models”, in Porc. International
Conference on Speech and Language Processing, Vol1. Philadelphia,PA,1996, pp.232-235
A. Stolcke, “Entropy-based Pruning of Backoff Language Models” in Proc. DRAPA News
Transcriptionand Understanding Workshop,
Lansdowne, VA. 1998. pp.270-274
M. Mood, A. G. Franklin, and C. B. Duane, “Introduction to the theory of statistics”, New York: McGraw-Hill, 3rdedition, 1974.
G. Salton, and J. M. Michael, “Introduction to Modern Information Retrieval”, New York: McGraw-Hill, 1983.
S. M. Katz, “Distribution of content words and phrases in text and language modeling”, Natural Language Engineering, 1996(2): 15-59
C. D. Manning, and H. Schütze, “Foundations of Statistical Natural Language Processing”, The MIT Press, 1999.
S. Harter, “A probabilistic approach to automatic keyword indexing: Part II. An algorithm for probabilistic indexing”, Journal of the American
Society for Information Science, 1975(26):
280-289
J. Platt, “How to Implement SVMs”, IEEE
Intelligent System Magazine, Trends and