Munich Personal RePEc Archive
Distance to the Pre-industrial
Technological Frontier and Economic
Development
Özak, Ömer
Department of Economics, Southern Methodist University
October 2016
Online at
https://mpra.ub.uni-muenchen.de/84892/
Distance to the Pre-industrial Technological Frontier
and
Economic Development
∗¨
Omer ¨Ozak†
Department of Economics Southern Methodist University
February 19, 2018
Abstract
This research explores the effects of distance to the pre-industrial technological frontiers on com-parative economic development in the course of human history. It establishes theoretically and empirically that distance to the frontier had a persistent non-monotonic effect on a country’s pre-industrial economic development. In particular, advancing a novel measure of the travel time to the technological frontiers, the analysis establishes a robust persistent U-shaped relation between distance to the frontier and pre-industrial economic development across countries. Moreover, it demonstrates that countries, which throughout the last two millennia were relatively more distant from these frontiers, have higher contemporary levels of innovation and entrepreneurial activity, suggesting that distance from the frontier may have fostered the emergence of a culture conducive to innovation, knowledge creation, and entrepreneurship.
Key Words: Comparative Development, Geographical Distance, Culture and Technology, Innovation, Techno-logical Diffusion and Imitation, Patenting Activity, Entrepreneurship
JEL classification: F15, F43, N70, O10, O31, O33, Z10
∗I wish to thank wish to thank two anonymous referees, an associate editor, the editor, Quamrul Ashraf, Dror Brenner,
Carl-Johan Dalgaard, Klaus Desmet, Ruben Durante, Martin Goetz, Peter Howitt, Ross Levine, Glenn Loury, Stelios Michalopoulos, Dan Millimet, Elias Papaioannou, Yona Rubinstein, Dietrich Vollrath, Romain Wacziarg, and David Weil; as well as participants at the Spatial Structures in the Social Sciences Summer School, the EconCon conference at Princeton University, the NBER Macroeconomics and Income Distribution Summer Institute, and Warwick University’s Summer School in Economic Growth; and seminar participants at Brown University, El Colegio de M´exico, Southern Methodist University, the World Bank, University of Houston, and Universidad Nacional de Colombia for comments and helpful discussions.
†Send correspondence to: ¨Omer ¨Ozak, Department of Economics, Southern Methodist University, PO Box 0496,
1
Introduction
The origins of comparative economic development across the world has been one of the most fun-damental research agendas in the social sciences. The literature on the subject has focused on deep determinants such as geographical, institutional, cultural and human characteristics (Diamond, 1997;
Acemoglu et al., 2001; Guiso et al., 2009; Alesina et al., 2013; Ashraf and Galor, 2013; Galor and ¨Ozak,
2016). In particular, given their adverse effect on trade and technological diffusion, geographical iso-lation and distances to the technological frontier have been widely viewed as fundamental sources of the prevailing inequality among countries (Smith, 1776; Redding and Venables, 2004; Feyrer, 2009; Spolaore and Wacziarg, 2009; Ashraf et al., 2010). This conventional view is based on the fundamental role trade plays in the diffusion of technology and in creating economies of scale in the contemporary era. However, given the limited scope of trade in the pre-industrial era, the conventional channels through which distance could have generated negative effects on productivity, may not have been significant.
This research explores the effects of distance to the pre-industrial technological frontiers on compar-ative economic development in the course of human history. It proposes that during the pre-industrial era, while a country’s remoteness from the frontier diminished imitation, it fostered the emergence of a culture conducive to innovation, knowledge creation and entrepreneurship, which may have persisted into the modern era. The contribution of these cultural values to productivity have counteracted the adverse effect of distance from the frontier via diminished technological diffusion. Thus, the theory proposes that the interaction of these opposing forces resulted in a U-shaped relation between economic development and the distance to the frontier in the pre-industrial era.
In line with the predictions of the theory, the analysis establishes both theoretically and empirically that distance to the frontier had a persistent non-monotonic effect on a country’s pre-industrial level of economic development. In particular, advancing a novel measure of the travel time to the technological frontiers, the analysis establishes a robust persistent U-shaped relation between distance to the frontier and pre-industrial economic development across countries. Moreover, it demonstrates that countries, which throughout the last two millennia were relatively more distant from these frontiers, have higher contemporary levels of innovation and entrepreneurial activity, suggesting that distance from the frontier may have fostered the emergence of a culture conducive to innovation, knowledge creation, and entrepreneurship.
been too slow or costly, which may have promoted the generation of native innovations. Thus, these forces diminished the usefulness and availability of foreign technology and increased the incentives for native innovation that distant countries faced. While all countries might have been imitating, adapting and innovating, the degree to which each activity was pursued was affected by their geographical location with respect to the frontier. Moreover, as successive generations faced similar incentives, a process of intergenerational learning-by-doing in the creation of knowledge may have reinforced this pattern of specialization, facilitating the emergence of an innovative and entrepreneurial culture.
The proposed theory generates several testable predictions regarding the effect of distance to the pre-industrial technological frontier on economic development across countries. First, the theory predicts the existence of a U-shaped relation between the distance to the frontier and economic de-velopment across countries in the pre-industrial era. Specifically, the theory suggests that during the pre-industrial era, countries located at intermediate distances from the technological frontier were less developed than countries closer to or more distant from it, making these intermediate distances the Least Desirable Distances from the technological frontier. Second, the theory suggests that increases in a country’s distance to the frontier (e.g., due to a change in the location of the frontier) should have positively impacted its level of economic development, especially among countries that were dis-tant. Third, the theory predicts that the more time a country was farther than countries located at the bottom of the U-shape, i.e., at the More Desirable Distances, the longer it benefitted from its incentives to imitate, adapt and innovate. Thus, the cumulative time a country spent at these distances (across technological frontiers in the pre-industrial era) should be positively associated with its level of development. Finally, the theory suggests that the more time a country was remote from the frontier, the longer it experienced conditions that may have facilitated the emergence of an inno-vative and entrepreneurial culture. Thus, the cumulative time a country spent at the More Desirable Distances (across technological frontiers in the pre-industrial era) should be positively associated with its innovative and entrepreneurial activities in the contemporary era.
To explore these predictions empirically, the research introduces a novel measure of the pre-industrial geographic distance between countries and pre-pre-industrial technological frontiers. For each country, this measure estimates the potential minimum travel time to the pre-industrial technological frontiers, accounting for human biological constraints, as well as geographical and technological fac-tors that determined travel time before the widespread use of steam power. This strategy overcomes
the potential mismeasurement of distances generated by using geodesic distances ( ¨Ozak, 2010), for
a period when travel time were the most important determinant of transportation costs (O’Rourke and Williamson, 2001). Additionally, it removes the potential concern that travel time to the frontier reflect a country’s stage of development, mitigating further possible endogeneity concerns. The re-search validates these measures by (i) analyzing their association to actual historical travel time; (ii) examining their explanatory power for the location of historical trade routes in the Old World; and (iii) analyzing their association to genetic and cultural distances.
in a country’s distance to the frontier (due to changes in the location of frontiers) on pre-industrial economic development across countries. Moreover, the analysis establishes that the length of time a country was relatively more distant from the frontiers is positively associated with its economic development as well as its contemporary domestic patenting and entrepreneurial activities.
The analysis establishes these results in various layers: (i) a cross-country analysis of the relation between the distance to the pre-industrial technological frontier and technological sophistication in 1500CE; (ii) a cross-country panel-data analysis of the relation between the distance to the pre-industrial technological frontier and population density in the pre-pre-industrial era; (iii) a cross-country panel-data analysis of the relation between changes in the distance to the pre-industrial technological frontier and changes in population density in the pre-industrial era; (iv) a cross-country panel-data analysis of the cumulative effect of distance from the pre-industrial technological frontier on population density in the pre-industrial era; (v) a cross-country analysis of the relation between the distance to the last pre-industrial technological frontier and contemporary technological sophistication and income per capita; (vi) a cross-country analysis of the cumulative effect of distance from the pre-industrial technological frontier on contemporary income per capita; and (vii) a cross-country analysis of the cumulative effect of distance from the pre-industrial technological frontier on contemporary patenting and entrepreneurial activities.
The analysis accounts for a wide range of potentially confounding geographical factors that might have directly and independently affected a country’s economic development (e.g., elevation, area, malaria burden, share of area in tropical, subtropical or temperate zones, caloric suitability, latitude, island and landlocked regions). Moreover, unobserved geographical, cultural, and historical character-istics at the continental, regional or country level may have codetermined a country’s level of economic development. Hence, the analysis accounts for these unobserved characteristics by accounting for con-tinental, historical region, and when possible country and period fixed effects. Furthermore, it accounts for other time-varying pre-industrial country characteristics (e.g. change in caloric suitability due to the Columbian Exchange, colonial status, lagged technology levels, the onset of the Neolithic Rev-olution). Additionally, the analysis accounts for period-region fixed effects and thus for unobserved time-varying regional factors.
theory. Third, changes in the location of the pre-industrial technological frontier generated variations in the length of time countries were relatively remote from the frontiers. These variations permit the exploration of the cumulative and persistent effect of distance from the frontier on economic development across countries.
This research is the first attempt to analyze the effects of the geographical distance from the pre-industrial technological frontier on economic development. In doing so, it contributes to various literatures. First, it contributes to the literature on the effects of distance on development (Redding and Venables, 2002; Feyrer, 2009; Spolaore and Wacziarg, 2009; Ashraf et al., 2010; Puga and Trefler, 2010). This literature has focused mainly on the effects of distance on contemporary levels of trade and development across countries. An exception is Ashraf et al. (2010), which examined the impact of a country’s prehistoric degree of isolation (i.e., its average isolation level from all locations in a continental mass prior to the advent of seafaring and airborne transportation technologies) on its economic development. Their cross-country analysis finds a positive relation between their measure of prehistoric isolation and population density in the years 1, 1000, 1500CE, and GDP per capita in 2000CE. In contrast, this research explores the effect of distance to the technological frontier during the pre-industrial era (i.e., after the introduction of seafaring technologies) on pre-industrial and contemporary economic development across countries. It is the first to establish the persistent U-shaped relation between distance to the frontier and development. Moreover, it provides evidence for a novel channel through which these pre-industrial distances may have had persistent effects on a country’s development. In particular, it presents novel evidence on the persistent effect of pre-industrial distances on contemporary innovative and entrepreneurial activities.
Second, the research contributes to the literature on the determinants of entrepreneurship (Knight, 1921; Schumpeter, 1934; Hwang and Powell, 2005; Guiso et al., 2015), which has stressed the role of personal traits as well as the cultural and institutional environment in the prevalence of an en-trepreneurial spirit. In contrast, this paper sheds light on a deep historical determinant of innovative and entrepreneurial activities. Finally, the research sheds additional light on the geographical origins of comparative development (Diamond, 1997; Gallup et al., 1999; Ashraf and Galor, 2013; Galor and
¨
Ozak, 2016). Specifically, it provides novel evidence of the changing effects of geography in the course of economic development (Andersen, Dalgaard and Selaya, 2016) and suggests a novel geographical de-terminant of cultural and institutional differences and their persistent effect on economic development
(Giuliano et al., 2006; Alesina et al., 2013; Galor and ¨Ozak, 2016).
2
Anecdotal Evidence
This section presents anecdotal evidence for the pre-industrial era that shows (i) the limited role trade could play in technological diffusion before 1850, (ii) the importance of human mobility in technological diffusion, (iii) the difficulty of technological diffusion across space, (iv) the intertemporal links in the imitation and creation of technology, and (v) examples supporting the theory.
2.1 Importance of Trade
Although trade plays a crucial role in the process of economic development in the modern era, his-torically its role seems to be more restricted, as high transportation costs during the pre-industrial era limited the amount and type of trade being conducted. For example, Maddison (1995) estimates that by 1820 world trade represented only 1% of world GDP. Clearly, trade in technological goods represented an even smaller share, especially since technologies embodied in goods were difficult to transport, as in the case of heavy machinery (e.g. clocks, steam engines, furnaces). Case in point, during its first 25 years of operation, the Boulton and Watt Co. constructed less than one additional steam engine per year in order to fulfill international orders, which represented 4% of their total sales during the period 1775-1800 (Tann, 1978). These low trade volumes in the pre-industrial era suggest that the indirect gains from trade via learning-by-doing or the direct gains from trade in technology were small before 1850.
Furthermore, many technologies could not be embodied in tradable goods (e.g. canal systems, water mills, three-field rotation system, husbandry rules), or required access to tacit knowledge in order to produce them (Robinson, 1974; Epstein, 2006; Jones, 2009). For example, Boulton and Watt had recurring problems securing the services of engineers or skilled mechanics who could travel and install their steam engines overseas (Tann, 1978). To these impediments one must add any kind of state intervention, which forbade the trade in technologies considered fundamental to national security or for the comparative advantage of the nation (Jeremy, 1977). British laws prohibiting the export of machinery and travel of skilled technicians during the 18th and 19th centuries, as well as the current embargo on the trade in nuclear weapons, technology, and knowledge, are examples of these types of
measures.1
2.2 Transferability across Space and Time
Under such circumstances, most technologies had to be invented in situ or imported, not directly
through the goods that embodied them, but indirectly through the people who knew the technology. For instance, Epstein (2006) after establishing that neither texts nor patents played a major role in technological diffusion in premodern times, argues that “[i]n practice, technological transfer could only be successfully achieved through human mobility”. Mokyr (1990) highlights the importance of master-and-apprentice and father-and-son dynasties in the diffusion of technology, especially in the machine and engineering sector:
1Furthermore, during the pre-industrial era most trade was based on goods that could not be produced locally due
“From Nuremberg and Augsburg the art of instrumentmaking spread to Louvain in the southern Nether-lands and from there to London. The London instrumentmaker Humfray Cole was apprenticed to the Li´ege craftsman Thomas Gemini. [...] Gemini himself had studied in the south of Germany. [...] Another German instrumentmaker, Nicholas Kratzer, lived in England for many years.” (Mokyr, 1990, p. 71,fn. 9)
Similarly, Justus von Liebig, the German chemist whose innovations and book on organic chemistry gave birth to the fertilizer industry, studied in Paris under Joseph Louis Gay-Lussac. In turn von Liebig was the professor of August von Hoffman, who moved temporarily to London in order to head the creation of the Royal College of Chemistry and taught there for about twenty years before returning to Germany, teaching the first generation of professionally trained English chemists. Another example is Leonardo Pisano, more commonly known as Fibonacci, who learned mathematics from the Arabs as a boy during his father’s trade missions in North Africa, and later introduced Europe to the use of
algebra.2
Besides the formal networks of scientists and apprentices, the dispersion of technologies was based also on the work of businessmen, merchants, diplomats, and spies, who many times were sent or travelled by their own initiative to the technological frontier in order to gain access to the most advanced products, ideas, processes, and the skilled workers who knew them (Robinson, 1958, 1974; Mokyr, 1990; Epstein, 2006; Jones, 2009). For example, Robinson (1958) notes that
“Eighteenth-century industry was conducted in an atmosphere of secrecy. The newspapers of Manchester, Birmingham and other industrial centres, during the seventeen-seventies and ‘eighties, contain frequent references to foreign spies who were snooping in factories and warehouses to learn the trade secrets of the area and to entice away the workmen who knew them. Committees were formed to protect these trade secrets by warning the locality about foreigners and by enforcing the various acts against the exportation of tools and the enticing of artisans abroad, so that every manufacturer became spy-conscious and perhaps more deliberately secretive than he already was”. (Robinson, 1958, p. 3)
Similarly, in 1789, after a notorious spy was caught exporting drawings, plans and objects of industrial interest, the Birmingham industrialist, Samuel Garbett, complained to Matthew Boulton, Watt’s partner, that
“[o]ur country [UK] is certainly considered as a School of the Arts and that great improvements in Manu-facture are originating here. And it seems We are a common plunder for all who will take the trouble of coming here. And our Magazine of Secrets at the Patent Office is exposed to all Foreigners” (Robinson, 1974, p. 91).
These examples highlight the two central dimensions through which technology was accumulated, which are central to the mechanism highlighted in this paper. First, technology moved across space, from advanced to less advanced regions, by means of the people who travelled to the first, learning and copying the technology there, and bringing it back to the latter. Second, across time, between generations of innovators, fathers and sons, masters and apprentices.
2This last example exemplifies how trade’s effect on the diffusion of innovation could be related more to the
Clearly the movement along the first dimension is easier the closer the two regions are geograph-ically or culturally. For example, it was easier for Francis Cabott Lowell to visit the textile mills in Lancashire in 1810 and appropriate the new techniques, which would revolutionize manufacturing in the U.S., than it would have been to do so for the contemporaries of Willem Van Ruysbroeck in 13th-century Mongolia, Marco Polo in 13th-13th-century China, Rabban bar Sauma in 13th-13th-century Europe or
Matteo Ricci in 16th-century China.3
Additionally, if the technology is not generally applicable across space, or requires modification in order to be useful in different locations and environments, the diffusion across space will be facilitated by the proximity to the frontier, requiring less tinkering and toiling in order to adapt the technology to its new location. For instance, the diffusion of the “new husbandry” in the Middle Ages was slowed by these differences, in part because “[d]ifferent crops have different requirements, and the same crop will use different inputs and technology depending on elevation, rainfall, soil type, and so on” (Mokyr, 1990, p. 32).
Similarly, agricultural techniques, windmills, waterwheels, among other machines, required
adap-tation in order to work in different locations.4 Jones (2009) mentions the impressions made by the
visit of a skilled Welsh ironmaster to Tarnowitz in 1786 on the Prussian Commissioner for Affairs of War, Taxation, Mining and Factories, who concluded that “some ideas were made active in Silesia, old ones improved, some implemented in part, insofar as the differing location of German industry as compared to that of England permits”. Similarly, the diffusion of the Bessemer and Siemens-Martin processes of steel production encountered many problems given that they could only be used with phosphorous-free iron ores, which were not abundant (Mokyr, 1990). Also, Epstein (2006) mentions the problems of applying the structural theory for Gothic churches across regions in Europe, as well as other techniques, noting the difficulty of transferring “recipes”, adding that “recipes, as opposed to machines, were hard to transfer, because their result depended critically on a combination of material ingredients, and atmospheric and other conditions that could not be easily controlled for, and thus, easily reproduced” (p.23).
2.3 The Mechanism and Examples
Thus, distance to the technological frontier decreases the diffusion of technology across space by making it more difficult for people to move between their home location and the frontier, and by limiting the usefulness of the acquired knowledge and technology. At the same time, this lower usefulness
3Although the motives behind their voyages varied, and so did the circumstances with which they were received, it
is clear that Lowell’s endeavor was facilitated by him sharing a common language, customs, and religion with his hosts. On the other hand, the difficulties, the hostility, and general lack of trust with which these emissaries and ambassadors were received, gives an idea of how difficult the situation might have been for foreigners lacking their credentials. Van Ruybroeck, also known as Rubruquis, tells of how, in the beginning of his voyage, his guide distrusted him, and how at their arrival at Kˆublˆai Khˆan’s court, his guide was well received and offered proper accommodations, while the friar and his companions were given a small hut, and they “were called and closely questioned as to the business which had brought” them there [van Ruysbroek 1900, p. 166-167; Polo 1858, p. 66-7]. Marco Polo notes that the people of Maabar distrust sailors [Polo 1858, p. 263; Beazley 1906, p. 138]. Similarly, Rabban bar Sauma, a Christian envoy of the Mongols, was initially treated as a heretic upon his arrival to Rome (Budge, 1928, pp.56-63).
4Bazzi et al. (2016) present evidence that the problem of transferability across space in the agricultural sector is still
demands additional innovative work in order to adapt the technologies to local conditions (Mokyr, 1990; Epstein, 2006; Immelt et al., 2009). So, a greater distance to the frontier decreases the offer of directly applicable technologies, but simultaneously increases the innovative effort of the distant receiving society. Additionally, a larger distance to the frontier, which increases the cultural distance to the frontier, expands the possible new uses of any given technology (Ehret, 2002), resulting in more innovation in distant locations.
Moreover, for far enough locations it might be more economical to create the technology at those locations than to go through the process of imitation and adaptation. Thus, one can expect to observe independent innovation in multiple geographical locations, contrary to the diffusionist view (Blaut, 1987, 2012). In particular, this process can potentially increase the innovativeness of distant economies, allowing them to accumulate skills and technology across time. Since the transmission of skills and technologies within a location is easier than across space, and also more efficient and effective the more experienced the master or elder is (Epstein, 2006), the increased demand for innovative effort in distant locations may be accompanied by an improved intergenerational transmission of skills and technology.
All this is conducive to the independent and persistent creation of technologies and innovativeness in locations distant from the technological frontier. Case in point, the Old and New Worlds were mostly incommunicated between the last ice age and the modern discovery voyages, but in both land-masses people independently discovered agriculture and domestication (Diamond, 1997), the compass (Carlson, 1975), and the number zero (Kaplan, 2000), among others. Similarly, research on African medicine has found that kingdoms, like the Bunyoro-Kitara in Uganda, which were isolated from the
rest of the world until around the 18th century, had discovered the use of the Caesarean section and
variolation through inoculation, among other medical technologies (Felkin, 1884; Davies, 1959; Dunn, 1999). Moreover, distant cultures like the kingdoms of Mapungubwe and Great Zimbabwe were some of the most complex societies in Africa (Huffman, 2009). Additionally, ethno-mathematicians have shown that some pre-colonial African and Amerindian cultures had advanced (native) mathematical knowledge in areas like congruences, boolean algebra, fractals, topology, graph theory, etc. (Zaslavsky,
1999; Ascher, 1991, 2002; Bangura and Bangura, 2011; Selin, 2003).5 Similarly, many ancient
Chi-nese mathematical innovations and results, like solutions to linear, quadratic and cubic equations,
Horner’s method and Descartes’ rule of signs, were much later rediscovered in Europe (Smory´nski,
2008; Needham and Wang, 2008; Joseph, 2011).
Further evidence can be found in the improvement of non-native technologies. For example, around the year 1CE African iron-smelting, which had been introduced from the eastern Mediterranean around 500BCE, was technologically superior to European, Middle Eastern, and South Asian smelting
tech-niques (Austen and Headrick, 1983).6 Analogously, the windmill, which had been invented in central
Asia and imported to Europe by its contact with the technologically advanced Islamic world, was
5It is interesting to note that some of this knowledge is being currently used to understand modern mathematical
problems. For example, the mathematical ideas inherent in the kola designs of the Tamil Nadu in southern India have influenced the development of modern computer science theory (Katz, 2003). See also Selin (1997) and Joseph (2011).
6There still exists a debate among archeologists about the possibility of an independent discovery of iron smelting in
developed and attained its state of perfection in the Netherlands (Mokyr, 1990). These last two exam-ples defy conventional wisdom since it is in locations far away from the technological frontier and from the source of original innovation where these technologies attained their highest expression. Similarly, Great Britain’s location made it one of the most distant places relative to the technological frontiers in the Old World until about the 14th century, when the “English had long been known as the perfecters of other people’s ideas [...]”, to which “[a] Swiss calico painter remarked in 1766 of the English: ‘they cannot boast of many inventions, but only of having perfected the inventions of others [...]” (Mokyr 1990, p. 240). Finally, Nicholas (2011), Choi (2011), and Hashino (2012) have recently shown that
local innovation played a mayor role in Japan’s industrialization process during the 20th century.
3
A Model of Technology Imitation and Creation
This section introduces a model that generates a U-shaped relation between the distance to the
tech-nological frontiers and economic development.7 The model embeds the main elements of the proposed
theory and of the historical evidence in a fairly standard overlapping generations model. The main features of the model are (i) the presence of imitation, adaptation and innovation processes, (ii) the presence of negative spatial spillovers in the process of imitation, and (iii) the presence of positive (sector specific) intertemporal spillovers in the processes of imitation, adaptation and innovation. The presence of negative spatial spillovers in the process of imitation, which captures the loss of function-ality of pre-industrial technologies when moved across space, captures the essential force highlighted by conventional wisdom. Without it, there would not exist spatial variations in economic development in the model or economic development would otherwise be positively associated with the distance from the technological frontier. Similarly, the presence of positive intertemporal spillovers due to learning-by-doing or learning-by-watching in the processes of adaptation and innovation, which have characterized these processes during the pre-industrial and contemporary eras, play a fundamental role in the emergence of the U-shape. Without these positive spillovers, although larger distances would generate a reallocation of resources from imitation to innovation, the additional innovation would not be enough to counteract the negative effects of the spatial spillover. On the other hand, if the positive intertemporal spillovers in adaptation and innovation are sufficiently strong, especially stronger than any potential positive intertemporal spillovers in imitation, then a U-shaped relation between the distance to the technological frontier and economic development may exist.
3.1 Setup
The world consists of a set of economiesE ⊆Rnandntechnological leaders. Assume that all economies
inE are identical except for their geographical distanced= (d1, . . . , dn) from these leaders, and thus
identify each economy with this distance vectord. Each economyd∈ E, is populated by overlapping
generations of two-period lived individuals. Population is constant and is normalized so that its size is 1. Each individual is endowed with one unit of time when young and one unit of time when old. For simplicity, assume that young individuals can only engage in activities of imitation or creation of
technology, and do not engage in consumption. On the other hand, old individuals can only engage in production and consumption activities, where their production possibilities are determined by their own technology, which is generated by their decisions when young and the technology inherited from
their parents.8 Under these assumptions the individual’s only meaningful economic decision is how to
allocate her labor when young between innovation and imitation from the ntechnological frontiers in
order to maximize the growth rate of technology. Thus, to simplify notation, denote by the subscript
t all variables corresponding to individuals born int−1 who will be old in period t.
An individual born in period t−1 inherits a level of technology At−1 from her parents. She
increases her stock of technology, which will be available for production in period t, using two types
of intermediate activities. In particular, she produces an intermediate input, ˜I, by imitation from
the technological frontiers, and a second one, ˜R, through independent creation. Her productivity in
each activity depends not only on the amount of labor she allocates to it, but also on sector specific intertemporal spillovers due to learning-by-doing or learning-by-watching in imitation and creation of technologies by her ancestors. Importantly, the individual does not take into account the effect of her own allocations on the sector specific productivities of her descendants. In particular, let
lt denote the amount of labor she allocates to independent creation and ijt denote the amount of
time she allocates to imitating from frontier j, so that, Pjijt = 1−lt. Additionally, denote by
lt = (lt, lt−1, . . .) and ijt = (ijt, ijt−1, . . .) the history of allocations up to generation t. She produces
a quantity ˜Rt = aSRlαtAt−1 of independent knowledge, where a > 0, α ∈ (0,1) and SR = SR(lt−1)
captures the positive intertemporal spillovers in innovation. She devotes the rest of her time, (1−lt), to
creating intermediate knowledge through imitation from the frontiers. Assume that the intermediate knowledge from each frontier is generated using similar technologies, namely
˜
Ijt =b(dj)SIjiβjtAt−1, j= 1, . . . , n (1)
whereβ ∈(0,1), the functionb:R+→R++is continuous, decreasing, twice differentiable. b(dj)
cap-tures the negative effect of distance on the productivity of imitation, whileSIj =SIj(ijt−1) captures
the positive intertemporal spillovers in imitation from frontierj. She combines the intermediate
knowl-edge she gained from the frontiers through a constant elasticity of substitution production function to produce her aggregate knowledge from imitation
˜
It=
n
X
j=1
λ2jI˜jtρ2
1
ρ2
(2)
wherePnj=1λ2j = 1,λ2j ∈[0,1], 0< ρ2 ≡ η2η−21 <1, andη2 is the constant elasticity of substitution of
knowledge between any two frontiers. The new knowledge she gains from imitation and independent creation are aggregated through another constant elasticity of substitution production function to
8These assumptions are made for convenience and in order to simplify the analysis. Changing them would not alter
produce total new knowledge, which is added to her existing stock of technology. LettingRt= ˜Rt/At−1
and It= ˜It/At−1, the growth rate of technology can be written as
gt=
At−At−1
At−1
=hλ1Rρt1+ (1−λ1)Itρ1
i1
ρ1
, (3)
whereλ1∈(0,1), 0< ρ1 ≡ η1η−11 <1, andη1is the constant elasticity of substitution between imitation
and creation. Let u(ct), be the utility an individual born in period t−1 derives from consumption,
whereu′(c)>0,u′′(c)<0. She choosesl
t∈[0,1] andijt ∈[0,1] forj= 1, . . . , n, in order to maximize
her lifetime expected utility, i.e. she solves the following problem
max
(lt,(ijt)nj=1)∈[0,1]n+1
u(ct) subject to ct=(1 +gt)At−1, lt+
n
X
j=1
ijt = 1, (4)
which amounts to maximizing the growth rate gt.
From the individual’s point of view, the only difference between frontiers is their distance, so, in
order to maximize her lifetime expected utility, her time allocations when young, lt and{ijt}nj=1, have
to equalize the marginal product of labor across sectors. Importantly, increasing the distancedj lowers
the marginal product of labor in imitation from frontierj, without affecting the marginal productivity
of labor in any other activity. Thus, increases in dj generate a reallocation from imitation from j to
all other activities, including innovation. This reallocation process lies at the heart of the mechanism highlighted in this paper.
Furthermore, the sector specific intertemporal spillovers play an essential role in the effects of this reallocation across sectors in the model. In particular, without them the steady state growth rate of the economy would be a decreasing function of distance. To see this, notice that the growth rate
can be rewritten as a strictly concave function of the labor allocation in innovation lt, so that the
optimal growth rate in a steady state isg(l∗(d), d)≡g∗(d). Without any sector specific intertemporal
spillovers, the envelope theorem implies thatg′∗(d) =g
d<0, where gd is the partial derivative of the
growth rate with respect to distance. Thus, without spillovers, the model would predict that distance has a negative monotonic relation with development as in the conventional wisdom. On the other
hand, if the sector specific intertemporal spillovers are present, theng′∗(d) =g
SR+gSI+gd⋚0, where
gSR and gSI are the effects of the spillovers on the growth rate. This opens up the possibility for the
emergence of a U-shape in the steady state, depending on the signs and relative sizes of gSR and gSI.
In order to simplify the analysis, assume that the sector specific intertemporal spillovers due to
learning-by-doing, SR(lt−1) and{SIj(ijt−1)}nj=1, are continuous, bounded, differentiable and concave
functions of its elements, and satisfy the following property: for any steady state allocations l =
(l, l, . . .) andij= (ij, ij, . . .), j= 1, . . . , n,SR(l)∝lα ′
andSIj(ij)∝iβ
′
j , whereα′, β′ ∈(0,1]. I.e., in a
steady state the intertemporal sector specific spillovers are proportional to a concave function of the
steady state allocation in each sector.9
9The following functions satisfy these conditions: (i)S(
xt−1) =xβ ′
t−1, (ii) S(xt−1) = limT→∞T1 PTτ=0xβ
′
t−1−τ, (iii)
S(xt−1) = (limT→∞T1 PTτ=0xt−1−τ)β
′
, (iv)S(xt−1) =P∞τ=0δτxβ ′
t−1−τ, and (v)S(xt−1) = (P∞τ=0δτxt−1−τ)β
′
The steady state growth rate of economydgenerated by the individual’s optimal decisions is given
by10
g∗(d, λ2) =R∗(d, λ2)
λ1+ (1−λ1)
I
R(d, λ2)
ρ1ρ11
, (5)
whereλ2 = (λ2j)nj=1, andR∗(d, λ2) andI/R(d, λ2) are the optimal levels of imitation and of the ratio
of imitation to creation. Furthermore, the first factor is increasing and the second one is decreasing
in all the components of d. This implies, in particular, that increasing the distance to frontier j,dj,
increases the amount of creation while lowering the aggregate amount of imitation. As shown below, this trade-off, which is caused by individual’s desire to equalize the marginal product of labor, can generate under some conditions a U-shape in the level of development.
3.2 Steady-State Growth in a World with a Unique Frontier
Clearly, economies that are equidistant from all frontiers, effectively only have one frontier. Thus, individuals in these economies behave as if they lived in a world with a unique frontier. For these
economies, d =d·eand g∗(d, λ
2) =G(d), where eis the n dimensional vector of ones,d∈R+, and
G(d) is the steady state growth rate for an economy at distance din a world with a unique frontier.
Assume that
(α′+α)ρ1 <1, (β′+β)ρ1<1, (ES)
ρ1β
h
α′ α −
β′ β
i
x
1−(α′+α)ρ
1(1−x) + 1−(β′+β)ρ1x
=1 for some x∈(0,1). (U)
Condition (ES) ensures that in a steady state the marginal productivity of labor of young and old individuals is “jointly” decreasing in the production of intermediate products. Condition (U) gives a measure of the strength of intertemporal spillovers across sectors, and imposes limits on the differences
in labor productivities across them. Clearly, α′/α > β′/β is a necessary condition for (U) to hold,
which implies intertemporal spillovers are stronger in creation than imitation. Additionally, it implies that if in the production of each intermediate input the same quantities of current and past labor are
used, then the marginal rate of technical substitution between current and past labor is larger in I
than in R. So, as the distance d increases, the lower productivity of labor in imitation generates a
substitution out of imitation and into research. Under these assumptions, in a world with a unique
frontier,G(d) is U-shaped with the lowest growth rate attained at theLeast Desirable Distanced >¯ 0.11
Figure 1 depicts the relation between distancedand steady state growth rates in a world with a unique
frontier.
Figure 1: The steady state relationship between distance and economic growth in a world with one frontier.
d G(d)
¯
d
Figure 2: Isogrowth maps in a world with two frontiers.
d1=d2
D(λ2, a)
D(λ2,0)
D(λ2,−a)
d1 d2
¯
d
¯
d
F2
F1
• •
(a) Convexb(d)
d1=d2
D(λ2, a)
D(λ2,0)
D(λ2,−a)
d1 d2
¯
d
¯
d
F2
F1
• •
(b) Concaveb(d)
These figure depict the isogrowth maps in a world with two frontiers.F1andF2denote the locations
of frontiers 1 and 2, which are at a distanced12from each other. Every point (d1, d2), which does
not belong to the triangle generated by the frontiers and the origin, represents an economy located at a distanced1 from frontier 1 andd2from frontier 2. Every isogrowth curveD(λ2, a) represents
the set of economies that have the same growth rate.D(λ2,0) is the set of economies that have the
lowest growth rate. The arrows show the direction of increase in the growth rate.
3.3 Steady-State Growth in a World with a Many Frontiers
Since anyd∈R+can be written asd= ¯d+z, for somez∈R, the previous result implies that in a world
with nfrontiers, the growth rate of equidistant economies is given by g∗( ¯d+z)·e, λ2
=G( ¯d+z),
so that the growth rate for these economies is also U-shaped. Also, since the set of economies E in the
world can be partitioned by the z-isogrowth sets
D(λ2, z) =
d∈ E |g∗(d, λ2) =G( ¯d+z) , (6)
which is the set of economies that grow at rate G( ¯d+z), a similar non-monotonicity holds for all
rates looks like a valley with the economies belonging to D(λ2,0) at its bottom. Figure 2 depicts two
general isogrowth maps in a world with two frontiers when (a) b(d) is convex or (b) b(d) is concave.
Clearly, the shape and direction of the valley will depend on the functional forms and parametrization
chosen. For example, for the CES functions above, figure 3 plots the g(d, λ2) and G( ¯d+z) functions
for an artificial economy in whichb(d) =b0e−b1d. The distance ¯dis the least desirable distance (LDD)
from the technological frontiers and is located where the 45-degree line intersectsD(λ2,0).
Figure 3: Artificial world with two frontiers
(a) Steady state growth rates for all economies.
(b) Steady state growth rates for equidis-tant economies or a world with only one frontier. Least Desirable Distance ¯din gray.
Notice that the non-monotonicity does not imply that being far from the frontiersalways increases
the growth rate. On the contrary, it only implies that there must exist economies which are farther from the frontiers and have higher growth rates than others which are closer to them. Furthermore,
conventional wisdom can be seen as a special case of this theory in which either (i) ¯d= ∞, so that
D(λ2, z) =∅for allz≥0, or (ii) the observable world is too small, so thatD(λ2,0) is not observable. In
either case, any empirical analysis would find a monotonic relation between distance and development.
3.4 Testable Predictions
The previous analysis suggests that if the theory proposed in this paper is valid, then for at least one
frontier j the Least Desirable Distance, LDDj, is positive, statistically significant, and smaller than
the maximum distance to frontier j in the sample. In particular, if all frontiers are identical and so
the model is fully symmetric, there should exist a U-shaped relation with respect to the distance to each one of them, as depicted in Figure 3(a). Clearly, any asymmetry due to differences in the way
frontiers affect imitation, may cause the U-shape with respect to some frontier to not be identifiable.12
12Symmetry conditions need not hold for all frontiers since imitation from different frontiers can be affected by
lin-guistic, cultural, institutional or geographical differences. In particular, it can be shown that variations in the parameters of the model, e.g. λ2orρ2, can disrupt the symmetry of the model and cause estimates not to find a U-shaped effect on
development of the distance from certain frontiers. For example, consider the case whenλ2j→0 for somej. In this case,
On the other hand, if conventional wisdom holds, then for all frontiers j = 1, . . . , n, the estimated
LDDj lies outside the sample and is statistically insignificant, i.e. LDDj =∞.
These predictions and Monte Carlo simulations presented in appendix E suggest using the following empirical specification to explore the relation between economic development and the distance to the technological frontier during the pre-industrial era across countries:
yit=β0+ n
X
j=1
(β1jdijt+β2jdijt2 ) +γ′xit+ǫit (7)
where for each country i, yit is its level of economic development in period t, dijt is its distance to
the j-th pre-industrial technological frontier in period t, xit are other covariates in period t, and ǫit
is an error term. The proposed theory implies that for at least one frontier j β1j <0, β2j >0, and
the implied Least Desirable Distance (LDDj =−0.5β1j/β2j) is positive, statistically significant, and
smaller than the maximum distance to frontierj in the sample of countries.
Monte Carlo simulations (appendix E) suggest that this empirical specification tends to over-reject the proposed theory. In particular, using simulations, the analysis finds that in artificial economies in which the theory proposed in this paper is true, the estimation might not be able to capture this non-monotonic relation. Specifically, this test tends to over-reject the null hypothesis of the existence of a non-monotonicity. Thus, the presence of a non-monotonicity in the estimation is strong suggestive evidence that the underlying relation is non-monotonic.
Additionally, a corollary of the theory suggests that countries that are located farther than the Least Desirable Distance (LDD) at the More Desirable Distances (MDD) should be more developed. This in turn implies that if the location of the frontier changes exogenously, the more time an economy spends at the MDD (across technological frontiers), the more developed it should be. Furthermore, the theory suggests that remote economies, which become even more remote after the change in the location of a frontier should get a boost in their economic performance.
4
Data and Empirical Strategy
This section develops the empirical strategy and describes the data used to explore the existence of a U-shaped relation between the pre-industrial distance to the technological frontier and economic development across countries.
4.1 Empirical Strategy
1000CE, 1500CE and 1800CE. This allows it to analyze the relation in data constructed from in-dependent sources, over different samples, minimizing the potential effects of mismeasurement and sample selection on the analysis. Additionally, it permits the analysis to exploit cross-country and cross-period variation to explore the non-monotonic effect of distance to the frontier.
Second, the results may be biased by omitted geographical, institutional, cultural, or human char-acteristics of countries that might have determined their economic development and are correlated with their pre-industrial distance to the technological frontier. This research employs various strate-gies to mitigate this potential concern. In particular, the analysis accounts for a large set of possible confounding geographical characteristics (e.g., elevation, area, malaria burden, share of area in tropi-cal, subtropical or temperate zones, average caloric suitability, latitude and its square, being an island or landlocked). Moreover, it accounts for continental fixed effects and thus for any unobserved time-invariant heterogeneity at the continental level. In addition, it accounts for common history fixed effects controlling for any unobserved time-invariant heterogeneity due to common historical experi-ence across countries within a region. Additionally, when possible it accounts for country fixed effects and thus for unobserved time-invariant country-specific factors. Furthermore, it accounts for other time-varying country characteristics (e.g. change in caloric suitability due to the Columbian Exchange, colonial status, lagged technology levels), as well as period-region fixed effects and thus for unobserved time-varying regional factors.
Third, the analysis further mitigates the potential concern that the results may partially reflect the effect of omitted geographical, institutional, cultural, or human characteristics, by exploiting the variation in the location of the western technological frontier in the Old World. In particular, changes in the location of the technological frontier permit the research to account for country fixed effects and thus for time-invariant characteristics of a country. Moreover, it is plausible that the change in a country’s distance to the frontier may be exogenous to its characteristics, especially once region-period fixed effects are accounted for. If this were the case, the first difference estimator of equation (7) would be unbiased.
Fourth, variations in the location of the western frontier permit the analysis to mitigate various potential concerns by exploring the effects of changes in the distance to the frontier on changes in population densities across countries. In particular, as mentioned above, differences across periods in equation (7) account for omitted time-invariant determinants of population density across countries. Additionally, analyzing changes across different periods mitigates the potential concern that a partic-ular period or technological frontier drives the results. Another potential concern is that the results may not reflect the effect of being far from the frontier, but of countries that were distant from the frontier in one period and became closer to it in another period. Exploration of the differential effect of larger distances (to the technological frontiers) on population density in countries located far from the technological frontiers mitigates this concern.
country spent at the MDD (across technological frontiers in the pre-industrial era) should be positively associated with its level of development.
Finally, the results may reflect the European expansion in the post-1500CE era or other time-varying characteristics of a country. The analysis mitigates this potential concern by using various strategies. In particular, it restricts the analysis to the Old World, where European population replace-ment was less prevalent. Additionally, it establishes that the results hold for the pre-colonial period, before European expansion. Furthermore, it accounts for time-varying characteristics of a country (years since the Neolithic Revolution, lagged technological sophistication) as well as other changes generated in the Old World during the colonial period (e.g. changes in colonial status, changes in caloric suitability). In addition, it accounts for the interaction between region and period fixed effects, which control for the effects of time-varying region-specific unobserved heterogeneity, and thus partially account for the potential effects of European expansion and other omitted time-varying characteristics of a country.
4.2 Independent Variable: An Economic Measure of Pre-industrial Distance13
This section introduces a novel cross-country measure of the pre-industrial distance to the technological frontier in the pre-industrial era, which is the main independent variable employed in the analysis. This distance is based on a novel measure of geographical distance during pre-industrial times: the Human Mobility Index with Seafaring (HMISea). The HMISea measures the time required to cross any square kilometer on land and on some seas accounting for human biological constraints, as well as geographical and technological factors that determined travel time before the widespread use of steam power. Based on HMISea, the analysis estimates distances as the potential minimum travel time between locations (measured in weeks of travel). This strategy overcomes the potential mismeasurement of distances
generated by using geodesic distances ( ¨Ozak, 2010), for a period when travel time were the most
important determinant of transportation costs (O’Rourke and Williamson, 2001).
The estimated time required to cross each square kilometer on land is based on data on the maximal sustainable speeds of dismounted infantry movement under different climatic, topographical, and terrain conditions (Hayes, 1994). In particular, Hayes (1994) estimates the maximal sustainable speeds of dismounted infantry movement under different temperature, relative humidity, slope, and terrain conditions. Hayes focused on the levels of metabolic rates and speeds that can be sustained for long periods of time without causing a soldier to become a victim of heat-exhaustion.
Based on this data, the analysis estimates the relation between the maximum sustainable travel speeds and these conditions using Ordinary Least Squares (OLS). Given these OLS coefficients, the analysis proxies the time required to cross any square kilometer on land, given the average geograph-ical conditions prevalent in it. Additionally, it complements this Human Mobility Index (HMI) by estimating the time required to cross any square kilometer on seas in the Old World, by constructing average times for each sea from primary and secondary historical sources (see appendix A for a more
13Given space limitations, a more complete presentation of the material covered in this section is given in Appendix
complete description). Figure 4 depicts the resulting HMISea cost surface.
Figure 4: Human Mobility Index with Seafaring (HMISea) cost surface.
The figure depicts the number of hours required to cross each square kilometer on land and on seas in the Old World. Low values in dark lila, high values in dark brown, intermediate values in intermediate tones. See text or ¨Ozak (2010) for construction.
In order to validate this index, Appendix A applies the HMISea measure to estimate distances
during the pre-industrial era (see also ¨Ozak, 2010). In particular, it estimates the total time required
to travel along the optimal paths that connect all modern day capitals and the average optimal time required to travel to each capital from all locations on a contiguous continental mass. Using these estimates, the analysis validates the measures by comparing them with data on ancient trade routes (Ciolek, 2004). As established in Appendix A, the optimal paths among capitals predict the locations of ancient trade routes in the Old World (500BCE-1900CE). Additionally, it explores the relation between these historical migratory distances and genetic, religious, and linguistic distances (Fearon, 2003; Mecham et al., 2006; Spolaore and Wacziarg, 2009). Reassuringly, the optimal time required
to travel among regions is strongly positively associated with these cultural distances.14 Finally,
using data on the historical speed of diffusion of news to Venice between the 16th and 18th century
from a sample of cities (Braudel, 1972), the analysis establishes that HMISea travel time to Venice approximate these historical data. These results suggest that HMISea based migratory routes are good proxies for the minimum total travel time between the capital of each technological frontier in the pre-industrial era and the capitals of countries in the Old World.
Economic historians suggest that during the pre-industrial, the eastern technological frontier in the Old World era was located in China. On the other hand, the historical record suggests that the western technological frontier changed location during this era from the Eastern Mediterranean
(≈1CE), to Iraq (≈1000CE), to the Low Countries (≈1500CE), and to the UK (≈1750CE)
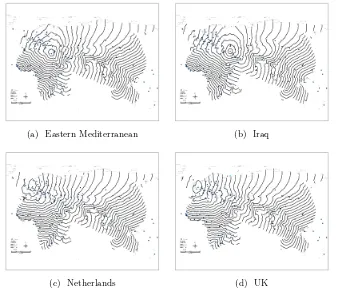
(Abu-Lughod, 1989; Maddison, 1995; Mokyr, 1990; Pomeranz, 2000; Maddison, 2003; Findlay and O’Rourke, 2007; Davids, 2008; Blaut, 2012). For each contemporary country the analysis estimates the HMISea migratory distance to all technological frontiers. Figure 5 depicts the travel time to each western
pre-14Further supportive evidence of the validity of this method has been provided elsewhere. In particular, as predicted
industrial technological frontier in the Old World. In particular, for each western frontier it depicts the iso-chronic lines generated by the HMISea measure, where each line corresponds to half a week of continuous uninterrupted travel.
Figure 5: Potential Travel Time to Western Pre-industrial Technological Frontiers (Old World)
(a) Eastern Mediterranean (b) Iraq
(c) Netherlands (d) UK
Note: Each panel depicts iso-chronic lines of travel time to a western pre-industrial technological frontier in the Old World. Each iso-chronic line represents half a week of continuous travel time along the optimal path to the frontier.
4.3 Dependent Variables and Additional Controls
In order to implement the empirical strategy, the analysis employs as independent variables various country-level measures of economic development for the pre-industrial era as well as measures of innovativeness and development during the contemporary era. First, the analysis employs an index of countries’ technological sophistication in 1500CE and 2000CE (Comin et al., 2010), which documents around each era whether a certain set of technologies was used or known by the residents of the region where a contemporary country is located. Second, the analysis employs a measure of population density for each contemporary country in 1CE, 1000CE, 15000CE and 1820CE (McEvedy and Jones, 1978). Third, in order to explore the persistence of the effect into the modern era, the analysis uses countries’ average level of GDP per capita, patents per capita and new firms per 1,000 people during the 2000-2015 period from the World Bank’s Development Indicators.
mean distance to nearest waterway, malaria risk, caloric agricultural suitability, climatic volatility and correlation, share of area within 100kms of sea, length of coastline, tropical, subtropical and temperate zones, as well as islands and landlocked regions. Furthermore, the analysis accounts for continental as well as historical region fixed effects, controlling for unobserved continent-specific geographical and historical characteristics that may have affected a country’s economic development.
The onset of agriculture has been associated with a technological head-start that persisted during the Malthusian era (Diamond, 1997; Ashraf and Galor, 2011). Thus, the empirical analysis considers the confounding effect of the advent of sedentary agriculture, as captured by the years elapsed since the onset of the Neolithic Revolution (Putterman, 2008), on countries’ economic development.
The analysis also considers the confounding effect of a country’s distance to other potential sources of economic development. In particular, it accounts for the effects of distance from a country to the closest pre-industrial trade route, which may reflect a country’s ability to trade goods or information during this era. Additionally, it accounts for the effects of countries’ distance to local technological frontiers as well as their distance to East Africa, which may independently have affected a country’s
development (Ashraf and Galor, 2013; Depetris-Chauvin and ¨Ozak, 2015a). Also, the empirical
anal-ysis accounts for the effect of the Columbian Exchange during the post-1500CE era. Specifically, it
accounts for the effect of changes in caloric suitability (Galor and ¨Ozak, 2016) as well as colonial
status, legal origin and religious composition on economic development across countries. Appendix B provides the description, source and summary statistics of all variables used in the analysis.
5
Distance to the industrial Technological Frontier and
Pre-industrial Development
This section analyses the relation between the pre-industrial distance to the technological frontiers
in the Old World and economic development across countries.15 In particular, the predictions of the
theory and Monte Carlo simulations (section 3 and 4.1, Appendix E) suggest that the theory can be tested using variations of the following empirical specification
yit=β0+ n
X
j=1
(β1jdijt+β2jd2ijt) +
X
j
γ0jxit+
X
c
γciδc+
X
t
γtδt+
X
ct
γctδciδt+ǫit (8)
where yit is a measure of its economic development in period t for country i, dijt is the number of
weeks of travel from country i to the j-th pre-industrial technological frontier in period t, xit are
additional characteristics of country i in period t (including geography), {δci} are a complete set of
continental/regional/historical/country fixed effects, {δt} are a complete set of period fixed effects,
15As explained in section 4.1, the analysis excludes the New World and Oceania in order to overcome various concerns.
and ǫit is an error term.16 The theory predicts thatβ1j <0,β2j >0, and the implied Least Desirable
Distance (LDDj =−0.5β1j/β2j) is positive, finite and statistically significant for at least one frontier
j.17
5.1 Historical Evidence I: Technological Sophistication (Cross-Country Analysis)
This section explores the relation between a country’s level of technological sophistication in 1500CE and the distance to the technological frontiers in the Old World during that period, namely the Netherlands and China. The technology indices for the year 1500 proxy a country’s stock of technology
and innovativeness.18 Thus, the dependent variable in these regressions measures the relevant channel
through which remoteness affects economic development according to the proposed theory.
Table 1 explores the existence of a non-monotonic relation between the pre-industrial distance to the technological frontier and technological sophistication across countries. In particular, it uses ordinary least-squares (OLS) regressions to analyze the empirical association between a country’s pre-industrial distance to the western technological frontier, the square of this distance and a country’s technological sophistication in 1500CE. Column (1) shows the unconditional relation between the distance to the western technological frontier in the Old World and technological sophistication. In particular, the estimated Least Desirable Distance (LDD) is statistically and economically significant, and is located at 8.3 weeks. The estimates suggest that an economy located 1-standard deviation (SD) away from the LDD has a technological sophistication 19% higher than at the LDD.
Column (2) accounts for the confounding effect of a country’s geographical characteristics. In particular, it accounts for a country’s latitude and its square, pre-1500CE caloric suitability, percentage of land area in tropics and subtropics, mean elevation above sea level, land area, malaria burden, and dummies for being landlocked or an island. Reassuringly, the estimated LDD remains statistically and
economically significant. The estimated location of the LDD is 5.4 weeks and implies that an economy
located 1-SD away from the LDD has a technological sophistication 44% higher than at the LDD. Columns (3) and (4) consider the confounding effects of the advent of sedentary agriculture and of unobserved time-invariant omitted variables at the continental level on technological sophistication across countries. In particular, column (3) accounts for the years elapsed since the a country expe-rienced the onset of the Neolithic Revolution, which previous research has suggested had a positive impact on its economic development (Diamond, 1997). Additionally, column (4) accounts for
continen-16The analysis includes the largest set of countries in the Old World for which all the data in the most general
specification being studied is available. Appendix B contains the descriptive statistics for all the samples and variables used in the analysis.
17Appendix E explores the performance of this empirical specification using Monte Carlo simulations. In particular,
it explores whether the null-hypothesis that β2j= 0 for all frontiersj is rejected in favor of the alternative hypothesis
that β2j 6= 0 for some frontierj and its LDDj is finite and smaller than the sample maximum. In these simulations
the null-hypothesis was not rejected whenever it was assumed that the null-hypothesis was true. On the contrary, the null hypothesis was only rejected if the alternative hypothesis was assumed to hold. Moreover, even when the alternative hypothesis was true, the null-hypothesis was not always rejected. These findings suggest that rejection of the null-hypothesis in this specification provides strong support for the proposed theory.
18These measures were constructed independently of historical or contemporaneous income levels, covering a wide
Table 1: Distance from the Pre-industrial Frontier and Technological Sophistication in 1500 CE
Technological Sophistication in 1500CE
Unadjusted Migration Adjusted (1) (2) (3) (4) (5) (6) (7) (8) Pre-industrial distance to NLD -0.15*** -0.10*** -0.10*** -0.10*** -0.13*** -0.13*** -0.13*** -0.13***
(0.02) (0.03) (0.03) (0.03) (0.03) (0.03) (0.03) (0.03) Sq. Pre-industrial distance to NLD 0.01*** 0.01*** 0.01*** 0.01** 0.01*** 0.01*** 0.01*** 0.01***
(0.00) (0.00) (0.00) (0.00) (0.00) (0.00) (0.00) (0.00) Pre-industrial distance to CHN -0.03*** -0.04 -0.03*** -0.04
(0.01) (0.04) (0.01) (0.04) Sq. Pre-industrial distance to CHN 0.00 0.00
(0.00) (0.00) LDD NLD 8.25*** 5.37*** 5.63*** 6.42*** 7.66*** 7.73*** 7.28*** 7.41***
(0.89) (0.50) (0.36) (1.25) (1.26) (1.62) (1.13) (1.52)
LDD CHN 124.61 61.21
(1456.00) (325.44) Geographical Controls No Yes Yes Yes Yes Yes Yes Yes Time Since Neolithic Revolution No No Yes Yes Yes Yes Yes Yes Continental FE No No No Yes Yes Yes Yes Yes AET 1.87 2.15 3.51 13.05 14.95 10.24 12.88
δ 1.35 1.37 1.26 1.08 1.07 1.10 1.08
β∗ 3.97 4.78 5.86 7.51 7.59 7.09 7.26
R2 0.48 0.83 0.87 0.88 0.89 0.89 0.89 0.89 Adjusted-R2 0.46 0.80 0.85 0.85 0.86 0.86 0.86 0.86
Observations 84 84 84 84 84 84 84 84
Notes: This table establishes the statistically and economically significant U-shaped relation between the distance to the frontier and technological sophistication in 1500CE across countries. Estimation by OLS. It additionally shows the Altonji et al. (2005) AET ratio as extended by Bellows and Miguel (2009). It also shows theδandβ∗(1,1) statistics suggested by Oster (2014). All statistics suggest that the results are not driven by unobservables. Pre-industrial distance to Netherlands/China is the minimum total travel time (in weeks) along the optimal path between a country’s capital and the Netherlands/China (see text for construction). Additional controls include latitude and latitude squared of the country’s capital, Pre-1500CE caloric suitability, percentage of land area in tropics and subtropics, mean elevation above sea level, land area, island and landlocked dummies, and malaria (falciparum) burden. Least desirable distance (LDD) is the number of weeks that minimizes the quadratic relation with respect to the pre-industrial distance. It is equal to−βDistance/(2·βSq.Distance). Heteroskedasticity
robust standard error estimates are reported in parentheses; *** denotes statistical significance at the 1% level, ** at the 5% level, and * at the 10% level, all for two-sided hypothesis tests.
tal fixed effects and therefore for any unobserved time-invariant omitted variable at the continental level. The estimated LDD remains statistically significant at the 1% and implies an economically significant effect of the distance to the technological frontier. In particular, after accounting for a country’s geography, the advent of the Neolithic Revolution, and continental fixed effects, the
es-timated LDD is 6.4 weeks and implies that an economy located 1-SD away from the LDD has a
technological sophistication 31% higher than at the LDD.
the estimated LDD at 7.3 weeks, which implies that an economy located 1-SD away from the LDD has a technological sophistication 24% higher than at the LDD.
Figure 6: Distance from the Pre-industrial Frontier and Technological Sophistication in 1500 CE
AGO BEN BFA BWA CAF CIV CMR DZA EGY ETH GAB GHA GIN GNB KEN LBR LBY LSO MAR MDG MLI MRT NAM NERNGA SDN SEN SLE TCD TUN TZA UGA ZAF ZAR ZMB ZWE AFG BGD CHN IDN IND IRN IRQ JPNKHM KOR LAO MMR MNG MYS NPL PAK PHL RUS SAU SYR THA UZB VNM AUT BEL BIH CHE CZE DEU DNK ESP FIN FRA GBR GRC HUN IRLITA LTU NLD NOR POL PRT ROM SWE TUR UKR YUG − .8 − .6 − .4 − .2 0
Technological Sophistication in 1500CE
0 5 10 15
Pre−industrial distance to the Netherlands
95% Conf. Int. Non−parametric Quadratic Fit
Africa Asia Europe
Pre−industrial Distance and Technological Sophistication in 1500CE
(a) Technological Sophistication (conditional association based on column 7 of Table 1)
(b) Growth valley based on column 7 of table 1. (c) Growth valley (interaction).