Simulating Surface-Mediated Self Assembly Patterns
by a Stabilized Fourier Spectral Method
Meie Li
1and Jinxiong Zhou
2;* 1School of Materials Science and Engineering, Xi’an Jiaotong University, Xi’an 710049, P. R. China 2MOE Key Laboratory of Strength and Vibration, School of Aerospace, Xi’an Jiaotong University, Xi’an 710049, P. R. China
Atoms on solid surfaces may self-assemble into ordered nanophases. The phase field method in combination with semi-implicit Fourier spectral method provides an ideal tool to simulate this dynamic process. The appearance of surface stress term in the evolving kinetic equations, however, may lead to divergence of simulation if standard spectral method is used. A stabilized scheme is proposed in this paper and a second-order approach is given to perform long time simulation with rather large time step. The scheme is used to simulate the self-assembly of binary epilayers with different average concentrations on a solid substrate. The results indicate that the self-assembly patterns are influenced by the average concentration, which agrees well with the experimental results. Based on the validated scheme, simulations of self-assembly guided by closed pre-patterns are performed. It is found that the closed pre-patterns can guide to form isolated closed loops after long time of evolution. This procedure provides a possible strategy to fabricate microelectronic devices and circuits. [doi:10.2320/matertrans.MRA2008142]
(Received April 25, 2008; Accepted June 13, 2008; Published August 25, 2008)
Keywords: self-assembly, Fourier spectral method, phase field method, domain pattern, surface stress
1. Introduction
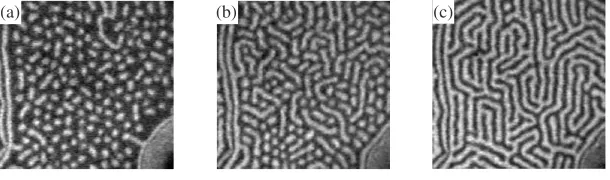
Atoms on solid surfaces are not peaceful objects and may separate into phases with different modulated compositions. The separated phases on surface may stabilize at a nanometer scale which presents a striking contrast to the continuous coarsening process in bulk materials. Self-assembly of nanophases on solid surfaces has been observed and verified by many experimental results. Pohlet al.1)observed ordered patterns of S rich dots in a continuous Ag matrix. Plasset al.2) obtained a sequence of domain patterns on Cu(111) surface by deposition of Pb vapour and changing the concentration of Pb atoms. The results indicate that with the variation of the average concentration, the self-assembled nanoscale patterns change from droplets to stripes (Fig. 1), but the feature size does not change as much. Venezuelaet al.3)reported the self-organized growth of alloy superlattices during crystal growth of an alloy, as consequence of modulated strain field at surface step sites. Springholz et al.4)used molecular beam epitaxy technique to obtain self-organized growth of three-dimensional PbSe quantum dot crystals. By changing the superlattice period, the lattice constant of the dot crystal can be tuned continuously. Grom et al.5) reported the self-organization of Si nanocrystals larger than 8 nm into brick-shaped crystallites oriented along theh111icrystallographic direction. Whitesides and Grzybowski6)summarized the self-assembling processes with feature sizes from the molecular to the planetary scale and are common throughout nature and technology.
Besides these significant experimental observations, the past several years have also seen the progress in the theoretical and numerical approaches which can simulate various self-assembly phenomena and predict some possible undiscovered patterns. Alerhand et al.7) proposed a model to analyze the spontaneous formation of stress domains on
crystal surfaces. Their model reveals that surface stress anisotropy and domain wall energy lead to the spontaneous formation of stress domains. Suo and his co-workers8–15) made excellent pioneer research on the use of phase field method to simulate the self-assembly on solid surfaces. Lu and Suo8–12) proposed a phase field model to simulate the self-assembly in a binary epilayer on solid surfaces. They identified that the phase boundary energy drives phase coarsening while the concentration-dependent surface stress is responsible for phase refining. They studied the influence of surface stress anisotropy and the elastic anisotropy of substrate on the dynamics of self-assembly. Gao and Suo13–15) modeled the domain dynamics in a ferroelastic epilayer and the guided self-assembly of molecular dipoles on elastic substrate. Recently, Lu et al.16,17) developed the phase field model to simulate the pattern formation in multilayers and to incorporate the influence of applied elastic field. Suo and Hong18)also developed a model to simulate the reconfigurable molecular patterning and programmable mo-lecular cars.
For self-assembly of nanophases on solid surfaces, surface stress has been identified as a decisive factor for under-standing of the underlying mechanism of self-assembly. The appearance of surfaces stress term in the time-dependent phase field equation complicates not only the forms but also the computation and advancing of the evolution equation as compared with the classic solid phase transformation equation of bulk materials. Although solving the phase field equation by semi-implicit spectral method has been recog-nized as an efficient tool for simulation of a lot of solid phase transformation problems, addition of this surface term sometimes may even cause the divergence of the simulation if standard semi-implicit spectral method is used. A stabi-lized second-order scheme is proposed in this paper and is validated by comparing the simulated results with the experimental observations. The scheme is demonstrated to be reliable for long time self-assembly simulation with rather
*Corresponding author, E-mail: [email protected]
large time step. Simulations of self-assembly guided by closed pre-patterns are carried out by using the proposed method. These simulations not only demonstrate the reli-ability of the proposed approach, but also provide some interesting results, which are useful for fabricating of nano-structures as well as microelectronic devices or circuits.19)
2. Model of Nanophase Self-Assembly on Solid Surfaces
Let us consider a very thin binary epilayer lying on an elastic substrate. The substrate occupies the half space x3<0, bounded by the x1x2 plane occupied by the
epilayer. Following the way of Suo and Lu,8–12)the total free energy of the system can be expressed as
G¼
Z
WdVþ
Z
fmixðCÞ þ
1
2KjrCj
2þf
"
dA: ð1Þ
Here, summation is made over repeated indices and a Greek subscript runs from 1 to 2. The first body integral in (1) gives the system elastic energy andW is the elastic energy density per unit volume. The second integral extends over the surface area withinx1x2plane. The first term in the second integral
is the free energy density due to mixing, the second term gives the specific interfacial energy due to gradient of concentration, and K is the gradient coefficient. The third term incorporates the surface energy due to surface stress." is the surface strain and f is the surface stress. A linear relationship between the surface stress and concentration is assumed,8–12)i.e.,f
¼ þC, where andare
material constants. The free energy density of mixing is given by the following expression for a regular solution of two components
fmixðCÞ
¼kBT½ClnCþ ð1CÞlnð1CÞ þCð1CÞ
ð2Þ
C is the concentration of one specific species, T is the absolute temperature andkBis the Boltzmann constant.
The linear phenomenological law relates the atomic flux linearly to the gradient of chemical potential and is expressed as
J¼ MrG
C ð3Þ
whereMis the mobility of atoms and taken as a constant for the simplest isotropic case. The continuity of mass dictates that
@C
@t ¼ r J: ð4Þ
Taking the functional derivative of the total free energy with respect to Cand substituting the functional derivatives into (3) and (4) yield the following phase field equation
@C
@t ¼Mr
2 @fmix
@C Kr
2Cþ
"
ð5Þ
and the following equilibrium equation in the bulk (a Latin subscript runs from 1 to 3)
ij;j¼0 ð6Þ
and the associated boundary conditions on the surface
3¼f;; 33¼0: ð7Þ
Note that eq. (5) differs from the classic phase field equation for solid phase transformation of bulk materials only in the way elasticity is introduced. The third term due to surface stress in eq. (5) is linear in the surface strain tensor, while for bulk material the elasticity term is always quadratic in the strain tensor.
Equation (5) is normalized and solved in the dimension-less form. To do that a length scale and a time scale are defined to normalize the equation. Following Luet al.8–12)the length scale is defined as
l¼ EK
ð1v2Þ
ð8Þ
where E is the Young’s modulus of a solid substrate with value of about E1011N/m2, which is a typical value for silicon or copper substrate. The slope of the surface stress is on the order 4N/m, and the order of K1019J. These evaluations give an estimation of a length scale l0:6nm and the equilibrium phase size of 4l.8–12) The estimation is agreed well with the experimental observations on solid surfaces. Similarly the time scale is defined as
¼ K
MðkBTÞ2
: ð9Þ
The length scale and the time scale l and are utilized to normalize the original eq. (5) and the normalized equation is solved to simulate and interpret the self assembly patterns.
3. Stabilized Fourier Spectral Method for Self-Assem-bly Simulation
In general eq. (5) should be solved in combination with the equilibrium equation, eq. (6) and the boundary conditions (7). If the thickness of the epilayer is much smaller than that of the substrate, the analytical solution of the equilibrium eq. (6) and the boundary conditions (7) is given by the
so-(a) (b) (c)
[image:2.595.146.451.74.164.2]called Cerruti solution and only equation eq. (5) is need to be solved and evolved.
The normalized version of eq. (5) can be solved efficiently by the semi-implicit Fourier spectral method20)in reciprocal space10–12)
@CC^
@t ¼ k
2PP^ðCÞ 2ðk4QsÞCC^ ð10Þ
in whichffiffiffiffiffiffiffiffiffiffiffiffiffiffiffik¼ ðk1;k2Þ is a vector in reciprocal space, k¼
k2
1þk22
p
is the magnitude of k, Q is a dimensionless parameter, and CC^ and PP^ðCÞ represent the Fourier trans-formations of CandPðCÞ ¼@fmixðCÞ=@C. Thesin eq. (10) comes from the Fourier transformation of surface stress and is given by10–12)
s¼k
2
1ðk
2k2
1Þ þk
2
2ðk
2k2
2Þr
22k2
1k
2
2r
ð1Þk ð11Þ
where r¼22=11 defines the degree of surface stress
anisotropy andis the Poisson’s ratio of the material. If only isotropic surface stress is considered, r¼1 and s¼k3. Application of standard semi-implicit spectral method to eq. (10) reads
^
C
Cnþ1CC^n
t ¼ k
2PP^n2ðk4QsÞCC^nþ1: ð12Þ
Our numerical experiments found that the above standard first-order scheme sometimes may cause divergence of Fourier spectral method and the computation would become unstable after a specific duration of time no matter how small time step was used. Following Xu and Tang,21) we add a stabilization term and adopt a second-order time discretiza-tion scheme, and eventually present an improved algorithm as follows
3 ^CCnþ14 ^CCnþCC^n1
2t þAk
2CC^nþ1
¼ k2PP^0n2k4CC^nþ1Ak2CC^n1þ2Qsð2 ^CCnCC^n1Þ ð13Þ
whereAis a positive constant in the range of 0.5 to 1,P0n¼ PðCnÞ 2ACn andPP^0n is the Fourier transformation of P0n. Equation (13) gives the following recursion scheme
^
C
Cnþ1¼ð4þ8tQsÞ ^
C
Cn ð1þ2tAk2þ4tQsÞCC^n1
3þ2tAk2þ4tk4 :
ð14Þ
Note that eq. (13) is a second-order strategy in the sense of time discretization. Our numerical results show later that the method processes better stability properties. Similar stabili-zation procedures were also used by Zhuet al.22)for
variable-mobility coarsening kinetics simulation and the approach was presented by Xu and Tang21) for large time-stepping simulation of molecular beam epitaxy growth. Rigorous mathematical proof and stability analysis of this class of stabilization schemes can be found in.21)
4. Results and Discussion
4.1 Self-assembled patterns in epilayers with different average concentrations
In order to validate the correctness and particularly the numerical stability of the proposed scheme for self-assembly simulation, self-assembly in epilayers with different average concentrations on a solid substrate are simulated based on the proposed method. The parameters used for simulation are as follows: the computational domain is of size 256256 in reduced units; dimensionless time stept¼0:4; the param-eter Q¼1; the stabilization factor A¼0:8; ¼2:2. Periodic boundary conditions are prescribed at the domain boundaries. Initially the epilayer has a uniform concentration distribution, and the concentration at each lattice site deviates from the average value within 0.001 only by random fluctuations.
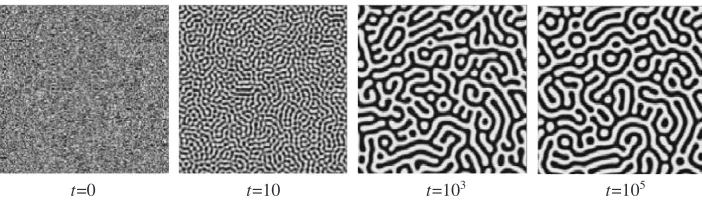
Figure 2 shows the evolution sequence with the average concentration 0.5. The gray levels represent the local concentrations. The lighter regions correspond to higher concentrations and the darker regions correspond to lower concentrations. Shortly after the quench, the system separates into two phases, which form interconnected serpentine stripes. In contrast to the continuing coarsening in spinodal decomposition of a bulk alloy, the feature size in self-assembly, width of the stripes in this case, stabilizes very quickly. From t¼103 to t¼105, the width of the stripes almost keeps invariant. The size stabilization can be attributed to the competition between the coarsening effect of the phase interface energy and the refining effect of the surface stress, which has been extensively described by Lu and Suo.8–12)At the late stage the system evolves to order over a long time period. Because the anisotropy is not included in the simulation, the pattern obtained is slightly different from the experimental result in Fig. 1(c).
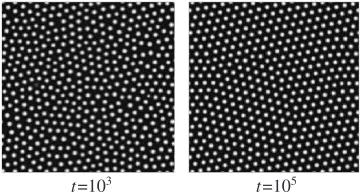
Figures 3 and 4 show the pattern evolution sequences with the average concentration 0.3 and 0.46, respectively. The results in the early stage are omitted. In Fig. 3 the morphology consists of second-phase droplets(dots) dis-persed in the matrix phase, similar to the pattern in Fig. 1(a). Att¼103, the dots nearly acquire the equilibrium size and form triangular lattice. In the late stage, the dots tend to
t=0 t=10 t=103 t=105
[image:3.595.121.472.71.173.2]rearrange themselves to form a superlattice, i.e., long range order (see t¼105). In Fig. 4 the morphology consists of a
mixture of dots and short stripes, resembling the experimen-tal observation in Fig. 1(b).
The simulation results indicate that with the decrease of concentration the self-assembly patterns change from ser-pentine stripes, to mixture of dots and short stripes, and then to dots within the matrix. It agrees well with the experimental observations. In fact, there is a diverse medley of possible two-phased microstructures. The scenarios are affected by a variety of factors including interface energies, diffusion rates, volume fractions of the two phases, and anisotropy, etc. In our simulations we keep all other parameters pinned and only vary the average concentration. With the average concen-tration changing from 0.5 to 0.3, the area fraction of the second phase decreases. For a two-phased microstructure in bulk materials, it is verified mathematically that when the volume fraction of one phase is lower than 1=, the total interface area and therefore the total phase interface energy is smaller for this phase to be fibres than to be laminae, so that there is a tendency to form fibre-shaped phases. One can generalize the above conclusion to interpret our simulation results of surface-mediated patterns. If the second phase is dispersed in the mother phase with a small area fraction, the second phase prefers to form dots or a mixture of dots and
short stripes. In the case of high area fraction of both phases (0:5), on the other hand, serpentine stripes are obtained due to the symmetry of the system.
4.2 Guided self-assembly patterns
The validated scheme is used to simulate the guided self-assembly by initial concentration pre-patterns with closed shapes. Figure 5 shows the temporal evolution of self-assembly guided by a circle of radius 64. The pre-patterns was obtained by pre-setting the initial concentration of the circumference of the circle, 0.51, which in this case is a little bit higher than the average concentration 0.5. Other con-ditions are the same as those of the sequence in Fig. 2. The pre-patterned circle behaves just as a guide. It guides the surrounding phases to form closed rings or loops. In the intermediate stage, the width of the rings approaches to the equilibrium size. In the late stage, the system tend to order spacially.
The second example of guided self-assembly is induced by a triangle and the initial conditions are the same as the first example (Fig. 6). In the early stage the pre-patterned triangle guide the nearby regions to form self-similar triangles. But in the late stage the triangles gradually evolve to approximative circles, which indicate that the latter has lower energy.
t=103 t=105
Fig. 3 Evolution of self-assembly patterns with average concentration 0.3.
t=103 t=105
Fig. 4 Evolution of self-assembly patterns with average concentration 0.46.
t=0 t=102 t=103 t=105
Fig. 5 Self-assembly patterns guided by a pre-pattern of closed circle.
t=0 t=102 t=103 t=105
[image:4.595.336.520.72.172.2] [image:4.595.78.259.73.171.2] [image:4.595.122.478.348.451.2]From Figs. 5 and 6 it is observed that the pre-patterns can produce resembling patterns during the early stage of evolution and that closed pre-patterns can guide to form isolated closed shapes after a long time of ordering. This is of great importance for fabricating microelectronic devices and circuits, in which nanoscale interconnections or closed circuits are needed.19) Through guided self-assembly by pre-patterns, therefore, the simulation results show light on a possible strategy for fabricating small scale electric circuits.
5. Conclusion
A stabilized Fourier spectral method is proposed to simulate the self-assembly of atoms on solid surfaces. A rather large time step can be used and the proposed procedure maintain good numerical stability. The self-assembly pattern evolution in epilayers with different average concentrations on a solid substrate are simulated based on the proposed scheme. The results indicate that with the decrease of concentration the patterns change from serpentine stripes, to mixture of dots and short stripes, and then to dots within the matrix. It agrees qualitatively with the experimental obser-vations.
Self-assembly guided by initial coarse scale pre-patterns of concentration distribution is modeled by the validated scheme. The pre-patterns of closed shapes such as circles and triangles will guide the self-assembly and produce a number of distinctly isolated closed loops after long time evolution. Since self-assembly is one of the novel routines to fabricate nanostructures in a ‘‘from bottom to top’’ manner. Our numerical results indicate that nanoscale closed loops such as circuits or wires may be fabricated spontaneously by the self-assembly guided by initial coarse scale pre-patterns. This result may provide useful suggestions for nanostructure fabrication as well as nanoprinting. Furthermore, measures which can control the self-assembly process and yield the desirable patterns and programmable self-assembly are awaiting exploration.
Acknowledgements
This research is supported by the National Natural Science Foundation of China under grant number 10572112, Natural Science Foundation of Shaanxi province through grant No. 2006A01, Program for New Century Excellent Talents in University (NCET-06-0850), and National Basic Research Program of China under grant number 2006CB601202. These financial supports are gratefully acknowledged.
REFERENCES
1) K. Pohl, M. C. Bartelt, J. Figuera, N. C. Bartelt, J. Hrbek and R. Q. Hwang: Nature397(1999) 238–241.
2) R. Plass, J. A. Last, N. C. Bartelt and G. L. Kellogg: Nature412(2001) 875–875.
3) P. Venezuela, J. Tersoff, J. A. Floro, E. Chason, D. M. Follstaedt, F. Liu and M. G. Lagally: Nature397(1999) 678–681.
4) G. Springholz, V. Holy, M. Pinczolits and G. Bauer: Science 282 (1998) 734–737.
5) G. F. Grom, D. J. Lockwood, J. P. McCaffrey, H. J. Labbe, P. M. Fauchet, B. White Jr., J. Diener, D. Kovalev, F. Koch and L. Tsybeskov: Nature407(2000) 358–361.
6) G. M. Whitesides and B. Grzybowski: Science295(2002) 2418–2421. 7) O. L. Alerhand, D. Vanderbilt, R. D. Meade and J. D. Joannopoulos:
Phys. Rev. Lett.61(1998) 1973–1976.
8) Z. Suo and W. Lu: J. Mech. Phys. Solids48(2000) 211–232. 9) Z. Suo and W. Lu: J. Nanopart. Res.2(2000) 333–344. 10) W. Lu and Z. Suo: J. Mech. Phys. Solids49(2001) 1937–1950. 11) W. Lu and Z. Suo: Phys. Rev. Lett.65(2002) 085401-9. 12) W. Lu and Z. Suo: Phys. Rev. Lett.65(2002) 205418-7. 13) Y. F. Gao, W. Lu and Z. Suo: Acta Mater.50(2002) 2297–2308. 14) Y. F. Gao and Z. Suo: J. Appl. Mech. ASME69(2002) 419–424. 15) Y. F. Gao and Z. Suo: J. Appl. Phys.93(2003) 173–209. 16) W. Lu and D. Kim: Acta Mater.53(2005) 3689–3694. 17) W. Lu and D. Salac: Phys. Rev. Lett.94(2005) 146103-4.
18) Z. Suo and W. Hong: Proc. Nat. Acad. Sci. (PNAS 101, 2004) pp. 7874– 7879.
19) D. H. Gracias, J. Tien, T. L. Breen, H. Hsu and G. M. Whitesides: Science289(2000) 1170–1172.
20) L. Q. Chen and J. Shen: Comput. Phys. Commu.108(1998) 147–158. 21) C. J. Xu and T. Tang: SIAM J. Numer. Analy.44(2006) 1759–1779. 22) J. Z. Zhu, L. Q. Chen, J. Shen and V. Tikare: Phys. Rev. E60(1999)