Application of Diffraction-Amalgamated Grain Boundary Tracking
to Fatigue Crack Propagation Behavior in High Strength Aluminum Alloy
Hui Li
1,+, Hiroyuki Toda
2, Kentaro Uesugi
3, Akihisa Takeuchi
3,
Yoshio Suzuki
3and Masakazu Kobayashi
11Department of Mechanical Engineering, Toyohashi University of Technology, Toyohashi 441-8580, Japan 2Department of Mechanical Engineering, Kyushu University, Fukuoka 819-0395, Japan
3Japan Synchrotron Radiation Research Institute (JASRI), Hyogo 679-5198, Japan
Fatigue crack propagation behavior in a 7075-type Al alloy (Al-5.6%Zn-2.5%Mg-1.6%Cu) was investigated by applying Diffraction-Amalgamated Grain Boundary Tracking (DAGT), which provides grain morphologies and crystallographic orientations in three dimensions (3D). 3D crack morphologies at different propagation stages in the bulk of the sample were successfully obtained using synchrotron radiation X-ray microtomography (SRCT) technique. The apparent crack growth rate, da/dN, which varies significantly along a crack front line, was calculated. There are rapid acceleration and deceleration regions of da/dNdue to the interaction with grain boundary (GB) and crack closure segments. Typical crack morphology under the influence of Mode II (in-plane shear) and Mode III (out-of-plane shear), such as crack deflection and twist, is detected by the observation of 2D tomographic slice image. A detailed direct assessment of microstructure-crack interaction behaviors has been achieved by applying the DAGT technique. [doi:10.2320/matertrans.M2014340]
(Received September 26, 2014; Accepted December 22, 2014; Published February 25, 2015)
Keywords: fatigue crack, synchrotron radiation, X-ray diffraction, grain boundary tracking, grain orientation, aluminum
1. Introduction
Fatigue crack growth diagram that is described by log-log plot of da/dN versus ¦k indicates sigmoidal curve that contains three distinct regions.1)The linear part of the fatigue
crack growth diagram named Region II has become widely known as the Paris Law that is found to be divided into Regions IIa and IIb in detail. In Region IIb, the fatigue crack growth rate depends only on the stress intensity factor (¦k). It is relatively independent to the microstructure and propagating fatigue cracks often produce striations on the fracture surface. Recent process in the high resolution synchrotron radiation microtomography (SRCT)2)technique has been utilized on the in situ visualization of three-dimensional (3D) fatigue crack propagation behavior to 1 micron level during tension or heat-treatment in bulk of material. Thanks to the development of the high resolution SRCT technique, some advanced application techniques have been developed. For instance, Toda et al.3) has exploded a
new procedure, grain boundary tracking (GBT), in order for determining 3D GB geometry by tracking the particles within grain and/or GB and the variation under external loading for evaluating crystallographic deformation behav-iors of each individual grain in polycrystalline materials. By adding pencil-beam X-ray diffraction (XRD) measure-ment, Diffraction-Amalgamating Grain Boundary Tracking (DAGT),4)which provides accurate information about grain morphologies and individual grain orientation in four-dimensions (4D), has been developed. Khoret al.5,6)utilized the electron backscattering diffraction (EBSD) assessment combination with CT for the study of crack closure processes associated with crystallographically rough long crack path in commercial airframe aluminum alloy 2024-T351. The results
revealed that the fatigue crack appears crystallographic deflections and the region of crack closure associated with a specific orientated ridge.
This paper presents a first attempt to investigate the 3D in situ propagation of a long fatigue crack within a polycrystalline aggregate (3D grain morphologies and crystallographic orientations) by using DAGT technique in a practical aluminum alloy. Through this synthesis of techniques, a direct assessment of underlying crystallo-graphic microstructure and fatigue crack propagation behav-iors has been achieved.
2. Experimental Procedures
2.1 Material and specimen preparation
The material used in this work was a 7075-type Al alloy (Al-5.6%Zn-2.5%Mg-1.6%Cu). Hot rolled plate of Al alloy was solution heat-treated at 773 K for 36 ks followed by cold water quenching and artificial aging at 453 K for 108 ks (i.e. T7 temper). A three-point bending (TPB) specimen was machined obliquely at about 45° along the rolling direction from the plate. A notch with a radius of 0.45 mm was introduced to allow easy precracking. After that, a small match-like parallelepiped specimen (a cross-section of 0.6 mm©0.6 mm) containing a fatigue crack tip was machined from the TPB specimen, and aluminum tabs were glued to the two ends of the small specimen for the subsequentin situloading with a testing machine.7)
2.2 In situfatigue testing
Anin situfatigue test was carried out with a stress ratioR
of 0.1. During fatigue cycling, the maximum and minimum loads were 50 N and 5 N, respectively. Once a crack extension was detected, cyclic loading was stopped at 2,000 and 3,000 cycles and tomographic scans were performed. After the fatigue test, the following gallium
+Graduate Student, Toyohashi University of Technology. Corresponding
author, E-mail: [email protected]
wetting procedure was adopted for the visualization of GBs.8)
Another tomographic scan for the 3000-cycled sample was then started immediately after the gallium application.
2.3 Diffraction-amalgamated grain boundary tracking
(DAGT)
Diffraction-Amalgamated Grain Boundary Track (DAGT), amalgamates the X-ray diffraction (XRD) experiment with grain boundary tracking (GBT).3) The GBT technique combines the X-ray microtomography (CT) and the gal-lium-enhanced GB visualization technique. With the CT technique, it is possible to observe particles and precipitates inside a material. These particles were used for accurate reconstruction of grain morphologies. In order to distinguish a grain or GB at which each particle is located, the gallium wetting is carried out to accurately portray GBs. Despite the obvious advantage of the GBT technique, it still cannot determine the crystallographic orientation of each grain. This can be accomplished by adding the pencil-beam XRD technique in the DAGT technique. For determining a grain from which each X-ray diffraction spot is produced, DAGT matches XRD spots with grains using geometrical relation-ship between how an X-ray pencil beam interacts with a grain. Therefore, it provides crystallographic information of individual grain in bulk of sample.
3. Results and Discussion
3.1 Observation of fatigue crack propagation behavior
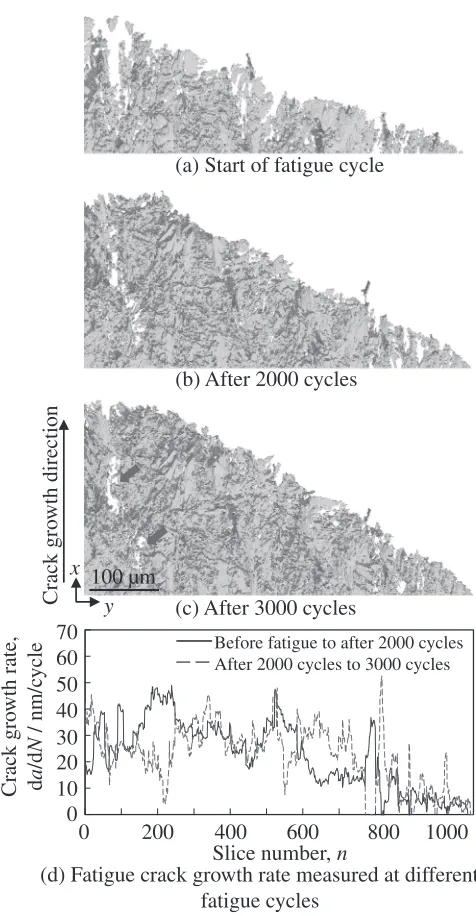
Rendered fatigue cracks, which have been extracted from the 3D reconstructed volumes captured at the three loading steps, were projected onto a plane perpendicular to the loading axis, as shown in Fig. 1(a)(c). It can be seen that the crack front line is not straight along the crack front line. Additionally, several areas where the background color (white) can be seen near the crack front line and specimen surface indicate the existence of crack closure in the crack wake. Some small patches that were scattered near the crack tip is attributable to the plasticity-induced crack closure; while the two relatively large patches on the left hand side of Fig. 1(c), running parallel to the crack growth direction, is attributable to the roughness-induced crack closure due to the effects of fracture surface ridges along elongated crystallo-graphic grains.
To provide quantitative information on crack growth, apparent crack growth rate, da/dN, was measured as shown in Fig. 1(d). Note that the crack growth rate varies significantly along the crack front line. At slice positions 220 and 770, acceleration and subsequent deceleration of crack growth occurred during the fatigue loading between 0 and 2,000 cycles and between 2,000 and 3,000 cycles respectively. The significant acceleration at slice position 770 occurred when the crack passed through the pore. At slice position 250500, the fatigue crack propagation is relatively stable probably due to the lack of any significant features such as crack closure and pores.
Figure 2(a) shows the fatigue crack growth profiles of the three number of fatigue cycles superimposed together with GBs (black lines) projected on the x-y plane. The crack growth rates measured at different stages of fatigue cycling
were also shown in Fig. 2(b)(c). Note that rapid acceleration and deceleration in da/dN existed due to the effects of the crack closure, e.g. at slice position 820. However, the effect of GB on the crack growth rate is not so obvious in Fig. 2(b) and (c).
After determining crystallographic orientation of each grain, Euler angle of each individual grain was plotted on [101] projection which corresponds to the rolling direction (RD) as shown in Fig. 3. The data points inside the inverse polefigure represent the orientations of grains. It can be seen that the crystallographic orientations are clustered near the [111] plane that is parallel to RD. It is suggested that the texture in this sample mainly consists of the copper-type texture{112}©111ª. In addition, there are also several grains with random crystallographic orientations which are rela-tively closed to either [001]-pole or [011]-pole.
100 µm
Crack gro
wth direction
y
x
(a) Start of fatigue cycle
(b) After 2000 cycles
(c) After 3000 cycles
Crack gro
wth rate,
d
a
/d
N
/ nm/c
ycle
0
200
400
600
800
1000
Slice number,
n
Before fatigue to after 2000 cycles After 2000 cycles to 3000 cycles
0
10
20
40
50
60
70
30
(d) Fatigue crack growth rate measured at different
fatigue cycles
[image:2.595.308.546.64.522.2]3.2 Effects of crystallographic microstructure on crack propagation behavior
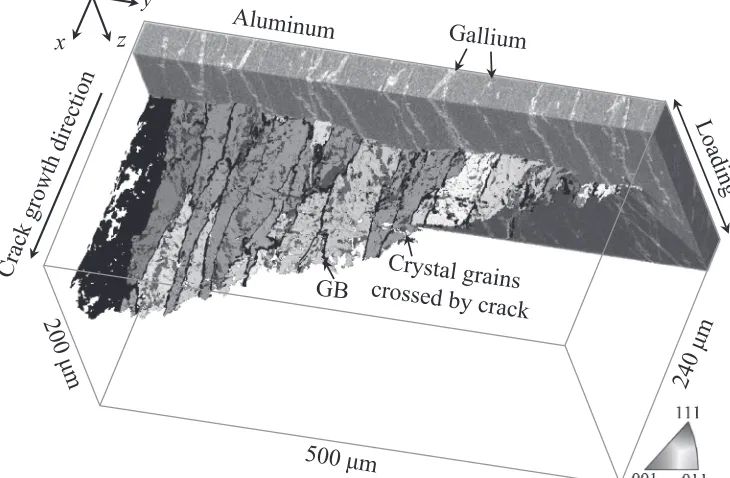
Figure 4 shows the 3D rendering of the 7075 aluminum alloy, in which GBs are decorated by gallium and the crack surface divided with crystallographic grains at 3,000 cycles. Most of the aluminum matrix has been removed in order to visualize the fatigue crack. Pancake-like crystallographic
grains intersected by the crack are observed which have been formed during the rolling process. Black lines on the crack surface image indicate GBs. The colors of the crack surface represent the orientation of sample plane (001) (perpendicular to the LD) in the crystallographic system as defined in the stereographic triangle. It can be seen that the crack morphology in 3D is more complex than the projection in 2D image. A large black region shown on the crack surface indicates the region where valid grain orientation measure-ment was not possible due to the sample surface damaged by liquid gallium. One can see that reddish segments of the crack on the left hand side are nearly parallel to the (001) plane. In addition, the crack is also oriented closed to (011) or some high-index planes. On the right hand side, the crack surface is mainly parallel to (011) plane. The effects of crystallographic orientations on crack morphology are not obvious in thisfigure and will be examined afterwards.
Crack gro
wth rate,
d
a
/d
N
/ nm/c
ycle
Crack gro
wth direction
0 cycle 2,000 cycles 3,000 cycles
(b) 0-2000 cycles
Inside grain Affected by GB Affected by closure
(c) 2000-3000 cycles
(a)
0 20 40 60
0 20 40 60
Slice number, n
1000 800
600 400
200 0
50 µm x
y
Fig. 2 (a) Fatigue crack growth profiles superimposed with grain boundaries (black lines) projected on thex-yplane. Fatigue crack growth rates measured at the different stages of cyclic loading between (b) 0 cycle and 2,000 cycles and between (c) 2,000 cycles and 3,000 cycles. The effects of grain boundaries and crack closure are indicated in (b) and (c).
[101] Inverse pole figure (RD)
001 011
111
Fig. 3 Inverse polefigure along the rolling direction showing the measured orientations of individual grains located in thefield of view.
[image:3.595.51.290.177.456.2] [image:3.595.316.536.302.485.2] [image:3.595.115.480.527.766.2]2D crystallographic grain distribution images in the x-z plane are shown in Fig. 5(a). Figure 5(a) illustrates the fatigue crack propagation behavior that cracks are deflected when they encountered GBs. The crack path from left to right remains macroscopically in Mode I (crack opening) together with small amount of deflection. Position a in Fig. 5(a) shows that the crack propagates without being affected by the GB keeping theflat crack path perpendicular to the LD (z-axis). On the other hand, positions b, d, f, g and h, show the crack deflection occurred at the GBs. Note that at position g, deflection occurred so that two overlapping crack segments are connected in an underlying volume. The cracks propagating along GB with large deflection angle were shown at positions c and e.
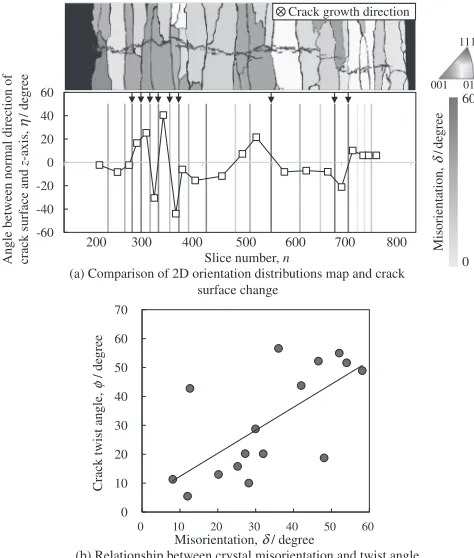
To quantify how the GBs, characterized by their GB misorientation angle, ¤, affect the propagation of the crack, both the crack-deflection angle, ª, and twist angle, ¤, were determined. Average crack-deflection angles are measured as difference in angle between the normal direction of a 3D crack surface in each individual grain before and after impingement at a GB. In addition, the twist angle is defined as an angle between the intersections of two crack planes between two adjacent grains as shown in Fig. 6(a). The GB misorientation angle was calculated based on the Euler angle of each grain. Experimentally measured variations in average crack-deflection angle (ª) at GBs with the GB misorientation angle (¤) is shown in Fig. 5(b). The letters near the data points correspond to the crack deflection points in Fig. 5(a). Although there is some scatter there seems to be a general
trend that higher crack-deflection angles are associated with GBs with large misorientation angles. The large deflection angles at the GBs might imply a higher resistance to crack growth across GBs.
Figure 6 illustrates the quantitative analysis of a 3D fatigue crack morphology. The top part of Fig. 6(a) shows the correlation between the fatigue crack surface and crystallo-graphic grains in terms of twisting angle. From the observation of Fig. 6(a), one can see a general agreement between a strong change in the crack surface and the presence of a GB at slice positions labeled by the black arrows. Although the data in Fig. 6(b) is scattered to a significant extent, the higher crack-twist angles are associated with GBs with large degrees of misorientation angle.
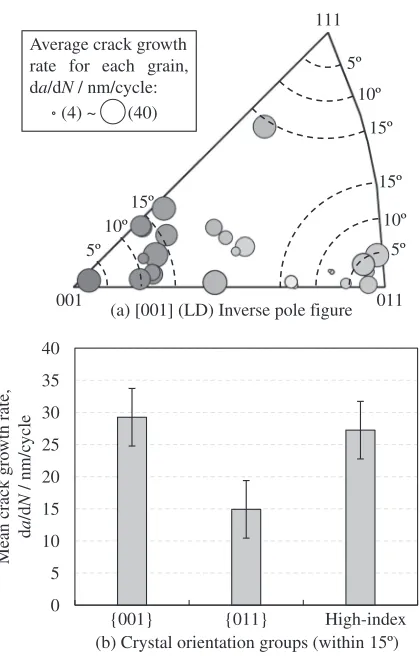
The average crack growth rate in all the 28 grains that have been intersected by the fatigue crack was experimen-tally measured between 0 and 3,000 cycles. The contour lines are drawn at 5° intervals in the [001] inverse pole
figure in Fig. 7(a). It suggests that cracking plane is parallel to{001}, {011} plane (within 15°) or the other high-index planes. Figure 7(b) shows that mean crack growth rate. The crack growth rate is averaged in each individual grains. It is seen that when the {001}-type plane is parallel to the crack plane, the crack tends to be propagated faster than the other planes. The crack growth rate is least when the {011}-type plane is parallel to the crack plane. In this way, some effects of crystallographic orientation on crack growth rate is observed. 50 µm (1) (2) (3) (4) (5) (6) (7) (8)
(a) Grain orientations distribution superimposed with the crack path
a b c e f h d g e c b d g a h f
Crack deflection angle,
θ
/ de
gree
Misorientation, δ/ degree 20 30 40 50 60 70 10 10
0 20 30 40 50 60
(b) Relationship between crystallographic misorientation and deflection angle z
x y
0
Fig. 5 (a) Grain orientations distribution map superimposed with the fatigue crack path. Rough crack morphology, crack deflection at grain boundaries are seen. (b) Experimentally measured variation in average crack-deflection angle as a function of misorientation angle between neighboring grains. -60 -40 -20 0 20 40 60
200 300 400 500 600 700 800
Slice number, n Misorientation,
δ
/d
egree
0 60
Angle between normal direction of crack surf
ace and z -axis, η / de gree
(b) Relationship between crystal misorientation and twist angle
Misorientation,δ/ degree
Crack twist angle,
φ / de gree 0 10 20 30 40 50 60 70
0 10 20 30 40 50 60 (a) Comparison of 2D orientation distributions map and crack
surface change
001 011
111
Crack growth direction
[image:4.595.50.289.67.346.2] [image:4.595.307.544.70.349.2]4. Conclusions
In this work, a direct assessment of microstructure-crack interaction behaviors in Region IIb has been achieved by applying the DAGT technique. It was found that the fatigue crack is strongly influenced by the crystallographic micro-structure. Local deflection in the crack growth direction under the influence of Mode II (in-plane shear) and twist in the
width direction under the influence of Mode III (out-of-plane shear) were observed. It was also observed that the crack is propagated along GB with large misorientation angle. Depending on the experimentally measured deflection and twist angles with the crystallographic misorientation, higher crack-deflection and twist angles tend to be associated with GBs with large degrees of misorientation. There is rapid acceleration and deceleration in crack growth rate due to the interaction with GBs and to the presence of crack closure. When the{001}-type plane is parallel to the crack plane, the crack is propagated faster than the other planes. Overall, it has been confirmed that the fatigue crack is affected in its morphology and crack growth rate due to the underlying crystallographic microstructural even in the Region IIb fatigue crack growth, which has been assumed to be independent of microstructure.
Acknowledgments
The synchrotron radiation experiment was performed at SPring-8 with the approval of JASRI through proposal number: 2013B1027. This work was undertaken with the support of a Grant-in-Aid for Scientific Research (A) from JSPS, through Subject No. 20760466.
REFERENCES
1) T. L. Anderson:Fracture Mechanics Fundamental and Applications, 3rd Edition, (Boca Raton (FL): CRC Press, 2011) pp. 451456.
2) H. Zhang, H. Toda, P. C. Qu, Y. Sakaguchi, M. Kobayashi, K. Uesugi and Y. Suzuki:Acta Mater.57(2009) 32873300.
3) H. Toda, Y. Ohkawa, T. Kamiko, T. Naganuma, K. Uesugi, A. Takeuchi, Y. Suzuki and M. Kobayashi:Acta Mater.61(2013) 55355548. 4) D. J. LeClere, T. Kamiko, Y. Mizuseki, Y. Suzuki, A. Takeuchi, K.
Uesugi, M. Kobayashi and H. Toda: Proc. 13th Int. Conf. on Aluminum Alloys, ed. by H. Weiland, A. D. Rollett and W. A. Cassada, (The Minerals, Metals & Materials Society, 2012) pp. 914.
5) K. H. Khor, J. Y. Buffière, W. Ludwig, H. Toda, H. S. Ubhi, P. J. Gregson and I. Sinclair:J. Phys.: Condens. Matter16(2004) S3511 S3515.
6) K. H. Khor, J. Y. Buffière, W. Ludwig and I. Sinclair:Scr. Mater.55
(2006) 4750.
7) H. Toda, S. Yamamoto, M. Kobayashi, K. Uesugi and H. Zhang:Acta
Mater.56(2008) 60276039.
8) M. Kobayashi, H. Toda, K. Uesugi, T. Ohgaki, T. Kobayashi, Y. Takayama and B. G. Ahn:Philos. Mag.86(2006) 43514366.
0 5 10 15 20 25 30 35 40
(b) Crystal orientation groups (within 15º)
Mean crack gro
wth rate,
d
a
/d
N
/
nm/c
ycle
{001} {011} High-index
(a) [001] (LD) Inverse pole figure Average crack growth
rate for each grain, da/dN/ nm/cycle:
(4) ~ (40)
5º
10º
15º
5º 10º 15º
5º 10º
15º
001 011
111
[image:5.595.66.276.66.394.2]