Munich Personal RePEc Archive
Brexit concerns, UK and European
equities: A lose-lose scenario?
Bouoiyour, Jamal and Selmi, Refk
CATT, University of Pau, France, Tunis Business School, Tunisia
April 2016
Online at
https://mpra.ub.uni-muenchen.de/70519/
1
Brexit concerns, UK and European equities:
A lose-lose scenario?
Jamal BOUOIYOUR CATT, University of Pau, France E-mail: jamal.bouoiyour@univ-pau.fr
Refk SELMI
Tunis Business School, Tunisia E-mail: s.refk@yahoo.fr
Abstract: We assess whether the attention given to “Brexit” (via Google Trends and Twitter) exerts a significant influence on UK, German and French stock markets. While a large body
of work has proposed models for the conditional mean and variance of equity returns, this
research is undertaken towards modeling the full return distribution (quantile regression
approach), and decomposing the covariance into different spectral components (frequency
domain causality test). Despite an acute consciousness that it is difficult to quantify the costs of Brexit, on the basis of this article’ outcomes, we’re being told little of what happens with the growing support for Brexit. Whatever the methods and the internet proxies used, this study inconvertibly reveals that the severeness of Brexit’ impact was not uniform across the investigated equities. Germany and France (in this order) suffered heavier losses if the British
exit from Europe occurs, while UK experienced puny effect.
2
1.
Introduction
Nowadays talks on a possible “Brexit”1
focus the attention of media. While the issue
is of a paramount importance within the UK, a potential Brexit is also extremely substantial
for other states within Europe. When looking at outside UK, leaving the Europe (EU) is not
just one about is good or worse for UK; instead it appears a question of how such move could
change the EU policies. Most experts asserted that both the UK and the Europe would suffer
losses if the British exit from EU occurs. The analyses seem divergent and scenarios are
numerous. The lack of assuredness on what political and economic arrangement would pursue
a Brexit makes quantifying losses for each party very hard. Regardless the fact that Britain
may lose international political clout by leaving the EU, the major consequences of the Brexit
would be financial and economic. In the event of a vote to leave the EU, the economic costs
would outweigh the benefits for both UK and Europe. Exports would suffer substantially, as
would investment, and policymakers would get tied up in longest renegotiations of trade
relations. A lengthy period of uncertainty on the part of companies and traders would
jeopardize the UK and EU economic growth prospects. Accordingly, London School of
Economics estimates that a rise in trading costs and a drop of productivity would prompt a
decrease of about 2.2 percent of GDP in the most cheerful case and a fall of anywhere among
6.3 percent and 9.5 percent in the most gloomy case, very close to the losses resulting from
the global financial collapse. Besides, the German foundation Bertelsmann Stiftung advanced
that leaving EU would cost for UK by about 78 billion euros a year (for ten years). This loss
is highly expected since being outside the EU implies a great decline in foreign trade, due to
the return of customs barriers. They also anticipated a decrease by 0.3 percent of GDP per
capita in France and Germany. Beyond the rights and wrongs of staying or leaving the EU,
uncertainty is evidently the thing markets hate the most. If the perception of economic and
investment risk to the UK raises, the sterling would depreciate, the cost of borrowing for
business could increase markedly, and the stock market prices fall. Also, the European
markets could roil the great anxiety over this event.
Due to the enormous amount of available information, searching has become
growingly dominant in the use of Internet. Millions of users daily interact with search
1
3
engines, creating valuable sources of data regarding various aspects of the world. In light of
this, the Internet search becomes day-to-day a potential tie helping to better analyze the equities behavior in turbulent times. Behavioral finance research considers that traders’ investment decisions are highly driven by emotion (Damasio 1999 and Dolan 2002). For
example, some research show how online information predicts “Grexit”, crypto-market and
oil market (Mitchell et al. 2012, Choi and Varian 2012, Bordino et al. 2012, Kristoufek 2013,
Bouoiyour and Selmi 2015 a, b, among others). Notably, information related to Brexit has
spread rapidly, causing sizable stock market changes by adjusting the traders’ market
expectations. With the potent uncertainty surrounding possible Brexit, bloggers and
economists start dealing with this issue by revolving around various questions: Is Brexit a
threat for investors? What might the possibilities be for the UK outside the EU? What would
happen if Britain left the EU? etc…
In light of this apparent great attention to British exit from EU, this paper introduces
the concept of internet concern as quantitative measure to address whether extracting public
moods related to “Brexit” affect significantly UK and European (with special reference to
Germany and France) equities. From a methodological perspective, such complexity in the
focal issue makes analyzing the behaviors of equities in an uncertain context heavily difficult
with classic methods. The speculative bubbles characterizing asset markets strengthened the
focus on models that allow properly capturing dynamic dependencies in data. Bearing these
considerations in mind, linear correlation may not be a satisfactory measure of dependence, as
it does not account for dependence between tail events. Outside the classical mean variance
framework2, investors with more general preferences need an estimate of the full return distribution to compute expected utility and derive their optimal portfolio holdings. While a
large body of work has proposed models for the conditional mean and variance of stock
returns, far less work has been undertaken towards modeling the full return distribution. This
paper uses a quantile regression (QR) approach that concentrates on predictability of quantiles
located at several points of the return distribution. It enables to uncover fresh information
about how would react UK and EU equities over an uncertain period surrounding possible
Brexit. Obviously, the correlation asymmetries would ensure that market participants
(investment advisers, investors, traders and regulators) have the opportunity to make informed
2
4
decisions. In addition to the correlation variation among tail-distributions, the direction of the
Granger causality from the attention to Brexit to UK, German and French stock returns have
been computed for distinct frequency components (frequency domain causality test). In this
case, the stationary process can be depicted as a weighted sum of sinusoidal components with
a certain frequency, allowing us to evaluate different cyclical components.
By considering a wide range of quantiles, the reactions of UK and EU stock markets to
possible Brexit appear as highly heterogeneous among tail distributions, where consistent
with the notion of asymmetry. The German stock market is typically more responsive than French and UK equities towards the possible British exit from EU. With respect the causality’ strength, the results do not fundamentally change whatever the internet proxy used (Google
Trends or Twitter). In particular, the cyclical component seems longer for Germany followed
by France and UK.
The body of this paper is organized in four major sections. Section 2 outlines the
methodology followed in this paper, and presents a brief data overview. Section 3 reports and
discusses our main findings. Section 4 concludes.
2.
Methodology, data and hypotheses
2.1. The quantile regression approach
Compared to the standard estimation of the conditional mean function (OLS), QR
approach assesses each link accurately across random variables (Koenker and Bassett 1978;
Koenker and Xiao 2002). It provides a complete description of asymmetric samples, which is
one of the main distinguishing characteristics of financial data. Since its introduction by
Koenker and Bassett (1978), QR continues to be an interesting tool as it accounts for a set of
regression curves that differ across distinct quantiles of the conditional distribution of the
dependent variable. A QR is suited to determine how evolve time series for all portions of a
probability distribution (i.e., slopes from the minimum to the maximum responses). Hence, it
can underscore a broader picture in helping gauge the correlation between current returns and
various parts of the lagged conditional returns which presents outstanding when extreme
values are present. QR bestows the role of different rhythms in the connectivity between the
5
QR is a generalization of median regression analysis to other quantiles. The
coefficients of the τth conditional quantile distribution are estimated as follows:
1
) (
' ) ' ( )
1 ( min arg ) (
ˆ
t
t t x
yt t y x
(1)
where the quantile regression coefficient β(τ) determines the connection between the vector x
(independent variables) and the τth conditional quantile of y (the dependent variable). To
determine y in function of specific independent series, the values of quantile coefficients
could be constant where the values of β(τ) do not change markedly for the values τ.
Moreover, it should be symmetric (asymmetric) where the values of β(τ) seem similar
(dissimilar) for lower and upper quantiles.
We specify then the conditional quantile function for different quantile levels (such as
the 10th, 20th... 90th percentiles):
k k
k k
k k
y x x z
Q (
)
(
)
(
)
(
)(2)
where z corresponds to the relevant control variables (to be described later).
Using QR, we can see if the return is indicative of a rapidly improving UK, German
and French equities or associated with a market that is highly contracting among various
slopes (quantiles from the 10th to the 90th). Although the variant correlation via QR can be
relevant for market participants to act efficaciously, this technique seems insufficient to fully judge a “complex” issue in an uncertain context. The methodological critical way arises from the fact that correlation does not necessarily imply causality.
2.2. The frequency domain causality test
The majority of previous empirical researches are limited in scope to the applications
of linear models. However, the great speculation, the hefty uncertainty surrounding financial markets and the “ convoluted” asset prices dynamics can prompt structural alterations in the pattern of financial markets’ responses for a given time period. Given these considerations, this study seeks to scrupulously address this issue in a nonlinear framework by utilizing a
6
computing a single Granger causality measure for the entire link, the Granger causality is
determined here for each individual frequency component. This frequency-by-frequency
examination will make it possible to identify if the predictive power is concentrated at the
quickly fluctuating components (high frequencies or short-run time horizons) or at the slowly
fluctuating components (low frequencies or long-term).
To define the frequency causality test, we start by considering zt
xt,yt
as a two-dimensional time series vector with t = 1… T. It is supposed that zt has a finite-order VARrepresentation (L)zt t where p p
t L L
z
L
( ) 1 1 ... is a 2 × 2 lag polynomial with
k t t k z z
L . It is assumed that the vector εt is white noise withE(t)0 and E (εtεt′) = Σ,
) ' ( t t
E where
is a positive definite matrix. The system is stationary expressed as: 21 12 22 21 12 11 ) ( ) ( ) ( ) ( ) (
L L L L Lzt t (3)
21 12 22 21 12 11 ) ( ) ( ) ( ) ( ) ( L L L L L t
Then, the spectral density can be derived from the previous matrix and denoted as:
2
12 2
11( ) ( )
2 1 )
( iw iw
x w e e
f
(4)
Spectral analysis allows determining the cyclical properties of data. In this study, the
Granger causality test-based frequency domain relies on a modified version of the coefficient
of coherence. It is estimated in a nonparametric fashion enabling to derive the distributional
properties of investigated time series. Let xt and yt be two stationary time series of length T
representing the attention to Brexit and the central stock returns, respectively. The main goal
of this study is to test whether xtGranger cause yt ,at a given frequency λ, conditioning upon
Zt (additional control variables that will be mentioned below). Accordingly, Geweke (1982)
proposed a measure of causality that can be expressed as follows:
7
As 12(eiw)2seems “complex” nonlinear function of the VAR parameters, Breitung and
Candelon (2006) and in order to resolve this drawback argue that the hypothesis
M x→y/Z(ω) = 0 correspond to a linear restriction on the VAR coefficients.
0 ) ( ) ( :
0 R L
H
(6)
where
)
sin(
)...
2
sin(
)
sin(
)
cos(
)...
2
cos(
)
cos(
)
(
p
p
R
Based on equation (6), we can adequately capture how signals evolve among different
frequency bands involved. The significance of the causal relationship can be tested by a
standard F-test or by comparing the causality measure for ω ∈[0, π] with the critical value of
a χ2 distribution with 2 degrees of freedom, which is 5.99.
2.3. Data and hypotheses
In this article, the QR model and frequency domain causality test have been performed
to analyze the reactions of UK and EU stock returns3 conditioning upon global financial and economic factors. To this end, we use weekly data for over the period from January 2010 to
July 20154(with a total of 268 observations) for stock prices of UK (FTSE 100), Germany (DAX 30) and France (CAC 40).We prefer use weekly instead of daily or monthly data to
avoid possible econometric pitfalls that may occur including the microstructure effects, the
bid-ask bounce and the possible asymmetrical demeanor. The stock market prices data are
collected from Datastream database. The search queries for keyword related to the British exit from EU (i.e., “Brexit”) were collected via Google Trends (http://www.google.com/trends). Note that for twitter, we use the tweet backs related to the same keyword. Three global
financial and risk factors that may have a wide role in explain the focal linkage have been
considered. Generally, major global financial and economic factors could be channels through which fluctuations in the world’s economic and financial conditions are transmitted to UK and EU equities. These factors include the US equity volatility index (VIX), the West Texas
Intermediate (WTI) oil price and the world gold price. The WTI has been widely used in the
3
The stock return (STR) is calculated by considering the ratio stock price (in log) at time t and the lagged stock price (in log).
4
8
literature as the benchmark price for global oil markets. The WTI crude oil is among the most
traded oil on the world markets, and therefore is significantly affected by macro-financial
variables. The gold is a precious metal that has been largely perceived as a hedge against
sudden shocks and also a safe haven over extreme stock market fluctuations (Baur and Lucey
2010). Moreover, the literature in finance field has been frequently relied on proxies of
uncertainty, most of which have the advantage of being directly observable. Such proxies
include the implied volatility of stock returns (i.e., VIX). This index plays a powerful role in
explaining asset allocation and portfolio strategies (Hood and Malik 2013 and Balcilar et al.
2014). It may help reaching further insights about how the stock markets responses to global
market news. These time series data come from quandl website. All the investigated variables
have been transformed by taking natural logarithms to correct for potential heteroskedasticity
and dimensional differences among time series.
Bearing in mind the difficulty to quantify Brexit costs, we formulate some hypotheses
to be tested: Is the uncertainty about Britain leaving the Europe exerted a great influence on
UK, German and French equities? If so, do the responses to possible Brexit appear different
across these countries? To answer these questions, we use a QR approach estimator which is
robust to outlying observations on the dependent variable. The model to be estimated is given
by:
t t
t t
t
t
STR
Brexit
Oil
VIX
Gold
r
ˆ
ˆ
(
)
ˆ
(
)
1
ˆ
(
)
ˆ
1(
)
ˆ
2(
)
ˆ
3(
)
(7)whererˆt is the estimated
conditional quantile of UK, German and French stock returns(STR), and the estimated parameters
ˆ(
),
ˆ
(
)
and
ˆ
k(
)
for k=1, 2, 3 are function of
;STRt-1: the lagged stock return that may reflect the influence of some potential variables not
included here due to the unavailability of weekly frequency data for some time-series.
In addition to the interdependence pattern, this research applies a frequency domain
causality test to determine whether there is a time-varying causality between the growing
9
3.
Main findings
3.1. QR results
We first employ OLS regression5 to reach initial information about the reactions of
UK and EU equities to Brexit. The idea here is to have a case of benchmarking to compare the
OLS with QR in order to highlight the effectiveness of QR approach. The OLS results are
reported in Table 1 indicate that the coefficient of Brexit proxied by Google Trends seem
significant only for UK and France, which is non-credible given the large Germany’s weight
in Europe. The mean effect of the exogenous variable on the endogenous time series may be under or over estimate impacts or even fail to properly determine full possible influences (Cade and Noon 2003); hence the need to perform more elaborate methods.
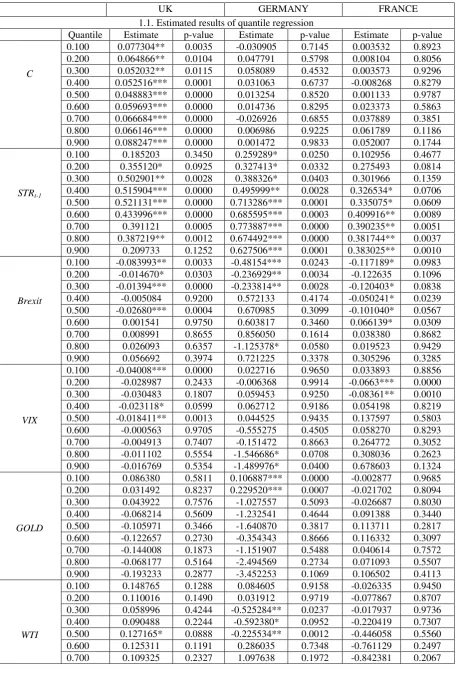
Using QR technique, a clearer heterogeneity across UK and EU equities with respect the Brexit’ impact was found. For UK, the attention to Brexit exerts a negative significant influence on stock return at low and middle quantiles (i.e., when investors are pessimistic or
the market is moderately efficient); such relationship is weak, fluctuating between -0.083 and
-0.013 (Table 1, Panel 1.1). Unlike UK, Germany would suffer markedly from possible
Brexit. Precisely, the British exit from Europe lead to a decrease of stock return (the slope
coefficient moves among -0.48 and -0.23). This result is also validated when the stock market
is performing weakly, but also in upper quantile (i.e., =0.8). For France, the equity reaction
to Brexit anxiety is negative at low quantiles and around middle quantile (i.e., when the stock
market perform less than normal or around the average). Specifically, the Brexit coefficients
vary between -0.12 and -0.005.
To avoid possible methodological pitfalls regarding omitted variable bias, a vector of
additional explanatory variables (discussed above) is incorporated in the model. We include
WTI, gold price and VIX. We clearly show that the implied volatility index affect statistically
and negatively the performance of the UK and EU markets at different quantiles, indicating
that the EU market returns decrease as the VIX increases. Unsurprisingly, the uncertainty is
the thing that markets hate the most. The VIX has a moderate impact on UK and France stock
markets and occurs in lower quantiles, while for Germany the effect appears more important
and occurs in upper quantiles. Besides, gold has no influence for the considered countries
5
10
(except Germany at low quantiles or when pessimism mostly prevailed). This means that gold has not lost its great importance as a safe haven and a hedge in Germany. It seems important
to recall that gold possesses no credit risk and cannot turn worthless even though uncertain
event. With the financialization of the commodity markets, gold enables to provide great
protection against losses when equities undergo large decreases. Then, including gold in
portfolios allows investors preventing the downside risk in their investments (Mishra and
Mishra 2010). We do not support this evidence for the investigated countries (except
Germany in lower quantiles). WTI affects positively UK equity return at highest quantiles
(i.e., when investors are optimistic) and middle quantiles, but this correlation seems weak
since it is only significant at 10%. Nevertheless, WTI impacts negatively the German stock
return around the middle quantile (i.e., =0.4 or 0.5). French equity does not seem sensitive
to oil price fluctuations.
Table 1 (Panel 1.2) reports a formal test of the equality of the coefficient estimates for
various τ-quantiles to evaluate whether the estimated QR relationships are conform to the
location shift hypothesis which assumes the same slope parameters for all of the conditional
quantile functions6. It shows that the coefficient estimates are statistically different from each other if the estimates for lower τ-quantiles are compared with estimates for the higher or
intermediate τ-quantiles. These outcomes hold for the coefficient estimates of the variables
STRt-1and Brexit. The null hypothesis of equal slope is generally rejected
7
at the conventional
significance levels for UK (0.100 vs. 0.900, 0.300 vs. 0.700 and 0.400 vs. 0.600), Germany
(0.100 vs. 0.900, 0.200 vs. 0.800 and 0.300 vs. 0.700) and France (0.100 vs. 0.900, 0.200 vs.
0.800, 0.300 vs. 0.700 and 0.400 vs. 0.600).
6
The Koenker and Xiao (2002) test computes that all the covariate effects satisfy the null hypothesis of equality of the slope coefficients across τ-quantiles. In particular, the difference between slope estimates at the
and (1-
) quantiles is examined. A rejection favors the QR.7
11
Table 1. QR estimates: The responses of UK and EU equities to the attention to Brexit (via Google Trends)
UK GERMANY FRANCE
1.1.Estimated results of quantile regression
Quantile Estimate p-value Estimate p-value Estimate p-value
C
0.100 0.077304** 0.0035 -0.030905 0.7145 0.003532 0.8923
0.200 0.064866** 0.0104 0.047791 0.5798 0.008104 0.8056
0.300 0.052032** 0.0115 0.058089 0.4532 0.003573 0.9296
0.400 0.052516*** 0.0001 0.031063 0.6737 -0.008268 0.8279
0.500 0.048883*** 0.0000 0.013254 0.8520 0.001133 0.9787
0.600 0.059693*** 0.0000 0.014736 0.8295 0.023373 0.5863
0.700 0.066684*** 0.0000 -0.026926 0.6855 0.037889 0.3851
0.800 0.066146*** 0.0000 0.006986 0.9225 0.061789 0.1186
0.900 0.088247*** 0.0000 0.001472 0.9833 0.052007 0.1744
STRt-1
0.100 0.185203 0.3450 0.259289* 0.0250 0.102956 0.4677
0.200 0.355120* 0.0925 0.327413* 0.0332 0.275493 0.0814
0.300 0.502901** 0.0028 0.388326* 0.0403 0.301966 0.1359
0.400 0.515904*** 0.0000 0.495999** 0.0028 0.326534* 0.0706 0.500 0.521131*** 0.0000 0.713286*** 0.0001 0.335075* 0.0609 0.600 0.433996*** 0.0000 0.685595*** 0.0003 0.409916** 0.0089 0.700 0.391121 0.0005 0.773887*** 0.0000 0.390235** 0.0051 0.800 0.387219** 0.0012 0.674492*** 0.0000 0.381744** 0.0037 0.900 0.209733 0.1252 0.627506*** 0.0001 0.383025** 0.0010
Brexit
0.100 -0.083993** 0.0033 -0.48154*** 0.0243 -0.117189* 0.0983 0.200 -0.014670* 0.0303 -0.236929** 0.0034 -0.122635 0.1096 0.300 -0.01394*** 0.0000 -0.233814** 0.0028 -0.120403* 0.0838
0.400 -0.005084 0.9200 0.572133 0.4174 -0.050241* 0.0239
0.500 -0.02680*** 0.0004 0.670985 0.3099 -0.101040* 0.0567
0.600 0.001541 0.9750 0.603817 0.3460 0.066139* 0.0309
0.700 0.008991 0.8655 0.856050 0.1614 0.038380 0.8682
0.800 0.026093 0.6357 -1.125378* 0.0580 0.019523 0.9429
0.900 0.056692 0.3974 0.721225 0.3378 0.305296 0.3285
VIX
0.100 -0.04008*** 0.0000 0.022716 0.9650 0.033893 0.8856
0.200 -0.028987 0.2433 -0.006368 0.9914 -0.0663*** 0.0000
0.300 -0.030483 0.1807 0.059453 0.9250 -0.08361** 0.0010
0.400 -0.023118* 0.0599 0.062712 0.9186 0.054198 0.8219
0.500 -0.018411** 0.0013 0.044525 0.9435 0.137597 0.5803
0.600 -0.000563 0.9705 -0.555275 0.4505 0.058270 0.8293
0.700 -0.004913 0.7407 -0.151472 0.8663 0.264772 0.3052
0.800 -0.011102 0.5554 -1.546686* 0.0708 0.308036 0.2623
0.900 -0.016769 0.5354 -1.489976* 0.0400 0.678603 0.1324
GOLD
0.100 0.086380 0.5811 0.106887*** 0.0000 -0.002877 0.9685
0.200 0.031492 0.8237 0.229520*** 0.0007 -0.021702 0.8094
0.300 0.043922 0.7576 -1.027557 0.5093 -0.026687 0.8030
0.400 -0.068214 0.5609 -1.232541 0.4644 0.091388 0.3440
0.500 -0.105971 0.3466 -1.640870 0.3817 0.113711 0.2817
0.600 -0.122657 0.2730 -0.354343 0.8666 0.116332 0.3097
0.700 -0.144008 0.1873 -1.151907 0.5488 0.040614 0.7572
0.800 -0.068177 0.5164 -2.494569 0.2734 0.071093 0.5507
0.900 -0.193233 0.2877 -3.452253 0.1069 0.106502 0.4113
WTI
0.100 0.148765 0.1288 0.084605 0.9158 -0.026335 0.9450
0.200 0.110016 0.1490 0.031912 0.9719 -0.077867 0.8707
0.300 0.058996 0.4244 -0.525284** 0.0237 -0.017937 0.9736
0.400 0.090488 0.2244 -0.592380* 0.0952 -0.220419 0.7307
0.500 0.127165* 0.0888 -0.225534** 0.0012 -0.446058 0.5560
0.600 0.125311 0.1191 0.286035 0.7348 -0.761129 0.2497
12
0.800 0.170636* 0.0810 1.108329 0.2084 -0.357306 0.4675
0.900 0.235583* 0.0734 1.398832 0.1727 -0.067096 0.8725
OLS (Brexit) -0.026531** 0.0346 0.156782 0.3456 -0.05341** 0.0076
1.2.Statistic tests of the equality of slope estimates across various quantiles
0.100 vs. 0.900 3.18* 0.0691 12.58** 0.0032 10.76** 0.0014
0.200 vs. 0.800 0.00 0.9208 15.26** 0.0011 6.22* 0.0108
0.300 vs. 0.700 5.03** 0.0085 4.83* 0.0439 23.15*** 0.0000
0.400 vs. 0.600 6.77** 0.0083 1.75 0.1264 11.69** 0.0055
Notes: The right columns of this table present the F tests of the equality of slope parameters across various quantiles. ***, ** and * imply significance at the 1%, 5% and 10%, respectively;
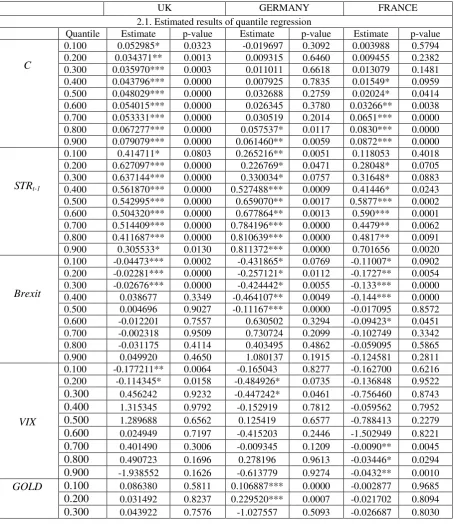
These results do not appear highly sensitive to the Brexit attention proxies used. By
considering the number of tweet backs as quantitative measure, the findings change slightly
(Table 2, Panel 2.1). First of all, a systematic pattern exists for the quantile-varying estimates
of the Brexit coefficient among the investigated countries, that the classical methods
unknown. It is often revealed that UK and EU equities respond dissimilarly to the anxiety
over Brexit. For all the concerned countries, a negative and significant relationship between
the central variables occurs when the stock return is at low quantiles (i.e., when stock market
perform badly). However, the severityof the effect of uncertainty surrounding Brexit was not
uniform across UK and EU markets. In particular, Germany suffered the most, while France
and UK (in this order) experienced a moderate influence. More accurately, we show that the Brexit’ impact on UK stock return moves within -0.04 (10th) and -0.02 (20th and 30th). In France, the interest to the Britain being outside EU exert more important influence on investors’ confidence, as its effect on equity return fluctuates among -0.11 (10th) and -0.17 (20th). For Germany, the situation appears more serious, since this turbulent and uncertain
time affects strongly stock returns (-0.25 (20th) and -0.46 (50th)). In sum, the reactions of UK
and EU stock markets to Brexit looms is asymmetric; When concentrating on the additional
control variables, the results appear quite interesting. We note usually that the uncertainty
index displays higher coefficient for Germany followed by UK (but in lower quantiles). The VIX’ impact on French equities is weaker, occurring at higher quantiles. Oil price affects significantly the three investigated markets around the average; such effect seems stronger for
UK and with less extent for Germany. French equity is moderately influenced by WTI
changes. Over the current uncertainty surrounding possible British exit from EU, gold plays
as a hedge for Germany, while its influence on UK and French equities seems negligible. The
same result has been found in Table. A further investigation consists on re-applying the same
13
Table18. In sum, these findings fortify the usefulness to consider the distribution
[image:14.595.73.528.190.715.2]heterogeneity when examining an unsettled context where standard methods are unbefitting.
Table 2. QR estimates: The responses of UK and EU equities to the attention to Brexit (via Twitter)
UK GERMANY FRANCE
2.1. Estimated results of quantile regression
Quantile Estimate p-value Estimate p-value Estimate p-value
C
0.100 0.052985* 0.0323 -0.019697 0.3092 0.003988 0.5794
0.200 0.034371** 0.0013 0.009315 0.6460 0.009455 0.2382
0.300 0.035970*** 0.0003 0.011011 0.6618 0.013079 0.1481
0.400 0.043796*** 0.0000 0.007925 0.7835 0.01549* 0.0959
0.500 0.048029*** 0.0000 0.032688 0.2759 0.02024* 0.0414
0.600 0.054015*** 0.0000 0.026345 0.3780 0.03266** 0.0038
0.700 0.053331*** 0.0000 0.030519 0.2014 0.0651*** 0.0000
0.800 0.067277*** 0.0000 0.057537* 0.0117 0.0830*** 0.0000 0.900 0.079079*** 0.0000 0.061460** 0.0059 0.0872*** 0.0000
STRt-1
0.100 0.414711* 0.0803 0.265216** 0.0051 0.118053 0.4018
0.200 0.627097*** 0.0000 0.226769* 0.0471 0.28048* 0.0705
0.300 0.637144*** 0.0000 0.330034* 0.0757 0.31648* 0.0883
0.400 0.561870*** 0.0000 0.527488*** 0.0009 0.41446* 0.0243 0.500 0.542995*** 0.0000 0.659070** 0.0017 0.5877*** 0.0002 0.600 0.504320*** 0.0000 0.677864** 0.0013 0.590*** 0.0001 0.700 0.514409*** 0.0000 0.784196*** 0.0000 0.4479** 0.0062 0.800 0.411687*** 0.0000 0.810639*** 0.0000 0.4817** 0.0091
0.900 0.305533* 0.0130 0.811372*** 0.0000 0.701656 0.0020
Brexit
0.100 -0.04473*** 0.0002 -0.431865* 0.0769 -0.11007* 0.0902 0.200 -0.02281*** 0.0000 -0.257121* 0.0112 -0.1727** 0.0054 0.300 -0.02676*** 0.0000 -0.424442* 0.0055 -0.133*** 0.0000
0.400 0.038677 0.3349 -0.464107** 0.0049 -0.144*** 0.0000
0.500 0.004696 0.9027 -0.11167*** 0.0000 -0.017095 0.8572
0.600 -0.012201 0.7557 0.630502 0.3294 -0.09423* 0.0451
0.700 -0.002318 0.9509 0.730724 0.2099 -0.102749 0.3342
0.800 -0.031175 0.4114 0.403495 0.4862 -0.059095 0.5865
0.900 0.049920 0.4650 1.080137 0.1915 -0.124581 0.2811
VIX
0.100 -0.177211** 0.0064 -0.165043 0.8277 -0.162700 0.6216 0.200 -0.114345* 0.0158 -0.484926* 0.0735 -0.136848 0.9522
0.300 0.456242 0.9232 -0.447242* 0.0461 -0.756460 0.8743
0.400 1.315345 0.9792 -0.152919 0.7812 -0.059562 0.7952
0.500 1.289688 0.6562 0.125419 0.6577 -0.788413 0.2279
0.600 0.024949 0.7197 -0.415203 0.2446 -1.502949 0.8221
0.700 0.401490 0.3006 -0.009345 0.1209 -0.0090** 0.0045
0.800 0.490723 0.1696 0.278196 0.9613 -0.03446* 0.0294
0.900 -1.938552 0.1626 -0.613779 0.9274 -0.0432** 0.0010
GOLD 0.100 0.086380 0.5811 0.106887*** 0.0000 -0.002877 0.9685
0.200 0.031492 0.8237 0.229520*** 0.0007 -0.021702 0.8094
0.300 0.043922 0.7576 -1.027557 0.5093 -0.026687 0.8030
8
14
0.400 -0.068214 0.5609 -1.232541 0.4644 0.091388 0.3440
0.500 -0.105971 0.3466 -1.640870 0.3817 0.113711 0.2817
0.600 -0.122657 0.2730 -0.354343 0.8666 0.116332 0.3097
0.700 -0.144008 0.1873 -1.151907 0.5488 0.040614 0.7572
0.800 -0.068177 0.5164 -2.494569 0.2734 0.071093 0.5507
0.900 -0.193233 0.2877 -3.452253 0.1069 0.106502 0.4113
WTI
0.100 1.473951 0.5682 0.739456 0.5748 -1.104859 0.7221
0.200 1.082668 0.8870 0.481473 0.9521 -0.869632 0.3580
0.300 0.005958 0.9906 -0.416135* 0.0554 -0.2040** 0.0064
0.400 0.665325* 0.0243 -0.473920* 0.7343 -0.23534* 0.0810
0.500 0.519166* 0.0614 -0.120784 0.6110 0.013033 0.8013
0.600 -0.583889 0.2492 -0.348164 0.2592 -0.055399 0.2579
0.700 -0.528580 0.1811 -3.708769 0.4411 -0.518038 0.2699
0.800 -0.654508 0.1544 -4.119389 0.1509 -0.559562 0.9060
0.900 -0.987736 0.1202 -4.470263 0.2170 -0.834317 0.9498
OLS (Brexit) 0.034564 0.3568 -0.104*** 0.0003 0.009672 0.4512
2.2. Statistic tests of the equality of slope estimates across various quantiles 0.100 vs. 0.900 0.76 0.2154 0.13 0.8965 3.56** 0.0011
0.200 vs. 0.800 1.97* 0.0404 0.22 0.8123 10.14*** 0.0000
0.300 vs. 0.700 2.12** 0.0091 3.07* 0.0297 1.89* 0.0412
0.400 vs. 0.600 7.65*** 0.0000 5.62** 0.0038 0.21 0.3781 Notes: The right columns of this table present the F tests of the equality of slope parameters across various quantiles. ***, ** and * imply significance at the 1%, 5% and 10%, respectively.
3.2.Frequency domain causality findings
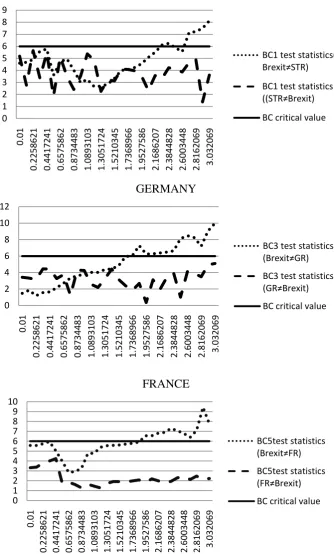
As mentioned above, the focus of the use of frequency domain causality test is on
detecting cycles in the intensity of Brexit’ impact on UK and European stock markets. Figure
1 depicts the evolution of the linkage between the interest to Brexit (measured via Google
Trends) and UK and EU equities conditioning upon gold price, uncertainty (or VIX) index,
and WTI. The figure contains the test statistics with their 5 percent critical values for the
different frequency bands involved (solid line) over the interval [0, π]. The frequency () on
the horizontal axis can be translated into a cycle or periodicity of T weeks byT(2
/
) whereT is the period. The results of Granger coefficient for causality running from the attention to Brexit to equities show that searching the keyword “Brexit” via Google Trends Granger-cause UK and EU equities (Figure 1) at level of frequencies reflecting short-run business cycle (or
high frequencies). The cycle appears lengthy for Germany (when
1.733.03
, corresponding to a cycle within four weeks) compared to France (when
1.843.03
, corresponding to a cycle length of 3.4 weeks) and UK (when
2.272.49
2.603.03
, corresponding to a cycle between 2.4 and 2.7 weeks). The reverse causality is not supported at15
Figure 1. The frequency domain causality between the attention to Brexit (via Google Trends) and UK and EU equities
UK
GERMANY
FRANCE
Note: The horizontal line represents the 5% critical value of the null hypothesis test of no Granger causality at frequency w.
0 1 2 3 4 5 6 7 8 9 0.01 0.2258 621 0.4417 241 0.6575 862 0.8734 483 1.0893 103 1.3051 724 1.5210 345 1.7368 966 1.9 52 75 86 2.1686 207 2.3844 828 2.6003 448 2.8162 069 3.0 32 06 9
BC1 test statistics(
Brexit≠STR)
BC1 test statistics
((STR≠Brexit)
BC critical value
0 2 4 6 8 10 12 0.01 0.2258 621 0.4417 241 0.6575 862 0.8734 483 1.0893 103 1.3051 724 1.5210 345 1.7368 966 1.9527 586 2.1686 207 2.3844 828 2.6 00 34 48 2.8162 069 3.0320 69
BC3 test statistics
(Brexit≠GR)
BC3 test statistics
(GR≠Brexit)
BC critical value
0 1 2 3 4 5 6 7 8 9 10 0.01 0.2258 621 0.4417 241 0.6575 862 0.8734 483 1.0893 103 1.3051 724 1.5210 345 1.7368 966 1.9527 586 2.1686 207 2.3844 828 2.6003 448 2.8162 069 3.0 32 06 9 BC5test statistics (Brexit≠FR) BC5test statistics (FR≠Brexit)
16
In further step, the same testing procedure (conditioning upon the same control
variables) is implemented to the Twitter data related to “Brexit” (Figure 2). The results remain
fairly solid and, while the cycles vanish for all the considered countries. The strength of
causality is often more pronounced for Germany where we show that there is a significant
causality from Brexit to stock returns when
2.063.03
, corresponding to a cycle ofthree weeks, whereas the causal cycles are less lengthy for France (when
2.163.03
, corresponding to a wave length inferior to 2.9 weeks) and UK (when
2.383.03
, corresponding to a cycle less than 2.6 weeks).Notably, the followed interpolation procedure has affected sharply the strength of
Granger-causality (the cycles vanish when using the number of tweets as measure of the
interest to Brexit), not the direction of causality and our hypothesis that the uncertainty and
anxiety over Brexit Granger-cause UK, Germany and France equities varies depending on
frequency-to-frequency variation. The aforementioned findings prove slight differentiability
among Googlers and Twitters. Even though Twitter has become a popular way of highly
directing followers to news (in particular, blogs), the social media discussion (especially,
Twitter) stand out from users as more likely to be high earners and college-educated.
Despite their computational differences, QR and frequency domain causality test are
likely to be complementary rather than substitute with respect the reactions of UK and EU
stock returns to the attention towards Brexit. Indeed, whatever the internet proxy used
(Google Trends or Twitter), both methods employed show the same hierarchy (Germany
followed by France and UK) regarding the effect of Brexit on the equity returns of the three
investigated countries. The results are fairly robust, all suggesting the need to account for
asymmetry and nonlinearity when assessing the equities responses over an uncertain
17
Figure 2. The frequency domain causality between the attention to Brexit (via Twitter) and UK and EU equities
UK
GERMANY
FRANCE
Note: The horizontal line represents the 5% critical value of the null hypothesis test of no Granger causality at frequency w.
0 1 2 3 4 5 6 7 8 0.01 0.2258 621 0.4417 241 0.6575 862 0.8734 483 1.0893 103 1.3051 724 1.5210 345 1.7368 966 1.9527 586 2.1686 207 2.3844 828 2.6003 448 2.8162 069 3.0320 69 BC2test statistics(Brexit≠STR)
BC2 test statistics
(STR≠Brexit)
BC critical value
0 2 4 6 8 10 12 0.01 0.2258 621 0.4417 241 0.6575 862 0.8734 483 1.0893 103 1.3051 724 1.5210 345 1.7368 966 1.9527 586 2.1 68 62 07 2.3844 828 2.6003 448 2.8162 069 3.0320 69
BC4 test statistics
(Brexit≠GR)
BC4 test statistics
(GR≠Brexit)
BC critical value
0 1 2 3 4 5 6 7 8 9 10 0.01 0.2258 621 0.4417 241 0.6575 862 0.8734 483 1.0 89 31 03 1.3 05 17 24 1.5210 345 1.7368 966 1.9527 586 2.1686 207 2.3844 828 2.6003 448 2.8162 069 3.0320 69
BC6 test statistics
(Brexit≠FR)
BC6test statistics
(FR≠Brexit)
18 3.3. Interpretation of results
We must start by advancing that our primary focus in this study is to test whether investors’ fears over possible British exit from EU affect equities of major European countries. These markets participants’ moods to Brexit were extracted via Google Trends and
Twitter. This strategy is rather subjective and cannot reflect the real effect (economic,
political, social, etc...) of Britain exit. Nevertheless, the results seem quite intuitive. The
uncertainty surrounding the possible Brexit affects significantly German, French and UK
equities (and with great extent, Germany). This significant anxiety’s influence on European equities is expected because UK’s trade is geared greatly towards the EU. More than 50 percent of its exports are to the EU, and also more than 50 percent of imports come from
European States. Also, the fact that the investors’ fears have greater influence on the German
market seems logical due to the strong power or the dominant role of Germany in the
European Union. Compared to France, Germany enjoyed deeper trade and investment
relations with the UK. Based on UNCTAD statistics, in 2013, Germany represents the second
export destination after USA with approximately 11 percent of overall exports, followed by
the Netherlands (8.7 percent) and then France (6.6 percent). Similarly, with respect imports
structure, Germany is positioned as the number one trade partner with 13.3 percent, then
China (8.7 percent), the Netherlands (7.5 percent), the USA (6.9 percent) and France (5.9
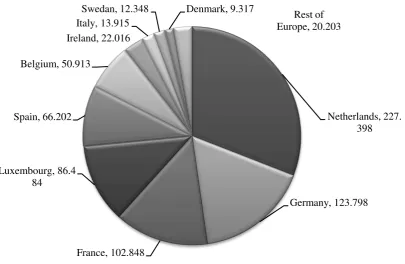
percent). Moreover, the EU and UK are becoming growingly inter-connected via investment
relationships. Arguably, the Netherlands (227.3 USD millions), Germany (123.7 USD
millions) and France (102.8 USD millions) are the biggest investor nations, representing
together around 60 percent of FDI from the EU (Figure A.1, Appendix).
Besides, the fact that UK stock market exhibits moderate Brexit’ influence may reflect
the difficulty to properly predict whether Britain should stay or leave the EU and thus hesitation surrounding UK market participants decisions. According to YouGov9 polling data, the UK is divided into 41 percent asserting they would vote to leave and 41 percent saying
that they would vote to still in the European Union. But if negotiations between the UK and
other EU states lead to important outcomes around some issues, the percentage of supporters
to stay in EU increases to 50 percent, compared to 23 percent voting to be outside the Europe. It’s true that some asserted that Britain should attempt to loser trading relationships with EU
by forming economic and political partnerships with countries outside Europe; but others
9
19
proposed achieving formal linkages with European countries by ensuring a European Free Trade Association. Likewise, Regardless of the referendum result, the British exit from EU10 will have serious geopolitical and economic outcomes and will threaten the prospects for European integration.
4.
Conclusion
The question of UK membership is evidently a big issue for Europe and especially for
the two most powerful nations on the European continent (i.e., Germany and France). If the
UK votes to be outside the EU, gloomy outcomes are expected for Britain and EU. In this context, the German Finance Minister, Wolfgang Schäuble, asserted that “Brexit would make the whole of Europe less stable and more volatile, […] and Britain would be shut out of the single market if it left the EU”. Also, analysts and market participants over the Europe seem very anxious about the costs of Brexit. The possible British exit from the EU could pose risks
for Britain and EU ranging from falling trade flows and capital outflows. These
considerations make a basis of the given research. Aware by the difficulty to effectively
quantify the losses from Brexit, the purpose of this article is to test how plays media’ stance
towards the Brexit (by introducing the concept of Internet concern as a quantitative measure)
in exacerbating uncertainty among investors in UK, Germany and France.
To the extent that global investors increasingly use portfolio diversification as
appropriate strategy to lighten risks, a rigorous examination of the equities’ responses to the
disquiet over Brexit may be useful for the investor’s optimal asset allocation decisions. To
address this issue, the paper employs a QR approach and frequency domain test (relying on
signal theory). The main advantages of these techniques lie in their ability to model the link
between the attention to Brexit and stock market returns more effectively than is possible with
standard methods including the OLS and the standard Granger causality test. While OLS
regression is only able to estimate the impact of Brexit on the conditional mean of UK,
German and French equities. QR goes further by disentangling this influence on the
conditional mean into different effects on the conditional quantile (accounting for
asymmetry), offering thus the most information possible about the central relationship.
10
20
Beyond the correlation investigation, this study gauges the frequency domain causality,
allowing to test whether the causality between the focal time-series moves among different
frequency components (accounting for nonlinearity) which the standard Granger causality
test11is unsuitable to accommodate.
We have initially considered the OLS and LAD regression techniques for estimating
the effect of anxiety over Brexit on the focal equities. Nevertheless, we observe an
insignificant dependence in the case of Germany, underscoring the inability of these two
methods to draw firm evidence regarding this issue. By applying then QR and frequency
domain causality test, quite interesting findings have been emphasized. First, the reactions of
UK and EU equities to the disquiet over Brexit are sharply heterogeneous among tail
distributions, highlighting the occurrence of asymmetry. Indeed, the stock market of Germany
suffered more than UK and France. Second, the causal cycle is likely to be longer for
Germany rather than France and UK.
These obtained findings have far-fetching policy implications. They may be used for
portfolio construction and diversification, as variant sensitivities to Brexit event have been
discovered across UK and European equities. The fact that the responses of the investigated
equities change remarkably from lower to upper quantiles and from shortest to longest
frequencies may have profound consequences for portfolios that trade with various
rebalancing horizons. Holding diversified portfolio could palliate risk management. But this is
not usually true, especially if we focus on an uncertain context. Beyond these outcomes, it should be pointed out that Brexit could change the fate of European integration by leading to an unparalleled political disunity and instability in the world.
In a nutshell, this article points out the functionality of QR approach in analyzing “complex” phenomena in an unsettled framework. Similarly, the frequency domain causality test has demonstrated its efficacy in this exercise. Additionally, this paper has proved the
usefulness of search query data (Google Trends and the number of tweets) in determining
how respond UK and EU stock markets to Brexit. Search volume may be perceived as a very
practical way to compute the traders’ investments attention that can help in identifying some
Brexit costs. Before ending, we should mention that these findings remain preliminary and
several extensions appear warranted. It is recommended to conduct further research by
11
21
employing other measures of attention to Brexit with other Internet-based data in the Big Data
Era to confirm our findings and to reach better paths.
References
Balcilar, M., R. Demirer, and S. Hammoudeh, (2010) “What Drives Herding in Oil -Rich, Developing Stock Markets? Relative Roles of Own Volatility and Global Factors,”
North American Journal of Economics and Finance 29, pp. 418–440.
Baur, D. G. and Lucey, B. M., (2010), “Is Gold a Hedge or a Safe Haven? An Analysis of Stocks, Bonds and Gold.” The Financial Review, Eastern Finance Association,
45(2), pp. 217-229.
Bouoiyour, J. and Selmi, R. (2015 a), “Can Bitcoin be a viable solution to Greece’s debt crisis? The role of social media networks.” Working paper, CATT, University of Pau.
Bouoiyour, J. and Selmi, R. (2015 b), “Is the Internet Search Driving Oil Market?” Working paper, CATT, University of Pau.
Breitung, J., and Candelon, B., (2006), “Testing for short and long-run causality: a frequency domain approach.” Journal of Econometrics 132, pp. 363-378.
Cade, B.S. and Noon, B.R. (2003), “A gentle introduction to quantile regression for ecologists.” Frontiers in Ecology and Evolution 1, pp. 412-420.
Damasio, A., (1999), “The Feeling of What Happens.” Harcourt Brace, New York.
Dolan, R-J., (2002), “Emotion, Cognition, and Behavior.” Science, 298 (5596), pp.
1191-1194.
Geweke, J. (1982), “Measurement of linear dependence and feedback between multiple time series.” Journal of American Statistical Association 77, pp. 304-324.
Hood, M. and F. Malik, (2013) “Is Gold the Best Hedge and a Safe Haven under Changing Stock Market Volatility?” Review of Financial Economics 22, pp. 47–52.
Koenker, R. and Bassett, G. (1978) “Regression quantiles” Econometrica 46 (1),
22
Koenker, R., and Xiao, Z. (2002). “Inference on the quantile regression process.” Econometrica, 70(4), pp. 1583-1612.
Kristoufek, L., (2013), “Bitcoin meets Google Trends and Wikipedia: Quantifying the relationship between phenomena of the Internet era.” Scientific Reports 3 (3415), 1-7.
Mishra, P. K., Das, J. R., and Mishra, S. K. (2010) “Gold price volatility and stock market returns in India,” American Journal of Scientific Research, pp. 47-55.
Mitchell, A., T. Rosenstiel and L. Christian (2012), “What Facebook and Twitter Mean for News.” Pew Research Center, Annual Report on American Journalism: The State of the News Media 2012.
[image:23.595.105.511.369.633.2]Appendix
Figure A.1. Countries of origin for EU FDI stock in UK (in USD millions)
Source: UNCTAD Bilateral FDI Statistics.
Netherlands, 227. 398
Germany, 123.798
France, 102.848 Luxembourg, 86.4
84 Spain, 66.202
Belgium, 50.913
Ireland, 22.016 Italy, 13.915
Swedan, 12.348 Denmark, 9.317