Munich Personal RePEc Archive
The postwar growth slowdown and the
path of economic development
Huang, Kaixing
School of Economics, Nankai University
1 December 2016
Online at
https://mpra.ub.uni-muenchen.de/80988/
1
The Postwar Growth Slowdown and the Path of Economic Development
By Kaixing Huang*
Although the persistent slowdown in the growth of per capita output has been observed in
virtually all industrialized countries since the early 1970s, no persuasive theoretical explanation for
this phenomenon has been given. This paper constructs a modified endogenous growth model that
indicates the slowdown is part of the natural process of economic development. Specifically, the
model predicts that each economy develops along a path characterized by Malthusian stagnation,
economic take-off, demographic transition, growth slowdown, and steady-state. The persistent
slowdown in growth indicates that even the most developed countries are not in their steady-state yet,
and their future growth could be slower. (JEL E27 O40)
Keywords: Growth slowdown, ideas, human capital, population
*
2
The slowdown in the growth of per capita output has been observed in virtually all industrialized
countries since the early 1970s, and it continues to be a significant source of concern for economists
and policy makers (Fischer 1988, Gordon 2013, Antolin-Diaz, Drechsel, and Petrella 2017).
Although the causes of the slowdown have been extensively analyzed, it continues to remain
somewhat of a puzzle: a wide variety of explanations have been offered, with little consensus as to
the clear-cut culprit. Previous explanations include the oil price shock of 1973 (Jorgenson 1988),
measurement problems (Baily and Gordon 1988), changes in the quality of the labor force (Bishop
1989), and exhaustion of important innovations (Gordon 2016). Most of the existing investigations
have been conducted outside the context of explicit models of economic growth, and none of them
are persuasive enough to prevent searching for other explanations.1
The current paper hypothesizes that the widespread slowdown of growth, which has lasted for
more than 40 years since the early 1970s (see Section IV), is because of the fundamental mechanism
of long-run economic growth, not any transitory exogenous shocks. Identifying the fundamental
cause of the ongoing long-run growth slowdown has tremendous value both for growth theory and
policy. Providing a persuasive theoretical explanation for the growth slowdown is difficult because if
it is to be believed the slowdown reflects the mechanism of long-run economic growth, then it must
be explained together with other early stylized facts of economic growth: a growth theory that
explains the slowdown but that is inconsistent with other stylized facts cannot be persuasive.
Figure 1 presents the stylized facts that need to be explained together with the postwar growth
slowdown. Over most of history, human society was locked into Malthusian stagnation with minimal
growth in the population and negligible growth in the standard of living. But both “took off” in the
first half of the nineteenth century as a spectacular growth in the population matched a rapid growth
in per capita income. After long-run increases, the growth rate of the population peaked at the
1
3
beginning of the twentieth century and declined since then, and the growth rate of per capita income
peaked in the second half of the twentieth century and declined since then. In summary, the stylized
facts of economic development include Malthusian stagnation, economic take-off, demographic
transition, and growth slowdown.
An analyzation of the existing growth theory reveals no candidate that can be directly applied to
reconcile the growth slowdown with other stylized facts as presented in Figure 1. Malthus’ (1798)
classical growth theory does indicate a growth slowdown because it assumes income growth will
cause a population explosion that in turn will reduce income to the subsistence level, but it is
inconsistent with the simultaneous growth of the population and income seen over the last two
centuries. Neoclassical growth models have the potential to explain short-term slowdowns with
diminishing returns,2 but they do not provide a sufficient explanation for the increasing growth over
the long run, as noted by Romer (1986). Although the endogenous growth models, such as Romer’s
(1990) and Grossman and Helpman’s (1991), are successful in explaining the increasing growth
observed during the vast majority of modern history, the postwar slowdown has been viewed as
something of a stumbling block for them. These models contain “scale effects” in the sense that,
other things being equal, the growth rate of per capita income is proportional to the level of resources
devoted to R&D. Given the continual increase in the amount of resources devoted to R&D activities
throughout the postwar period (Jones 1995b), these models actually predict increasing postwar rates
of growth.3
Jones’s (1995a) semi-endogenous growth model does suggest the possibility of accounting for
2
It is possible to partly explain the postwar growth slowdown with the transitional dynamics of the neoclassical model: the war induced a decline in physical capital stock, leading to high postwar growth, and the growth rate declined with capital accumulation. However, as Shigehara (1992) points out, the neoclassical growth model cannot account for the bulk growth slowdown since the 1970s. Most computational evidence indicates that the pace of convergence in the neoclassical model is very rapid. For example, King and Rebelo (1993) finds that, for appropriate parameters, the half-life of convergence is only 6 years. Therefore, it is difficult to explain the 40-year postwar growth slowdown using the transitional dynamics of the neoclassical model.
3 Similar criticism applies to the “AK”
4
the postwar growth slowdown together with other early stylized facts. It eliminates the counterfactual
scale effect prediction of endogenous growth models and predicts that, other things being equal, the
growth rate of per capita income is proportional to the growth rate but not the level of resources
devoted to R&D. It implies that, holding equal the percentage of people engaged in R&D and
holding the research productivity of each people, the growth rate of income is proportional to the
growth rate of the population. On the other hand, holding the number of people engaged in R&D at
the same level, the growth rate of income is proportional to the growth rate of research productivity.
Therefore, the first increasing and then decreasing growth of the population has the potential to
explain the first increasing and then decreasing growth of income. In addition, growing research
productivity, as indicated by the increasing years of schooling, could explain why the slowdown in
income growth occurred much later than the slowdown in population growth (see Figure 1).
However, because population and human capital are exogenous in the semi-endogenous growth
model, the above explanation is only an unverified hypothesis based on historical observation. It is
also possible that these contemporary observations are just a coincidence or that the dynamics of
income growth is the cause, but not the result, of the dynamics of population and human capital
growth. To explore the possibility of explaining the growth slowdown and other stylized facts using
the dynamics of population and human capital, it is imperative to develop a growth model with
endogenous population and human capital.
This paper develops a modified endogenous growth model with an endogenous population,
human capital, and technology to explain the growth slowdown together with other early stylized
facts. The model follows Jones (1995a) in its elimination of the counterfactual scale effect prediction
of the early endogenous growth models and follows Becker, Murphy, and Tamura (1990) to model
the endogenous growth of the population and human capital. In the model, utility-maximizing
parents choose the number of children and the human capital investment in each child to maximize a
5
and human capital, and the growth of population and human capital determines the growth of
technology and income, which in turn alter parents’ decisions regarding the quantity and quality of
their children. The endogenous interactions among population, human capital, technology, and
income generate a path of development characterized by Malthusian stagnation, economic take-off,
demographic transition, and growth slowdown.
The rest of this paper is organized as follows: Section I sets out the basic assumptions of our
analysis and derives its main implications in an informal way. Section II outlines the model. Section
III details the model’s prediction regarding the path of economic development and illustrates that the
growth slowdown is a natural part of the process of economic development. Section IV empirically
supports the model’s predictions, especially the growth slowdown, using long-run time series data
from 18 advanced OECD countries. Section IV contains concluding remarks.
I. Basic properties of the model
The model is built on a natural rule of the creation of ideas: given the percentage of people engaged
in R&D, the number of new ideas discovered is proportional to the size of the population and the
level of human capital of each person. The literature has long recognized that given the chance of
inventing something by each person, in a larger population, there will be proportionally more people
lucky or smart enough to come up with new ideas (Kuznets 1960, Simon 1977). On the other hand, a
person with a higher level of human capital is more likely to advance the technological frontier
(Phelps 1966, Easterlin 1981). This rule of ideas creation implies that the growth rate of technology
is an increasing function of the growth rate of the population and the growth rate of human capital.
As Romer (1986) points out, ideas are non-rivalrous in the sense that the use of an idea by one
person does not preclude, at the technological level, the simultaneous use of the idea by another
person. Increasing return in the production function for aggregate output introduced by the
6
output (Phelps 1966, Romer 1990).
Nevertheless, the current paper stresses that the positive effect of the growth of ideas on income
growth depends on human capital accumulation. Human capital is ideas embodied in physical labor
through education or training (Lucas Jr 1988, Becker, Murphy, and Tamura 1990). Although ideas
are non-rivalrous, individuals still cannot use ideas discovered by others to enhance productivity
before they learn how to use these ideas through human capital accumulation. For example, it is
unlikely to significantly improve the productivity of a primitive tribe by just providing them with
books documenting the latest ideas of production of modern societies. At the very least, this tribe
would have to be taught how to read these books and then encouraged to learn the ideas documented
within; this learning process is human capital accumulation. Therefore, a lack of human capital
investment will limit the positive effect of the growth of ideas on income growth by limiting
technology diffusion.
The model also assumes that the rate of return to human capital investment increases with the
speed of technological progress. At least since Schultz (1964), economists have recognized that
returns to formal schooling will be high when rapid technological progress limits the time available
for the informal learning by observation to function. This assumption has been empirically supported
by Foster and Rosenzweig (1996) and theoretically modeled by Nelson and Phelps (1966) and Galor
and Weil (2000).
Following Becker, Murphy, and Tamura (1990), the current paper assumes an
overlapping-generations economy in which identical parents choose the number of children and the
human capital investment in each child to maximize a dynastic utility function. The utility is derived
from both the consumption and the utility of each child. Combining this assumption with the above
assumptions indicates endogenous interactions among population, human capital, technology, and
per capita output. First, parents’ utility-maximizing behavior determines the growth of the population
7
human capital determines the growth of technology and income; and third, technological progress
and income growth alter parents’ utility-maximizing behavior by raising the rate of return to human
capital investment and by raising the opportunity costs of time spent on the production and rearing of
children.
It is this endogenous interaction that generates the path of economic development depicted in
Figure 1. Specifically, at the early stage of economic development, parents can only afford to have a
small number of children because of the low labor productivity, and hence, the growth rate of the
population is small.4 Since the growth rate of technology is an increasing function of the growth rate
of population, a small population growth rate implies a small technology growth rate. Because the
rate of return to human capital investment increases with the speed of technological progress, parents
do not invest in the human capital of their children when the growth rate of the population, and hence
the growth rate of technology, is too small. The absence of human capital investment limits the
diffusion of technology.5 Both the small growth rate of technology and the inefficiency of
technology diffusion determine the thousands of years of Malthusian stagnation that came with
negligible growth of population, technology, and per capita output.
Nevertheless, as long as new technologies are created and diffused, labor productivity and the
growth rate of the population will increase.6 A higher population growth accelerates technological
progress and leads to higher rates of return to human capital investment that eventually induces
parents to invest in the human capital of their children. Positive human capital investment not only
accelerates the growth of technology, but also enhances the efficiency of technology diffusion.
Economic take-off occurs as a result and the growth rates of population, human capital, technology,
4
It is worth pointing out that the fertility rate was actually quite high during Malthusian stagnation, but because of the high mortality rate at the same time, the number of children who survived was very small.
5
See Section III.A for a detailed discussion of the inefficiency of technological diffusion when there is no human capital investment.
6
8
and per capita output increase simultaneously over time after that.
However, because the production of children and human capital investment are time-intensive,
the growth rates of the population and human capital cannot increase forever. Continually rising rates
of return to human capital investment motivate parents to have fewer children and to invest more in
the human capital of each child, and this substitution effect ultimately leads to the decline of the
population’s growth rate. Declining population growth imposes a negative effect on the growth rate
of technology. In addition, the growth rate of human capital also tends to decline when the level of
human capital is very high and when the time invested in human capital is bounded. The declining
growth of both the population and human capital leads to the slowing of technological growth and
hence to the slowing of per capita output growth. The economy eventually converges into a
steady-state with a constant population growth rate and a constant human capital investment.
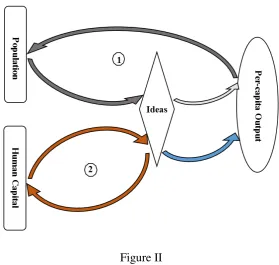
The mechanism of economic development described here can be summarized by the two virtuous
circles in Figure 2. Circle 1 is the virtuous circle of population growth: population growth spurs
technological progress, and the growth of technology leads to the growth of per capita output, which
in turn enhances population growth through the income effect. Circle 2 is the virtuous circle of
human capital accumulation: human capital accumulation enhances technology progress, which in
turn induces more human capital investments by raising the rate of return to those investments.
Initially, Circle 2 is not functioning, and Circle 1 is very weak because technology diffusion is
inefficient. But the weak Circle 1 eventually triggers Circle 2, which in turn strengthens Circle 1 by
promoting the diffusion of technology, and economic take-off occurs. However, further economic
development induces parents to make a trade-off between these two virtuous circles, and it
eventually leads to the declining population growth and the declining technology and income growth.
The model depends heavily on the insights of previous theoretical studies. As will be shown in
the next section, we have modified the ideas-based growth model of Jones (1995a), which is
9
capital following the method proposed by Becker, Murphy, and Tamura (1990). In addition, this
model adopts several critical assumptions from the unified growth model of Galor and Weil (2000).
They developed the first unified growth model that can explain wholly Malthusian stagnation,
economic take-off, and demographic transition. Complementary to Galor and Weil (2000), the
current paper extends the unified growth model to include the more recent, ongoing growth
slowdown.7
II. A simple ideas-based growth model
Consider an overlapping-generations economy in which identical agents live for two periods:
childhood and adulthood. An adult chooses the number of children nt at the beginning of his or her
adulthood. The production and rearing of children are expensive and time-intensive. We assume each
child consumes fixed hours e of his or her parent’s working time and consumes fixed units f of
goods. Each adult is endowed with T hours of working time that can be spent on producing
consumer goods, rearing children, and investing in the human capital of children. Children spend all
their time on human capital accumulation.
A single consumption good Yt is produced using technology At, labor Lt, and physical capital
t
K . Physical capital is accumulated consumer goods that do not wear out. The consumer goods are
produced according to a Cobb-Douglas production function in which technology is labor-augmenting,
as follows:
1
t t t t t t t t
Y A L K C K N n f , (1)
7
10
where
0,1 is a constant, Ct is the total consumption of generation t, Kt is the netinvestment in physical capital, and Nt is the number of adults. The production function can be
written in per capita terms by dividing both sides by the number of adults:
1
/
t t t t t t t t t
Y N y c k n f A l k , (1)
in which yt is the per capita output, lt is the per capita time spent on production, and kt is the per
capita physical capital.
The creation of new ideas is the driving force of long-run per capita income growth. We modify
the research functions of Jones (1995a) and Jones (2002) to obtain a research function in which the
number of new ideas discovered each period At is proportional to the total amount of human capital
spent on searching for new ideas Ht:8
t t t t t t
A H A h N sT A
, A0 0 given, (1)
that
1,
0, 0, and 0 s 1. The research equation assumes that each identical adultspends a constant share s of working time on searching for new ideas.9 As shown on the far-right
side of equation (1), Ht is proportional to the human capital of each adult (ht), the number of adults
(Nt), and the time each adult spends on searching for new ideas (sT ). Underlying research equation
(1) is the natural rule of ideas creation, stating that the amount of new ideas discovered is
proportional to the size of the population and the level of human capital.
Note that research equation (1) accommodates a wide range of beliefs regarding the determinants
of the research output. Specifically, it allows each person’s research productivity to decrease with
8
To present the long-run dynamics of economic development in the clearest fashion, this model abstracts from many of the important insights of the previous ideas-based growth models, such as the decentralized model specification with intermediate sectors, vertical and horizontal product differentiation, and the uncertainty of innovation.
9
11
(0
1), increase with (
1), or be independent of (
1) the population; it also allows the rateof innovation to decrease with (
0), increase with (0
1), or be independent of (
0)existing technology.
New ideas will be discovered ( At 0) as long as the total amount of human capital spent on
searching for new ideas is positive (Ht 0). However, as argued by Jones (1995a), the growth rate
of ideas asymptotically approaches zero in the long run if there is no growth in the population and
human capital. To see why, divide both sides of equation (1) by At to get the growth rate of ideas:
1
t t t
At
t t
h N sT A
g
A A
. (1)
Because 1
0, the denominator At1 increases over time when At 0. If the numerator
h N sTt t
is constant, the growth rate of ideas gAt asymptotically approaches zero.
The necessary condition for the persistent growth of ideas is the persistent growth of population
and human capital. Taking the logarithm of equation (1) and differentiating it with respect to time,
the growth rate of ideas becomes an increasing function of the growth rates of the population (gNt)
and human capital (ght) and becomes a decreasing function of the proportional changes in the
growth rate of ideas (gAt gAt ):
1 AtAt Nt ht
At
g
g g g
g
, (1)
with
1
. Because the growth rate of per capita output is approximately equal to thegrowth rate of ideas (gyt gAt),10 we obtain that the growth rate of per capita output is an increasing
10
12
function of the growth rate of population and the growth rate of human capital.
From equation (1) we can also obtain that the level of technology is proportional to the size of the
population and the level of human capital per capita:
1At
t t t
A b h N g , (1)
Combining equation (1) and equation (1) implies that per capita output is proportional to the size of
the population and the level of human capital of each person.
We follow Lucas Jr (1988) and Becker, Murphy, and Tamura (1990) in seeing human capital as
ideas embodied in physical labor through education or training and assume that the human capital of
children is accumulated according to a learning technique with the positive externality of the parental
level of human capital:
1 0
t t t
h h z h , (1)
with constants 0
1, 0, and h0 0. The human capital of a child ht1 depends on theparental human capital ht, the time that a parent invests in the human capital of each child zt, and
the endowed human capital at birth h0.11
We follow Becker, Murphy, and Tamura (1990) to assume that altruistic parents choose the
number of children (nt) and the human capital investment in each child (zt) to maximize a dynastic
utility function:
and physical capital kt, per capita labor input lt can be approximately seen as constant, so we have gAtgktand
1
yt At kt At
g g g g .
11
Human capital (ht) does not directly enter into the production function (1) but enters through At instead, as can be
seen by transforming equation (1) to get
1At
t t t
A b h N g . This model specification helps avoid the problem of
“double-counting” human capital and keeps the model simple. We can also assume a separate human capital term in the Cobb-Douglas production function in the form of an “effective workforce,” such as 1
t t t t t
Y A h L K. To do so will not change the implication of the model because the separate human capital term can be combined with the human
capital term that already exists in At to get
1
1 At
t t t
A bhN g , and the production function becomes
1
t t t t
13
1t t t t t
V u c a n n V . (1)
The dynastic utility of a parent Vt depends on his or her consumption ct, the degree of altruism per
child a n
t , the number of children nt, and the utility of each child Vt1. The dynastic utility function is simplified with the following:
t ,
t t t
c
u c a n n
, (1)
where 0 1,0 1, and 0. Parents maximize the utility function subject to the following
time and budget constraints:
1s T
lt n e zt
t
, (1)1
t t t t t t
c A l k k n f . (1)
The arbitrage condition between per capita consumption in periods t and t1 is
1 1 1 1 1 t tt zt zt
t t
u c c
n R r
au c c
(2)
where rzt is the rate of return on investment in human capital, and equality holds when investments
are positive. To calculate the rate of return, we rewrite the Bellman equation using the learning
technology (1), the time constraint (1), and the budget constraint (1) to yield the following:
1 1 1 1 1 0 1 1 1 1max t t t t t t t t t t
t t
t t t
bh N s T n e n h h n h h k k
V h
n V h
. (2)
Here, we apply the simplification assumption of
1. Differentiating (2) with respect to ht1and using the envelope theorem, we get that the rate of return is determined from the following:
1 1 1
zt t t t t
R
n l n z . (2)Because the rate of return measures the effect on ct1 of increasing ht1, it depends on the
14
functions of the ideas, consumer goods, and human capital.
By differentiating the utility function with respect to nt, we get the first-order condition for
maximizing the utility with respect to the number of children:
1 1
1 1
1 n Vt t ht u c t A lt t kt ezt f . (2)
The marginal utility from an additional child is given on the left-hand side of equation (2) while the
right-hand side gives the total costs of producing and rearing a child. Costs depend on the
productivity of labor (A lt t 1 1kt), the fixed time (e) and goods ( f ) inputs, and the endogenous
time spent investing in each child (zt ).
For the non-corner solution with a positive human capital investment, the first-order condition
with respect to the investment is obtained by differentiating the utility function with respect to zt:
1 11 1
t
t t t t t t
t
dV
n h u c A l k
dh
. (2)
The marginal utility of an additional unit of time spent investing in children’s human capital is given
on the left-hand side of equation (2) while the right-hand side gives the marginal costs of time.
III. The path of economic development
This section shows how the model explains the growth slowdown and reconciles it with other early
stylized facts of economic development. Specifically, the model predicts that the growth rate of the
population (gNt), the level of human capital investment (zt), and the growth rate of per capita output
(gyt) evolve along the paths depicted in Figure 3. The period before time t1 represents the
thousands of years of Malthusian stagnation during which gyt, gNt, and zt are extremely small.
These three variables take off from t1 and experience long-run increases after that. The growth rate
15
and declines after that. The level of human capital investment increases over time since t1. These
three variables eventually level off when the economy settles down to its steady-state.
Subsections A and B detail the model’s predictions about the path of economic development and
explain the endogenous transition from one stage to the next along the path. Subsection C extends
the model’s predictions regarding the path of economic development to countries sharing technology.
Subsection D briefly compares the model’s predictions with the literature.
A. Malthusian stagnation and economic take-off
During the early stages of economic development, labor productivity as measured by the stock of
technology (At) is quite low. Parents can only afford to have a small number of children because the
production and rearing of children are expensive and time-intensive. A sufficiently small number of
children (n) lead to the strict inequality of the arbitrage condition (2):12
1
1
n l
, (2)
which means the rate of return to human capital investment is too low, and the economy is located in
a corner solution in which parents do not invest in the human capital of their children (zt 0).
Underlying this implication is the model’s assumption that the rate of return to human capital
investment increases with the rate of technological progress. According to equation (1), the growth
rate of technology is an increasing function of the growth rate of the population. A small number of
children means a small growth rate of the population (gNt nt 1),13 which implies a small growth
12
Empirical evidence indicates that the ratio ct1 ct is approximately equal to one during Malthusian stagnation.
According to Lee (1980) and Maddison (1982), the standard of living was roughly constant during the thousands of years of Malthusian stagnation. Therefore, the combination of the model’s coefficients should be in the way that when the number of children is small, the marginal rate of return to children is high enough so that the small growth in labor productivity will mainly be reflected in the growth of the number of children but not in the growth of per capita consumption.
13
16
rate of technology and hence a low rate of return to human capital investment. Parents do not invest
in children’s human capital when the rate of return is too low.
In the corner solution with no human capital investment, the level of human capital equals the
constant endowment at birth (ht h0), and new technologies will still be created each period
according to the following:
0
t t t
A h N sT A
. (2)
However, no human capital investment implies that ideas created by one person cannot be efficiently
learned and adopted by others. This is because human capital investment such as school education
represents an efficient way for disseminating ideas that have been collected and documented between
individuals who would have no intellectual contact otherwise. This view is in line with the
understanding that education speeds up technology diffusion (Nelson and Phelps 1966). Without
human capital investment, new ideas only spread slowly through informal observation but not
through the more efficient formal learning. Therefore, although ideas are non-rivalrous, a growth in
ideas does not lead to a corresponding growth in per capita output.
To show this in detail, we assume At is the amount of new ideas learned by the average agent
and At At is the share of new ideas learned, which measures the efficiency of technology
diffusion. If the diffusion of technology is perfect, we have 1 and At At. In this case, the
growth rate of per capita output is approximately equal to the growth rate of ideas. However, if no
human capital investment is present and each agent can only learn by observing the production
behavior of adults who have intellectual contact with them (mainly their parents), the amount of new
ideas learned by the average agent is the following:
17
0
t t t
A h N sT A
, (2)
where Nt is the number of adults who have intellectual contact with the average agent. During
Malthusian stagnation when there was no human capital investment, Nt could be negligible relative
to Nt; hence, the efficiency of technology diffusion was extremely low:
0 0
t t t
t t
t
t t
h N sT A N
A A
N
h N sT A
. (2)
The growth rate of per capita output is approximately equal to times the growth rate of ideas:
t t yt At t t A A g g A A
. (2)
Therefore, the economy was locked in Malthusian stagnation for thousands of years not only because
of the extremely small growth rate of technology when the population growth rate was small, but
also because of the extreme inefficiency of technology diffusion when there was no human capital
investment. The virtuous circle of human capital accumulation was not functioning while the
virtuous circle of population growth was limited by the inefficiency of technology diffusion. The
growth of population and per capita output was extremely small (see evidence from Tables 1 and 4)
and the growth of living standards was even smaller because the growth of per capita output was
mainly reflected in the growth of the number of children.
Nevertheless, as long as individuals have intellectual contact with others (i.e., 0), the weak
virtuous circle of population growth still gradually enhances the growth rate of the population, even
during Malthusian stagnation. Specifically, although extremely small, a growth in ideas leads to a
growth in per capita output, and a higher output allows parents to have more children, hence
accelerating population growth, which in turn accelerates the growth of ideas. The prediction of
accelerating population growth during Malthusian stagnation is consistent with long-run historical
18
the growth rate of the world’s population has been observed from 1,000,000 B.C. to 1750.14
Increasing population growth eventually triggers economic take-off. Inequation (2) is reversed
when the growth rate of the population is high enough and when parents start to invest in the human
capital of their children. Positive human capital investment activates the virtuous circle of human
capital accumulation: human capital investment enhances the growth of technology, which in turn
induces more human capital investment by raising the rate of return to investment. More importantly,
it also strengthens the virtuous circle of population growth by improving the efficiency of technology
diffusion. These two virtuous circles reinforce each other and generate the dramatic increasing
growth of population, human capital, technology, and per capital output.
The historical data presented in Figure 1 support the model’s predictions that a) increasing
population growth triggers economic take-off, b) economic take-off is accompanied by the rising of
human capital investment, and c) the per capita growth rate enters a long-run increasing trend after
economic take-off. Specifically, the data show that a) significant accelerating growth of per capita
real GDP occurred at the beginning of the nineteenth century, but the annual growth rate of the
population had increased from 0.095 percent to 0.454 percent during the eighteenth century; b) years
of total schooling by birth cohort had increased from 1.8 in 1800 to 6.0 in 1900 and to 11.3 in 1970;
and c) the annual growth rate of per capita real GDP increased from 0.11 percent in 1800 to 1.55
percent in 1900 and to 4.68 percent in 1970.
B. Demographic transition, growth slowdown, and steady-state
Because the production and rearing of children are time-intensive, the growth rate of the population
cannot increase forever. Utility-maximizing parents choose the optimal time allocation among
investments in the quantity and quality of children and the production of consumer goods subject to
time constraints (1). Increasing labor productivity generates an income effect that eases parents’
14
19
budget constraints, allowing them to spend more time to have more children. On the other hand,
increasing labor productivity raises the opportunity cost of time and generates a substitution effect
that induces parents to shift time from investing in the quantity of children to the production of
consumer goods. In addition, accelerating technological progress enhances the rate of return to
human capital, hence generating a substitution effect that induces parents to shift time from investing
in the quantity to the quality of their children. These two substitution effects grow over time and
eventually overcome the income effect, leading to a declining population growth.
To see this formally, first assume human capital investment as a constant and focus only on the
substitution effect of increasing labor productivity. At the beginning, the opportunity cost of time
spent on children production (e) is relatively small, and the main cost is the fixed goods cost ( f ),
such as expenses on food, clothing, and housing. The income effect dominates the substitution effect
when time cost is low and the goods cost is high, as determined from
1 1 1
t t t
f
e A l k f , (2)
where e A l t t 1 1kt measures the time cost. During this period, higher income allows parents to
allocate more resources toward producing a larger number of children, so population growth
accelerates. On the other hand, higher population growth accelerates the growth of technology and
the growth of labor productivity. Continually rising labor productivity (A lt t 1 1kt) eventually
reverses the inequality in (2). As a result, parents choose to invest less in the quantity of children, so
the growth rate of the population declines.
Therefore, even without the substitution effect of human capital investment, the endogenously
growing opportunity cost of time will eventually lower the growth of the population. Nevertheless,
the substitution effect of human capital investment still plays a significant role in shaping the path of
20
capital caused by the substitution effect implies the growth rate of per capita output will continue to
rise at least for a while after the decline of the population growth rate, as in Figure 1. To see this, we
take the first-order derivative of equation (1) with respect to gAt and obtain:
1 At At
At ht Nt d g g
dg dg dg
dt dt dt dt
. (2)
At tt2, which is the turning point of population growth rate (see Figure 3), we have
2 2 0
ht
dg dt
and
2 2 0
Nt
dg dt . If gAt is not strictly convex at t2, we have
2 2 2 0
At At
d g g dt . Therefore,
we have dgAt dt0 at t2. The inequality dgAt dt0 must hold for at least some small increases
in time from t2. Therefore, the growth rate of per capita output gyt, which is approximately equal to
At
g , will increase at least for a while after t2.
However, the increasing trend of the income growth rate will eventually be reversed when the
negative growth effect of the declining population growth overcomes the positive growth effect of
increasing human capital growth. In addition, time invested in human capital will eventually level off
considering the time constraint of individuals, and this will lead to a constant or declining growth of
human capital. To see this, we write the growth rate of human capital as the following
0 1
0
1 if 0 1
1 if 1
t t t ht t t z h h h g h z h
. (2)
If 0
1, a constant investment (zt z) corresponds to a declining growth of human capitalbecause 1
t
h is increasing. In this case, the slowdown of income growth is because of the declining
growth of both the population and human capital. If choosing the knife-edge assumption
1, aconstant investment corresponds to a constant growth rate of human capital. In this case, the
21
growth overcomes the positive growth effect of the increasing human capital growth.
The economy eventually converges to a steady-state growth path with a constant time invested in
each child’s human capital (z*), a constant number of children per parent (n*), and a constant
growth rate of per capita output (g*y ). The steady-state values z* and n* are determined from the
first-order conditions, as shown in equations (2) and (2). In the steady-state equilibrium, the time
spent investing in each child’s human capital is the following:
* 1 e z
(2)
The equilibrium education level of a child rises with the labor share of total output (
), the elasticityof consumption ( ), the fixed time cost of children rearing (e), and the elasticity of altruism per
child ( ). The steady-state number of children is found by substituting into equations (2) and (2):
1
1 * 1 * *
1 1
n g s T en
. (2)
The steady-state growth rate of per capita output is equal to the growth rates of consumption,
physical capital, and technology, and is proportional to the sum of the growth rates of the population
and human capital:
* * * * * *
y c k A h N
g g g g g g . (2)
The growth rate of the population is g*N n*1, and the growth rate of human capital is the
following
*
*
0 for 0 1
1 for 1
h g z
. (2)
For 0
1, the steady-state growth rate of human capital is zero, so the growth rate of per capitaoutput depends only on the growth rate of the population. This prediction is in line with previous
22
growth rate of per capita output depends both on the growth rate of the population and the level of
human capital investment.
The steady-state technological level is proportional to the size of the population and the level of
human capital:
1* * * *
t t t A
A b h N g , (2)
and the steady-state per capita output is proportional to the level of technology:
1 * 1 * 1 * 1
* * * 1
1
t t t t
y A l k l A . (2)
Therefore, the steady-state per capita output is proportional to the level of human capital and the size
of the population.
C. The path of economic development for countries sharing technology
To analyze the mechanism of economic development in the clearest fashion, the model of this paper
assumes an economy that has no intellectual contact with the outside, so all technologies are invented
domestically. In the real world, however, countries share technology. This subsection extends the
model’s prediction regarding the path of economic development to countries sharing technology. It
shows that although international technology diffusion has significant effects on economic
development, the model’s prediction regarding the path of economic development can be extended to
countries sharing technology.
For an economy that can import technology from outside, economic take-off no longer must be
triggered by increasing domestic population growth. The model predicts that increasing population
growth triggers economic take-off by accelerating technological progress. In this sense, events such
as opening up to international trade and wars of conquest also have the potential to trigger economic
23
population; this has similar effects on technological progress as increasing domestic population
growth does.
Nevertheless, economic take-off is still accompanied by significant increases in human capital
investment because it is a necessary condition for the learning and use of the imported technologies.
The increasing population growth and the subsequent demographic transition will still be observed
because of the income effect of economic growth and the substitution effect of human capital
investment. However, because there is a large stock of pre-existing technology available for the
less-developed countries to import, the population growth rates in these countries could be much
higher because of the income effect generated by the imported technology. In addition, the imported
technology also raises the rate of return to human capital investment and generates a higher
substitution effect that may reduce the period of increasing population growth.
The growth rate of per capita output still increases first, then declines, and eventually converges
to a steady-state. Historically, economic take-off first occurred in Western European countries and
their offshoots at the beginning of nineteenth century. These countries shared technology and
developed at a generally similar pace (see Figure 4), so they can be taken as a whole when analyzing
the path of economic development. In addition, these countries were mainly the exporters of
technology when interacting with the rest of the world after their economic take-off. Therefore, the
mechanism of the model (the rule of ideas creation and the two virtuous circles) applies to these
countries as a whole, and each shares the same path of per capita growth rate as predicted by the
model.
For the second group of countries that “catch up” later, such as South Korea and Singapore, the
path of per capita growth rate is deeply affected by the large stock of pre-existing technology
invented by the first group of countries. The pre-existing technology enables these countries to grow
faster and catch up. Because these countries take up a relatively small share of the world economy
24
take-off. Consequently, the slowdown of technological progress in the first group inevitably leads to
the slowdown of growth in the second group. Therefore, per capita growth in these countries still
increases first and then declines before converging to the steady-state.
The last group of countries, including China, India, and other developing countries, have mainly
been the importers of technology over the last two centuries. Similar to countries in the second group,
they grew much faster than the first group because of the large stock of pre-existing technology. The
difference is that these countries together will have a large economic size after they catch up, so they
have the potential to reverse the trend of the global technological growth rate in the future. If this
happens, the growth rates in countries of the first and second groups will rebound before declining
again. Nevertheless, the growth rates in these countries will still decline and eventually converge to a
steady-state as determined by the mechanism proposed in this paper.
To sum up, the model’s prediction regarding the path of economic development can be extended
to countries sharing technology. Specifically, each country generally develops along the path of
Malthusian stagnation, economic take-off, demographic transition, growth slowdown, and
steady-state. The only possible exception is that if the currently developing countries become leaders
in technological progress in the future, the declining per capita growth rates in currently developed
countries will rebound before declining again.
D. Discussion
This subsection briefly compares the model’s predictions of Malthusian stagnation, economic
take-off, and steady-state with the literature. First, the current paper explains Malthusian stagnation
by the extremely slow growth of technology and the inefficiency of technology diffusion, but
previous studies usually follow Thomas Malthus (1798) to explain Malthusian stagnation by the
existence of a fixed factor of production that reduces labor productivity when the population grows.
25
Malthusian stagnation and the modern growth regimes and physical capital is unlikely fixed in
modern production. Nevertheless, extending the model to include fixed production capital does not
substantially alter our explanation of Malthusian stagnation and economic take-off. To see this,
assume that the physical capital in production function (1) is in fixed supply (Kt K), so per capita
output becomes the following:
1
1 1
1
/ t
t t t t t t t t
t t
A K
Y N y A l l K B l K
N N
, (2)
where Bt At Nt1 . Compared to equation (1), the main difference is that the growth effect of
technological progress is partly offset by the dilution effect of population growth:
1
Bt At Nt
g g g , (2)
in which gAt measures the positive growth effect of technological progress while
1
gNtmeasures the negative dilution effect of population growth. Therefore, the existence of fixed
production capital further stabilizes Malthusian stagnation but does not change the explanation of
economic take-off as long as the virtuous circle of population growth is still functioning (i.e.,
1
).
Second, the current paper indicates that economic take-off is triggered by the endogenous rising
of the growth rate of the population while Galor and Weil (2000) and others believe that it is
triggered by the rising level of population. This difference arises directly from the understanding of
the effect of population growth on technological progress. The current paper assumes, other things
being equal, the number of new ideas discovered is proportional to the size of the population, but
Galor and Weil (2000) assumes the growth rate of ideas is proportional to the size of the population.
This difference is clearly reflected in choosing the value of in equation (1). We assume
1;therefore, the number of new ideas discovered is proportional to the size of the population. By
26
ideas ( 1), we obtain that the growth rate of ideas is proportional to the size of the population:
t
At t t
t
A
g h N sT
A
. (2)
The current paper follows Jones (1995a) to assume 1, which allows the rate of innovation to
decrease with (
0), increase with (0
1), or be independent of (
0) existing technology.This is mainly because empirical evidence from developed countries over the last half century
strongly rejects the assumption that the growth rate of technology is proportional to the size of the
population (Jones 1995b). Interestingly, the unified growth model of Galor and Weil (2000) can be
extended to include the growth slowdown if we relax the knife-edge assumption that the new ideas
discovered are strictly linear to the stock of ideas.
Finally, the current paper indicates the modern history of economic growth reflects the transition
dynamics rather than the steady-state, but previous theoretical models are nearly always constructed
so as to generate a steady-state growth path. The current paper predicts that each economy develops
along the path characterized by Malthusian stagnation, economic take-off, demographic transition,
and growth slowdown, and eventually converges to the steady-state when the population growth rate
and human capital investment are constant. Empirical data from each of the 18 advanced OECD
countries (see Section IV.A) show that the population growth rate is still declining and that human
capital investment is still increasing. Therefore, consistent with the declining trend of per capita
output growth rate observed currently (see Table 3), the current paper indicates that even the most
developed countries are not in their steady-state yet and their future growth could be slower.15
15
27
IV. Empirical evidence
This section extends the empirical evidence presented in Figure 1 to each of the following 18
advanced OECD countries: Austria, Belgium, Canada, Denmark, Finland, France, Germany, Greece,
Italy, Japan, the Netherlands, Norway, Portugal, Spain, Sweden, Switzerland, the United Kingdom,
and the United States.16 Subsection A visually presents the country-level dynamics of population
growth rate, income growth rate, and human capital investment from 1800–2015. Subsection B
econometrically identifies the ongoing postwar growth slowdown and the early stylized facts of
Malthusian stagnation and accelerating per capita growth.
A. An overview of long-run economic development
As presented in Figure 4, although there are noticeable fluctuations during certain periods such as
World War II, the growth of per capita real GDP took off from an extremely low level in the first half
of the nineteenth century and experienced long-term increases until a significant growth slowdown
occurred in the second half of the twentieth century. These observations support the model’s
prediction that each economy develops along the path characterized by Malthusian stagnation,
economic take-off, accelerating growth, and growth slowdown.
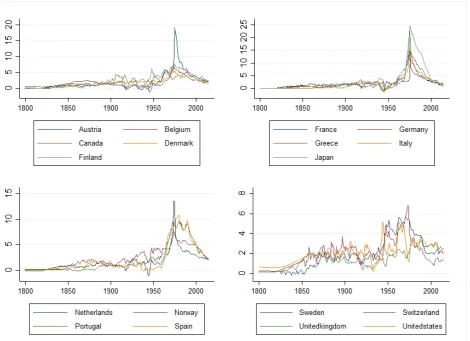
As presented in Figure 5, historical data generally support the prediction that population growth
rates first increase and then decline in each country. Contrary to income growth rates that peaked
around the same time for each country, population growth rates peaked at several different time
periods across the countries. This could be explained by the fact that countries share technology:
income growth rates are determined by the overall growth rate of technology of the countries sharing
technology, but population growth rates are also influenced by other country-specific factors, such as
the relative cost of the production and rearing of children.
16
28
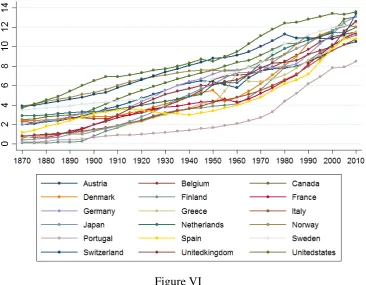
The evidence presented in Figure 6 is consistent with the model’s prediction that human capital
investment is increasing over time after economic take-off. We measure the level of human capital
investment by the average years of total schooling for the population aged 25 and over. The average
years of total schooling have experienced dramatic increases from 1870–2010 in each of the 18
OECD countries. For example, it increased from 0.4 to 12.5 in Japan and from 3.7 to 13.6 in the
United States from 1870–2010.
B. Malthusian stagnation, accelerating growth, and growth slowdown
To confirm the slowdown of per capita output growth observed in Figure 4, this subsection adopts a
Sup Wald test (Andrews 1993) to determine if and when a statistically significant structural break
occurred in each country after World War II.17 We then use various methods to test that per capita
growth rates indeed declined significantly after the break. Besides testing the growth slowdown, this
subsection also uses income data from 1–2015 A.D. to confirm the stylized facts of Malthusian
stagnation and accelerating growth that characterize the vast majority of human history before the
slowdown.
Testing the unit root hypothesis is necessary before implementing the Sup Wald test of
Andrews (1993), which does not allow for unit roots. The unit root hypothesis is tested by the
method developed in Perron (1994), which extends the augmented Dickey-Fuller (ADF) procedure
to reduce the potential bias caused by the misspecification of the deterministic trend.18 Briefly,
Perron (1994) extends the ADF test by allowing for unknown break dates and assuming different
intercepts and slopes before and after each possible break date. The maximum ADF t-statistic is
obtained from a range of possible break dates. The null hypothesis of a unit root is rejected if the
17
This test focuses on the postwar periods (1946–2015) because its purpose is to confirm the postwar slowdown as presented in Figure 4. Including data before 1945 may lead us to identify multiple breaks reflecting the significant increases in growth rates.
18
29
maximum ADF t-statistic is greater than the appropriate critical value. According to Perron (1994),
the critical value for rejecting the unit root hypothesis at 1 percent level is 4.32. The maximum
t-statistic estimated for each country is reported in column (1) of Table 2. We find that the unit root
hypothesis can be rejected at the 1 percent significance level for each country.
We now proceed to the Sup Wald break test. Columns (2) and (3) of Table 2 report the break
years and Sup Wald statistics estimated by the Sup Wald test. Each Sup Wald statistic is the
maximum value of the test statistic obtained from a series of Wald tests over a range of possible
break dates in the sample. Let b denote a possible break date in the range [ ,b b1 2] for a sample size
T. The Sup Wald statistic for testing the null hypothesis of no structural change in the time trend is
given by the following:
1 2 supremum T sup t
b b b
S S b
, (2)
in which S bt
is the Wald test statistic testing H0:12 in1 1 1
2 2 2
, , 1,....,
, 1,.... 1,
t t
t
t t b b b
g
t t b b b
. (2)
The p-value indicating the significance level for each Sup Wald test is computed using the method in
Hansen (1997). Statistically significant breaks are identified in 17 of the 18 OECD countries, and the
breaks are mainly during 1970–1976, and only the break identified in the United Kingdom is
statistically insignificant.19
Examining the time trend is necessary to confirm that the growth rate is declining after the break.
Column (4) reports the ordinary least square (OLS) estimate of the time trend after the break.20 A
19
Identifying breaks using the modified Sup Wald test developed by Vogelsang (1997), which permits unit root errors, also finds a significant postwar break for each country, except for the United Kingdom, but with a slightly different break year. Here, we report only the results estimated by the method of Andrews (1993) considering the rejection of the unit root hypothesis and the popularity of the method.
20
30
statistically significant declining trend is found in each country. As a robustness check, column (5)
provides the generalized least squares (GLS) estimate of the time trend, allowing for serial
correlation, calculated using the Cochrane-Orcutt procedure (Cochrane and Orcutt 1949). The results
are generally robust, and only the declining trend in the United Kingdom becomes statistically
insignificant. Column (6) provides another robustness check to deal with the potential bias caused by
outliers in the data using the robust regression developed in Berk (1990). Briefly, the robust
regression drops the most influential data points and down-weights the data points with large
absolute residuals. The estimates reported in column (6) are quite similar to those in column (4).
Although a statistically significant declining trend is found in each of the 18 OECD countries, the
actually decline in growth rates could be economically negligible. If this is true, we cannot say t