warwick.ac.uk/lib-publications
A Thesis Submitted for the Degree of PhD at the University of Warwick
Permanent WRAP URL:
http://wrap.warwick.ac.uk/121781
Copyright and reuse:
This thesis is made available online and is protected by original copyright.
Please scroll down to view the document itself.
Please refer to the repository record for this item for information to help you to cite it.
Our policy information is available from the repository home page.
A Physics-Driven Model for the Closed-Loop
Quality Control of Remote Laser Welding
by
ERKAN CANER OZKAT
Thesis
Submitted to the University of Warwick
for the degree of
Doctor of Philosophy
Warwick Manufacturing Group
Contents
Contents i
List of Tables v
List of Figures vii
Declarations xiv
List of Publications xv
Acknowledgments xvi
Abstract xvii
Abbreviations xix
Chapter 1 Introduction 1
1.1 The Motivation for the RLW in the Automotive Industry . . . 2
1.2 The Research Scope . . . 10
1.3 Research Objectives & Contributions . . . 14
1.4 Thesis Organization . . . 18
Chapter 2 Background 20 2.1 The Characteristic Properties of Laser Beam . . . 20
2.1.1 Coherence . . . 22
2.1.2 Monochromatic . . . 23
2.1.3 Transverse Electromagnetic Mode . . . 23
2.1.4 Polarisation . . . 24
2.1.5 Wavelength . . . 25
2.2 The Geometrical Parameters of Laser Beam . . . 26
2.2.2 Beam Divergence Angle . . . 27
2.2.3 Rayleigh Length . . . 28
2.3 The Quality of Laser Beam . . . 28
2.4 The Laser Welding Process Parameters . . . 29
2.4.1 Laser Power . . . 30
2.4.2 Welding Speed . . . 31
2.4.3 Focal Offset . . . 31
2.4.4 Incidence Angle . . . 32
2.4.5 Laser Intensity . . . 33
2.4.6 Interaction Time . . . 34
2.5 Modes of Laser Welding . . . 35
2.5.1 Conduction Mode . . . 35
2.5.2 Keyhole Mode . . . 35
2.6 The Weld Quality . . . 36
2.6.1 Metallurgical Weld Quality . . . 37
2.6.2 Mechanical Weld Quality . . . 44
2.6.3 Aesthetic Weld Quality . . . 47
2.7 Summary . . . 49
Chapter 3 Literature Review 51 3.1 Related Work on the Mitigation Methods of Zinc Vapour in Laser Welding of Galvanized Steels . . . 52
3.1.1 Removal of Zinc Coating . . . 53
3.1.2 Reduction in Zinc Vapour Pressure . . . 54
3.1.3 Ventilation of Zinc Vapour . . . 55
3.2 Related Work on the Process Monitoring . . . 58
3.3 Related Work on Numerical Simulation Modelling of Laser Welding 62 3.3.1 Heat Transfer . . . 63
3.3.2 Fluid Flow . . . 66
3.3.3 Keyhole Surface Generation . . . 67
3.4 Summary . . . 73
Chapter 4 Laser Dimpling Process Parameters Optimization Using Surrogate-Driven Process Capability Space 75 4.1 Definition of Key Control Characteristics & Key Performance Indicators 81 4.2 Problem Formulation for the Proposed Research Approach . . . 83
4.2.2 Formulation of Deterministic & Stochastic Process Capability
Spaces . . . 89
4.2.3 Formulation of Process Parameter Optimization Using Calcu-lated Surrogate Models . . . 90
4.3 Research Methodology to Develop Surrogate-Driven Process Capa-bility Space . . . 91
4.3.1 Materials & Experimental Setup . . . 91
4.3.2 Design of Experiments . . . 94
4.3.3 Development of Surrogate Models . . . 94
4.3.4 Development of Deterministic & Stochastic Process Capabil-ity Spaces . . . 95
4.4 The Laser Dimpling Process Parameter Optimization Using Surrogate-Driven Process Capability Space . . . 97
4.5 Results of Surrogate-driven Process Capability Space . . . 99
4.5.1 Statistical Data Analysis . . . 99
4.5.2 Deterministic Surrogate Models . . . 100
4.5.3 Deterministic Process Capability Space (DCp–space) . . . . 104
4.5.4 Stochastic Process Capability Space (SCp–space) . . . 104
4.5.5 Process Parameters Optimization . . . 105
4.6 Sensitivity Analysis . . . 108
4.7 Summary of the Chapter . . . 112
Chapter 5 Decoupled Multi-physics Multi-Fidelity Modelling of Laser Welding for In-process Monitoring 114 5.1 Definition of Key Control Characteristics & Key Performance Indicators116 5.2 Problem Formulation for the Proposed Research Approach . . . 119
5.2.1 Formulation of the Laser Intensity . . . 123
5.2.2 Formulation of the Keyhole Profile . . . 126
5.2.3 Formulation of the Temperature Profile . . . 128
5.2.4 Formulation of FZDs Extraction . . . 131
5.3 Research Methodology to Develop Multi-Fidelity Model . . . 132
5.3.1 Materials & Experimental Setup . . . 132
5.3.2 Design of Experiments . . . 135
5.3.3 Off-line Generation of Scaling Functions . . . 136
5.3.4 Development & Validation of Multi-Fidelity Model . . . 139
5.4.1 The Results of the High-Fidelity, Multi-Fidelity, &
Low-Fidelity Models . . . 141
5.4.2 Scaling Functions . . . 151
5.4.3 Validation Results . . . 153
5.5 Summary of the Chapter . . . 159
Chapter 6 Conclusions and Future Works 161 6.1 Conclusions . . . 161
6.2 Engineering Contribution . . . 165
6.3 Limitations & Future Works . . . 166
Bibliography 167
Appendix A 181
Appendix B 192
Appendix C 194
Appendix D 197
Appendix E 206
List of Tables
1.1 The specific strength of different materials [Adapted from Cunat (2000)] 5
1.2 Macro-section images and the grain morphology of different zones in
the joints [Adapted from Zhang et al. (2016)] . . . 9
2.1 The spatial and the temporal coherence of different beams. The laser beam is both spatial and temporal coherent . . . 23
2.2 Comparison between conduction and keyhole welding modes . . . 36
2.3 The chemical composition of DX54D+Z steel (wt %) . . . 37
2.4 The mechanical properties of DX54D+Z steel . . . 38
2.5 The thermal properties of DX54D+Z steel . . . 38
2.6 Welding quality in terms of Fusion Zone Dimensions (FZDs) and their allowance limits. tupper indicates the thickness of the upper sheet; tlower indicates the thickness of the lower sheet . . . 47
3.1 Related work on the selection of optimum laser dimpling process pa-rameters . . . 58
3.2 Process signals and detectors used in process monitoring for the laser welding . . . 59
3.3 In-process monitoring of KPIs highlighting the proposed monitoring approach . . . 62
3.4 Interactions of occurring physical phenomenon in laser welding . . . 69
3.5 Computational time for different modelling approaches and their main properties . . . 72
3.6 The multi-physics and decoupled multi-physics modelling approaches 73 4.1 KCCs and their corresponding allowance limits . . . 83
4.2 KPIs and their corresponding allowance limits . . . 83
4.3 Laser focusing and repositioning module (SmartLaser) . . . 92
4.5 The proposed design option to find out optimum process parameters 98
4.6 R2 & RMSE values for different surrogate models . . . 100 4.7 The optimization results showing the proposed design . . . 106
4.8 The validation of the optimization results for all design options . . . 107
4.9 The effect of % change in mean and standard deviation into the results111
5.1 The temperature values at the sampling points and the computational
time for each mesh size. The temperature value at each sampling
point converges to a certain temperature value as the mesh size is increased. The computational time also increases with the increase
in the mesh size . . . 131
5.2 The constant parameters used in the LF model . . . 132 5.3 The procedure to be followed for the metallographic analysis of the
weld . . . 134
5.4 The methodological steps for computing FZDs using the multi-fidelity (MF) model in the overlap welding . . . 140
5.5 The comparison of the keyhole opening radius (rKH0) for different
models at various welding speeds . . . 154
5.6 The results of the validation experiments to determine the accuracy
of the MF model. The accuracy is computed based on the MAE values.157
6.1 Characteristics of the remote laser welding process . . . 162
A.1 DoE Table and Experimental Results for Laser Dimpling . . . 181
C.1 DoE Table and Experimental Results for Penetration (P T) in Bead-on-plate Welding . . . 194
C.2 DoE Table and Experimental Results for Top Width (T W) in
Bead-on-plate Welding . . . 195
D.1 DoE Table and Experimental Results for Penetration (P T) in Overlap
Welding . . . 197 D.2 DoE Table and Experimental Results for Top Width (T W) in Overlap
Welding . . . 199
List of Figures
1.1 A schematic diagram of the required flange size in the RSW and the
RLW processes [Adapted from Bea et al. (2011)] . . . 4
1.2 An industrial laser welding robot showing robot arm, laser optics and scanning head . . . 6
1.3 The longitudinal cross-section illustration of the laser welded joint . 7
1.4 The variation of heat input to the workpiece with power intensity of the heat source [Adapted from Kou (2003)] . . . 8
1.5 The outline of the dissertation: (a) controlling minimum joining gap
requirement in the RLW process by utilizing the laser dimpling pro-cess (Chapter 4), (b) the physics-driven propro-cess model for quality
assurance for the RLW process (Chapter 5) . . . 12
2.1 Components of a typical laser system: Pump Source, Gain Medium, Optical Resonator . . . 21
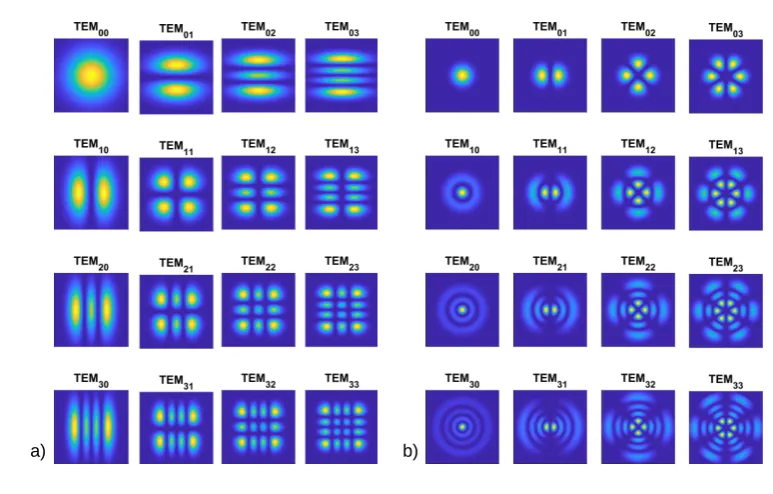
2.2 Transverse Electromagnetic Modes: a) Rectangular coordinate, b)
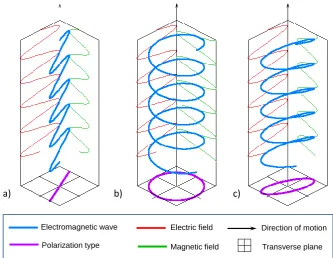
Polar coordinate . . . 24 2.3 Polarization types: a) Liner polarization, b) Circular polarization, c)
Elliptical polarization . . . 25
2.4 Absorption of various metals at relevant wavelengths [Adapted from Saucedo et al. (2016)] . . . 26
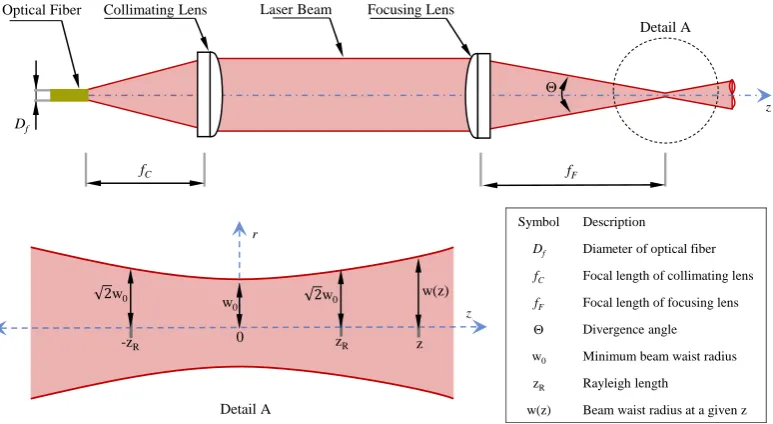
2.5 A schematic diagram of a typical optical system showing the geomet-rical parameters of a laser beam [Adapted from Abt et al. (2007)] . . 27
2.6 The comparison between (a) high BPP, (b) low BPP that highlights
focal length, Rayleigh length, and laser optics . . . 29 2.7 The fundamental process parameters for laser welding . . . 30
2.8 The grain morphology (a) low welding speed, (b) high welding speed
2.9 Transverse cross sections of weld using PL: 550 W, WS : 35 mm/s,
Gap: 0.15mm and FO of: (a) -0.3 mm, (b) -0.2 mm, (c) -0.1 mm, (d) 0 mm, (e) +0.1 mm, and (f) +0.2 mm (D:Penetration, W:Top
Width, C:Top Concavity) [Adopted from Zhao et al. (2012)] . . . 32
2.10 Experiment results showing the influence of incidence angle on the weld shape (a) Top view of welded spot and (b) Transverse cross
sections of the weld (c) Characteristic lengths of the welded spot as
functions of incident angle [Adopted from Liao and Yu (2007)] . . . 33 2.11 The experimental result that shows the penetration as a function of:
(a) laser intensity for different interaction times, and (b) interaction
time for different laser intensities [Adopted from Suder and Williams (2012)] . . . 34
2.12 The modes of laser welding. a) Conduction mode, b) Keyhole mode 36
2.13 (a) The distribution of the different zones in a welded joint as a func-tion of temperature in relafunc-tion to (b) the iron-carbon phase equilibrium 39
2.14 Top view of the fusion zone structure at different welding speeds (a)
elliptical molten pool, (b) teardrop shape molten pool [Adopted from Lienert et al. (2011)] . . . 40
2.15 Effect of temperature gradient G and growth rate R on the morphol-ogy and size of solidification microstructure [Adopted from Kou (2003)] 41
2.16 Variation in solidification mode across the fusion zone [Adopted from
Kou (2003)] . . . 42 2.17 A schematic representation of a) the partially melted zone, and b)
temperature history for given points in the welded material . . . 42
2.18 The solidification modes of grain boundary liquid in the PMZ [Adopted from Huang et al. (2001)] . . . 43
2.19 The different microstructural regions in a steel weld highlighting
the grain growth and the grain refinement regions inside the HAZ [Adopted from Layus et al. (2018)] . . . 44
2.20 a) Instron 100kN tensile testing machine used for the lap shear tensile
tests, b) Dimensions of the welded samples to be tested via lap shear tensile test [Prepared based on the industrial standard EN ISO 5817
(2014)] . . . 45
2.21 Deformation of the different laser lap welded structures under tensile shear load and configuration of the breaking point after a fracture a)
at the base metal, b) at adjacent to the weld, c) at the weld [Adopted
2.22 A schematic description of spatter formation based on the localized
evaporation of metal in the keyhole front, and the flow conditions in the molten around the keyhole . . . 49
4.1 A schematic diagram of the joining gap between two sheet metals a)
ideal case b) real case . . . 76 4.2 The effect of joining gap variation on the weld quality (a) the strength
at the failure (b) macro-section image showing weld shape and contour 77
4.3 A macro-section image of a laser welded joint highlighting the fusion zone of the weld, the generated gap, and two dimples . . . 78
4.4 (a)Illustration of humping effect during a dimpling process,(b)
dim-ple upper surface, (c)dimple lower surface . . . 79 4.5 The conceptual representation of (a)Experimental results,(b)
Suc-cess rate models for the deterministic and the stochastic scenarios.
The tolerance limits that determine the process capability space in each scenario are also presented. . . 86
4.6 An overview of the experimental setup (a) Beam quality measure-ment (b) Laser Dimpling setup (first series of experiments) (c)
Re-mote Laser Welding setup (second series of experiments) . . . 92
4.7 (a) Experimental setup for profilometer, (b) An example of 3D re-construction. Process parameters: SS: 2m/min,α: 20◦,LT: 4mm,
FO: 35 mm . . . 93
4.8 Measurement of the dimple lower surface area (a) Grabbed image with scale bar. (b) Dimple lower surface area for the first right
ex-periment configuration. Process parameters: SS: 2 m/min,α: 10◦,
LT: 4mm,FO: 25 mm . . . 93 4.9 The procedure flow for computing process capability spaces . . . 96
4.10 The estimated dimple height value (DH) over KCC–space in the
deterministic scenario for varying Scanning Speed (SS) and Incidence Angle (α) for constant Laser Track (LT) and Focal Offset (FO) values 101
4.11 The estimated dimple upper surface area value (DU)over
KCC–spacein the deterministic scenario for varying Scanning Speed
(SS) and Incidence Angle (α) for constant Laser Track (LT) and Focal
4.12 The estimated dimple lower surface area value (DL) over
KCC–spacein the deterministic scenario for varying Scanning Speed
(SS) and Incidence Angle (α) for constant Laser Track (LT) and Focal
Offset (FO) values . . . 103
4.13 Effect of focal offset on three KPIs when process parameters are con-stant at: SS: 3m/min,α: 10◦,LT: 3 mm. (Upper Surface) Surface
profilometer results – (Lower Surface) Image processing results . . . 103
4.14 Deterministic Process Capability Space (DCp–space) over
KCC–space for varying Scanning Speed (SS) and Incidence
Angle (α) for constant Laser Track (LT) and Focal Offset (FO) values 104
4.15 Stochastic Process Capability Space (SCp–space) overKCC–space
for varying Scanning Speed (SS) and Incidence Angle (α) for constant
Laser Track (LT) and Focal Offset (FO) values . . . 105
4.16 Remote laser welded joint looking from the backside. (a) Trial-and-error method before optimization. (b)Optimized configuration based
on the proposed methodology . . . 108
4.17 The schematic illustration of shifting mean and standard deviation on the PDF (a) The original mean and standard deviation, (b) The new
mean µ1 is bigger than the original mean µ0, (c) The new standard
deviationσ1 is bigger than the original standard deviation σ0 . . . . 109
4.18 The two-dimensional design space showing the effect of % change in
the mean and the standard to the change in success rate. The change in the mean value is much more significant than the change in the
standard deviation. . . 111
5.1 A schematic diagram showing laser welding process parameters and laser beam parameters . . . 118
5.2 The distinct regions and the fusion zone dimensions to assess the weld
quality . . . 119 5.3 The overall representation of the proposed methodology in
multi-fidelity modelling. It highlights the high-multi-fidelity model (Point A),
the low-fidelity model (Point B), the low-fidelity model with scaling, called the multi-fidelity model (Point C), and physical
experimenta-tion with high-fidelity . . . 120
5.5 The methodology of computing the scaling function over the design
space . . . 122 5.6 The flow chart of the sequential decoupled model with scaling function
(Multi-Fidelity (MF) Model – Moving from Point B to Point C in
Fig. 5.3) . . . 123 5.7 A schematic description of the absorption mechanism in the laser
welding process (a) outside the keyhole: the plasma absorption (I0·
(1−αplasma)) and the surface absorption (I1 =I0·αsurf·(1−αplasma)) (b) inside the keyhole: the inverse-Bremsstrahlung absorption (I2 =
I1·exp(−αinBre·∆z)) and the Fresnel absorption (I2abs =I2·αF re) 126
5.8 The computational domains generated employing different mesh sizes (a) Coarse Mesh, (b) Normal Mesh, (c) Fine Mesh, and three
sam-pling points within these domains . . . 130
5.9 Experimental setup. (a) The welding robot, (b) The welding table and clamp locations,(c)Top view and cross-section of welding fixture
showing laser welding location and direction . . . 133
5.10 The process flow of the validation experiments to verify the MF model and scaling functions utilized in the MF model . . . 141
5.11 The results of the HF, the LF and the MF models are presented to the characterization of Top Width (TW) over the KCC-space. TW
reduces with increasing welding speed and joining gap, but it increases
with increasing incidence angle. The results of the MF model follow the same pattern as the results of the HF model, and they are within
the tolerance limits. . . 143
5.12 The results of the HF, the LF and the MF models are presented to the characterization of Interface Width (IW) over the KCC-space. IW
reduces with increasing welding speed, but it increases with joining
gap and increasing incidence angle. At the larger joining gap, the HF model results (i.e. physical experiments) violate the allowance
limits. At these points, the results of the LF model will become lower
than the results of the HF model because the mass transfer is not considered in the LF model. The results of the MF model follow the
same pattern as the results of the HF model, and they are within the
5.13 The results of the HF, the LF and the MF models are presented
to the characterization of Penetration (PT) over the KCC-space. PT reduces with increasing welding speed. Two modes are seen, the open
keyhole mode, and the blind keyhole mode. The results of the HF
model in the blind keyhole mode are out of the allowance limits. The results of both LF and MF models are constant values (1 mm) due
to fluid flow is not considered in these models. The results of the MF
model are within the tolerance limits. . . 147 5.14 The comparison of (i) the macro-section images obtained by the HF
model (i.e. experiment) against the computed by the MF model, and
(ii) the measured FZDs against the computed FZDs using the MF model. The process parameters not specified in the graph are welding
speed (WS): 2.0 m/min, focal offset (FO): 0 mm, and laser power
(PL): 3 kW . . . 150 5.15 The comparison of (i) the macro-section images obtained by the HF
model (i.e. experiment) against the computed by the MF model, and
(ii) the measured FZDs against the computed FZDs using the MF model. The process parameters not specified in the graph are welding
speed (WS): 3.2 m/min, focal offset (FO): 0 mm, and laser power (PL): 3 kW . . . 151
5.16 The estimated first scaling factor ( ˆβ1/3
µ) over the KCC-space using
the first scaling function (fβ1/3µ) developed based on the mean-only
analysis (See Eq. (5.24)) . . . 152
5.17 The estimated second scaling factor ( ˆβ2µ) over the KCC-space using
the second scaling function(fβ2µ)developed based on the mean-only
analysis (See Eq. (5.24)) . . . 153
5.18 The comparison of(i) the macro-section images obtained by the
vali-dation experiments against the computed by the MF model, and(ii)
the measured FZDs against the computed FZDs using the MF model.
The process parameters not specified in the graph are welding speed
5.19 The comparison of(i) the macro-section images obtained by the
vali-dation experiments against the computed by the MF model, and(ii)
the measured FZDs against the computed FZDs using the MF model.
The process parameters not specified in the graph are welding speed
(WS): 3.0 m/min, focal offset (FO): 0mm, and laser power (PL): 3 kW . . . 156
C.1 DoE table and experimental results showing cross-section images in
bead-on-plate welding . . . 196
D.1 DoE table and experimental results showing cross-section images in
Declarations
This thesis is the original work of the author and submitted to the University
of Warwick in support of my application for the degree of Doctor of Philosophy. I
hereby declare that this thesis has not been submitted in any previous application
for any degree. The work presented was carried out by the author, except where
explicitly stated. Over the course of PhD research, parts of this thesis have been
published by the author and these publication are given in the list of publication at
page xv.
List of Publications
Journal Papers
E. C. Ozkat, P. Franciosa, and D. Ceglarek. Laser dimpling process parameters
selection and optimization using surrogate-driven process capability space. Op-tics and Laser Technology, 93:149–164, 2017. ISSN 00303992. doi: 10.1016/j.
optlastec.2017.02.012. URL http://www.sciencedirect.com/science/article/
pii/S0030399216309513.
E. C. Ozkat, P. Franciosa, and D. Ceglarek. Development of decoupled multi-physics simulation for laser lap welding considering part-to-part gap. Journal of
Laser Applications, 29(2):022423, 2017. ISSN 1042-346X. doi: 10.2351/1.4983234.
URLhttp://lia.scitation.org/doi/10.2351/1.4983234.
E. C. Ozkat, P. Franciosa, and D. Ceglarek. Decoupled multi-physics multi-fidelity model of RLW for in-process monitoring.To be submitted to Lasers in Manufacturing
and Materials Processing.
Conference Papers
E. C. Ozkat, P. Franciosa, and D. Ceglarek. Monitoring remote laser welding process
of overlap joints based on energy balance model. InICALEO 2016 - International Congress on Applications of Laser and Electro-Optics, page 602–610, 2016.
E. C. Ozkat, P. Franciosa, and D. Ceglarek. A Framework for physics-driven
in-process Monitoring of penetration and interface width in laser overlap welding. Pro-cedia CIRP, 60:44–49, 2017. ISSN 22128271. doi: 10.1016/j.procir.2017.01.043. URL
http://dx.doi.org/10.1016/j.procir.2017.01.043.
Poster Presentation
E. C. Ozkat, P. Franciosa, and D. Ceglarek. In-Process Monitoring of Remote Laser Welding Process Based on Decoupled Multiple-physics Simulation. InWMG
Doctoral Research & Innovation Conference, 2016. doi: 10.13140/RG.2.2.23679.
Acknowledgments
In the name of Allah (c.c.), the most gracious and the most merciful.
I would like to express my gratitude to my supervisors Prof. Darek Ceglarek
and Dr Pasquale Franciosa for their invaluable advice, guidance, and to my
exam-iners for their constructive suggestions in order to improve the overall quality of the
thesis.
I would also like to extend my thanks to the Digital Lifecycle Management
Group (DLM) members, in particular Dr Manoj Kumar Babu, Dr Ken Asare, Dr
Arnab Palit, Dr Aniruddha Gupta, Sandra Holtom, Armando Serino.
I am deeply grateful to the Ministry of National Education of Turkey for
providing the government scholarship that provided me the opportunity to study in
the UK.
I dedicate this thesis to my family. I am also grateful to my parents Ayse
and Ziya Ozkat, as well as my sister Saadet Ozkat for their endless support not only
during my study but also throughout my life.
A special thanks goes to my friends that I have meet during my study, in
particular Dr Karim El Haloui, Dr Mustafa Demirbilek, Mustafa Emre Dogukaya,
Captain Pilot Deniz Hazir, Sinan Kahveci, Dr Pinar Satilmis, Selin Erden, Dr Nilgun
Ince, Dr Elvan Gokalp, Dr Mumim Ozplot and my old friend Dr Bugra Alkan for
Abstract
Remote Laser Welding (RLW) has grown in importance over conventional joining methods such as Gas Metal Arc Welding (GMAW), Resistance Spot Weld-ing (RSW), Self-Pierce RivetWeld-ing (SPR) since it offers advantages, such as weight reduction, high processing speed, ability to weld a wide range of metals, and better weld quality. Despite such advantages, it also poses several challenges that have prevented its widespread implementation in the industry.
The presented thesis deals with the RLW of galvanized steel (i.e. zinc-coated steel) since it is widely used in the automotive industry due to better resistance to corrosion and better adhesion of the paint to the surface. However, RLW of such steel is challenging because the zinc vapour disturbs the molten pool resulting in weld defects. Therefore, RLW of galvanized steel is performed in overlap configuration with a joining gap to ventilate the zinc vapour from the welding area.
An important challenge faced during the laser welding of galvanized steels is to achieve a consistent joining gap between two metals. If the gap is too wide, two metals do not join together. If the gap is too narrow, welding takes places with defects such as explosions, spatters and porosities. The maximum joining gap is con-trolled by the welding fixture; whereas, the minimum joining gap is concon-trolled by the laser dimpling process (i.e. an upstream process). In the literature, the follow-ing research gaps have been identified regardfollow-ing the laser dimplfollow-ing process. These gaps are as follows: (i) lack key performance indicators to determine the dimple quality, (ii) lack a comprehensive characterization of dimpling process considering multi–inputs (i.e. key control characteristics) and multi–outputs (i.e. key perfor-mance indicators), and (iii) an effective implementation in a real manufacturing system taking into consideration process variation. Overcoming the aforementioned limitations in the literature, the presented thesis introduces proposes methodologies to develop: (i) surrogate models for dimpling process characterization considering multi–inputs and multi-outputs system by conducting physical experimentation,(ii)
process capability spaces based on the developed surrogate models that allows the estimation of a desired process fallout rate in the case of violation of process require-ments, and(iii) the optimization of the process parameters based on the developed process capability spaces.
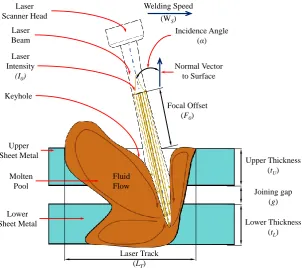
be produced such that each key performance indicator meets its defined allowable limits and any deviation from these limits is considered as a weld defect. The weld profile is important because the weld should have a desired profile for achieving the maximum strength. In this thesis, the weld profile is determined by penetration, top width, interface width (i.e. fusion zone dimensions).
It must be pointed out that the presented fusion zone dimensions are difficult to measure directly during the welding process unless production is stopped which is nearly unfeasible as it is economically unjustified; whereas, it can be monitored by process signals (e.g. autistic, optical, thermal). Today, in-process monitoring is often provided by photodiodes or cameras. Owing to the lack of understanding of the process, it is limited to empirical correlations between the appearance of a weld defect and signal changes. The lack of methods linking (i) in-process monitoring data (e.g. visual sensing, acoustic and optical emissions); with, (ii) multi fusion zone dimensions (e.g. penetration, interface width, etc.), and (iii) welding process parameters (e.g. laser power, welding speed, focal point position) underscores the limitations of current data-driven in-process monitoring methods. Furthermore, the current in-process monitoring methods are indirect measurements of fusion zone dimensions. Therefore, an accurate model to perform non-destructive measurement of fusion zone dimension is essential for on-line monitoring of laser welding as a part of quality assurance.
Based on this requirement, the occurring physics in the laser welding process are decoupled by sequential modelling. It consists of three steps as follows: (i) calcu-lating the laser intensity acting on the material,(ii)calculating the keyhole profile in using an analytic method, and(iii) solving the heat equation using the FEM to cal-culate the temperature distribution. After obtaining the temperature distribution, the fusion zone profile is defined by selecting an isotherm. Then, the aforementioned fusion zone dimensions (i.e. Penetration, Top Width, Interface Width) are measured from the calculated fusion zone profile according to the industrial standard.
Keywords: Laser Dimpling Process • Process Capability Space • Process Robustness •
Abbreviations
RLW Remote Laser Welding
RSW Resistance Spot Welding
SPR Self Piercing Rivet
BIW Body-In-White
T W Top Width
IW Interface Width
P T Penetration
F Z Fusion Zone
F ZD Fusion Zone Dimension
F ZDs Fusion Zone Dimensions
HAZ Heat Affected Zone
BM Base Material
DH Dimple Height
DU Dimple Upper Surface Area
DL Dimple Lower Surface Area
KCC Key Control Characteristic
KCCs Key Control Characteristics
KP I Key Performance Indicator
KP Is Key Performance Indicators
PDF Probability Density Function
SR Success Rate
LL Lower Limit
Chapter 1
Introduction
Remote Laser Welding (RLW) is a single-sided, non-contact laser welding technique which consists of a laser source to generate the laser beam, a welding robot
to position the laser beam on the surface of the workpiece and a scanner head to focus
and move the laser beam rapidly along the surface of the workpiece. Currently, the RLW is mainly utilized in high volume production, such as Body-in-White (BIW)
assembly (e.g. pillars, door panels, side walls etc.) in the automotive industry.
However, a leading challenge preventing its systematic uptake in the industry is the lack of efficient in-process monitoring and assuring the weld quality in the presence
of process variability (Ceglarek et al., 2015; Mirapeix et al., 2016; Song et al., 2017;
Chen et al., 2018). Furthermore, this problem is even more challenging since welding takes place in a fraction of a second and there is not any contact between the scanner
head and the workpiece.
The purpose of any welding process is to join two or more components into a single structure. The physical integrity of the structure thus formed depends on the
weld quality. It is often evaluated by“Key Performance Indicators” (KPIs) defined
in the industrial standards (EN ISO 13919-1, 1997; EN ISO 13919-2, 2001). The weld should be produced such that each KPI must meet its defined allowable upper
and lower limits and any deviation from these specified limits is considered as a weld
defect. The predominately used KPIs to assess the weld quality are characteristic dimensions of the weld, called “Fusion Zone Dimensions” (FZDs) (Rong et al.,
2015; Ai et al., 2016; Jiang et al., 2016). Therefore, a significant amount of research has been conducted to understand the relationship between process parameters and
FZDs so that a constant weld geometry throughout the weld seam can be obtained
by adequately controlling process parameters (Anawa and Olabi, 2008; Olabi et al., 2013; Jiang et al., 2016; Liu et al., 2017). FZDs are usually categorized into two
directly visible, and(ii) internal FZDs which are inside the weld seam and cannot
be directly visible.
Statistical process control (SPC) is a method of quality control which employs
statistical methods to monitor and control a manufacturing process. It involves
steps of monitoring the quality or product design specifications (i.e. FZDs in the welding process), decision and control actions. The control action (i.e. process
adjustment) is only taken place when there is statistical evidence that the process
is out of control. The weld quality is usually unknown until the results of the inspection tests and statistical analysis become available. SPC will fail in high
productivity manufacturing due to the increasing lag time between detection of
the weld quality and process adjustment. To address this problem, it is possible to equip the welding robot with sensors to guarantee consistent weld quality by
monitoring process emissions obtained through the molten pool, the keyhole and
the metallic vapour. Signals/Data gathered from these sensors are then correlated to FZDs using statistic methods and machine learning algorithms. However, the
limitations of data-driven monitoring methods are that(i)the process emissions are
indirect measurements of the actual FZDs, and(ii) currently only penetration (i.e. one of the internal FZDs) is directly measured. Thus, the main aim of this thesis is
to develop a computer simulation for quality assurance of the RLW process which integrates “Finite Element Modelling” (FEM), process parameters that affect the
weld quality, and process emissions. As a result, the proposed simulation can be
used to directly monitor multi-FZDs (i.e. penetration, top and interface widths) and such information will provide a better insight into the RLW process which is
necessary for process control, and thereby, towards zero defects in manufacturing.
The rest of the chapter is organised as follows: (i) the importance of the RLW in the automotive industry,(ii) a brief explanation of the research scope,(iii)
the research objectives and contributions, and(iv) the thesis organization.
1.1
The Motivation for the RLW in the Automotive
Industry
Rapid changes in the market needs, technological breakthroughs and new regulations force the automotive industry to utilize new emerging technologies that
can help to manufacture faster, cheaper and better quality automotive components
(Sturgeon et al., 2009; De Wit and Poulis, 2012). Furthermore, there has been a strong focus on light-weighting in the industry to improve fuel economy without
fuel economy would improve by 7% (Ghassemieh, 2011). The major contributors
to the total weight of a modern-day family size vehicle are the BIW and the ICE (Davies, 2012). Therefore, the BIW is an important factor in lightweight vehicle
designs which cannot be disregarded.
According to Jou (2003), the highly utilized welding method in the BIW is resistance spot welding due to the simplicity of the welding equipment (e.g. welding
without using consumable electrodes, filler materials and shield gas), the ease of
implementation in robotic systems, and the low operation cost in mass production. This process uses a combination of heat and pressure to accomplish the weld. Two
opposing spots guns apply pressure on both sides to clamp materials that are going
to be welded together, creating intimate contact. Electrodes are located inside spot guns, and when the current is passed through the electrodes to the materials, heat
is generated due to the higher electrical resistance where the surfaces contact each
other. The heat energy supplied to the welding process depends on the current flow, the resistance of the circuit, and the duration of time that the current is applied.
The resistance in the welding circuit is the sum of (i) resistance of the electrodes,
(ii)resistances of the materials, and(iii) contact resistances between electrodes and materials. Furthermore, electrodes generally are made of a low resistance alloy,
usu-ally copper, and they are often water cooled to dissipate the heat that is generated (Williams and Parker, 2004; Marya and Gayden, 2005).
Thanks to the advancement of laser technology (i.e. development of high
power and quality lasers with efficient delivery systems such as fiber optics), the RLW has been gradually replacing traditional welding methods (e.g. Resistance
Spot Welding (RSW), Gas Metal Arc Welding (GMAW), Friction Stir Welding
(FSW),etc.) since the RLW offers the following advantages: (i) weight reduction in the BIW:
The weight reduction can be achieved through the application of either
topol-ogy optimization (i.e. to optimize the shape of a component to reduce excess material weights that do not contribute to the stiffness and strength of the
BIW) or utilizing light metals (i.e. to use the low-density materials in the
BIW such as aluminium, magnesium, composites etc. However, it is more difficult to laser weld these metals due to the lower absorptance of the laser
beam at the surface of these metals). The material used in this thesis is
galva-nized steel (i.e. zinc coated steel), which is highly utilized in the automotive industry (Hosking et al., 2007). Thus, the laser welding of any other metals is
not investigated in this thesis.
spot guns (diameter around 8 mm) access the welding area to perform the
weld. This non-structural feature adds weight and increases material cost. However, it can be considerably reduced and even eliminated by employing
the RLW since it is a non-contact welding process and requires one-sided
access to the welding area, which means that there is not any physical contact between the scanner head and the workpiece. Furthermore, the spot diameter
of a modern laser beam (e.g. Nd:YAG, Ytb:YAG, etc.) are less than 1 mm.
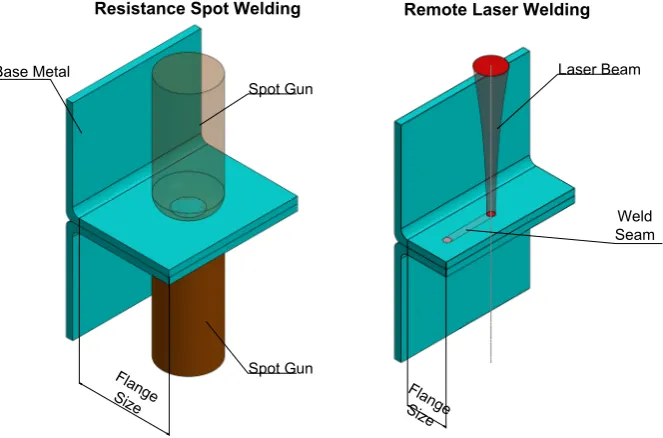
Consequently, significant weight reduction in the BIW can be achieved. Figure 1.1 shows the flange size for the RSW and the RLW processes and highlights
the distinctive features of the RLW process which are being non-contact and
one-sided access.
Flange Size
Resistance Spot Welding
Spot Gun
Spot Gun Base Metal
Flange Size
Remote Laser Welding
Laser Beam Weld Seam A A B B C C D D E E F F G G H H J J K K L L M M N N P P R R T T 24 24 23 23 22 22 21 21 20 20 19 19 18 18 17 17 16 16 15 15 14 14 13 13 12 12 11 11 10 10 9 9 8 8 7 7 6 6 5 5 4 4 3 3 2 2 1 1 DRAWN CHK'D APPV'D MFG Q.A UNLESS OTHERWISE SPECIFIED: DIMENSIONS ARE IN MILLIMETERS SURFACE FINISH: TOLERANCES: LINEAR: ANGULAR:
FINISH: DEBURR AND BREAK SHARP EDGES NAME SIGNATUREDATE
MATERIAL:
DO NOT SCALE DRAWING REVISION TITLE: DWG NO. SCALE:1:2 SHEET 1 OF 1
A0
WEIGHT:
[image:25.595.157.489.300.519.2]RSWvsRLW
Fig. 1.1. A schematic diagram of the required flange size in the RSW and the RLW pro-cesses [Adapted from Bea et al. (2011)]
A review conducted by Hong and Shin (2017) pointed out that total weight
reduction can reach up to 12.2 kg in the BIW by converting a spot-welded
structure into a laser welded structure. Furthermore, it has been reported that for door panels a weight reduction up to 0.5kgcan be achieved by employing
the RLW (Ceglarek et al., 2015).
As there is a high emphasis on light-weighting in the automotive industry, auto-makers have been investigating the replacement of steel with low-density
materials, such as aluminium, magnesium, composites, etc. The emerging
cri-teria is the safety requirement which can be examined by “crashworthiness”
and “penetration resistance”. The ability to absorb impact energy and be survivable for the passengers is called crashworthiness. The penetration
re-sistance is concerned with the total absorption without allowing projectile or
fragment penetration (Jacob et al., 2002).
Components in the BIW should be able to absorb or transmit impact energy in
a crash situation. The materials deformation and progressive failure behaviour
in terms of the stiffness, the yield strength, and the total elongation at the break point are very important in the energy absorption. The prime reason for
still using steel in the BIW is its inherent capability to absorb impact energy
in a crash (Marsh, 2000). Furthermore, the good formability, joining capa-bility and low cost make steel the first-choice material for the light-weighting
(Magnusson and Anderson, 2001).
Specific strength or strength-to-weight ratio basically is the ratio of the yield strength of a material to its density. It is a helpful measure when the mass
of a component is important because it characterizes the weight advantage of
material considering its strength. For example, the strength-to-weight ratio of low carbon steel is very similar to that of aluminium alloy and high-strength
low-alloy (HSLA) steel, which means that the three materials can all be con-sidered as“light materials”. The materials with the highest specific strengths
are typically fibres, such as carbon fibre, glass fibre and various polymers. The
specific strengths of different materials are tabulated in Table 1.1.
Table 1.1: The specific strength of different materials [Adapted from Cunat (2000)]
Property Low Carbon Steel (AISI 1010)
Aluminium Alloy
(6010-T4)
High Strength
Low Alloy Steel
Carbon Fiber
(T1100G)
Density
(g/cm3) 7.89 2.70 7.80 1.79
Tensile
Strength
(N/mm2)
370 130 410 7000
Specific
Strength
(kN m/kg)
(ii) better processing speed:
The term “remote” in the RLW is used to describe the stand-off distance (e.g. around 1 m - 2 m in laser welding of steel) between the scanning head and
the base metal, and it emphasises that there is not any physical contact. The
laser beam is delivered from the laser source via optical fibre. Then, pass through the laser optics which is embedded within the robot, finally reaching
the scanning head. Mirrors are located inside the scanning head, and the
weld is accomplished by the rapid movement of the laser beam across the base metal. Moreover, the robot repositioning time between two welds is much
shorter in the RLW compare to the RSW since the weld is performed while
the robot is moving from one location to another location. This is achieved by synchronization of robot and mirror movements. As a result, the welding
speed is increased, and the robot repositioning time is reduced. The laser
welding robot, laser optics and the scanning head are shown in Fig. 1.2.
Robot Arm Laser Optics
[image:27.595.156.486.353.554.2]Scanning Head
Fig. 1.2. An industrial laser welding robot showing robot arm, laser optics and scanning head
For example, in order to achieve an economically justified productivity in laser
welding of steels, the welding speed should be around 3 m/min - 6 m/min. The welding time based on the given range is between 0.2s - 0.4 s provided
that the weld seam is 20 mm long (Ceglarek et al., 2015). On the other
hand, Papkala (1992) reported that the welding speed in the RSW process was around 30 spots/min - 40 spots/min for the metal sheet thickness of
increased when joining thicker sheet metals. For instance, the welding speed
was around 15 spot/min - 25 spot/min for the metal sheet thickness of 1.8 mmto 2.0mm.
(iii) better weld quality:
The laser beam is focused to a very small on-surface spot resulting in high laser intensity. When the laser intensity (I) exceeds the critical value (i.e.
(I >106W/cm2) for steels), instantaneous vaporization occurs and generates a cavity named as“keyhole”. It allows the laser beam to penetrate deeper inside the material so that less energy is spent to heat up the surrounding area which
creates narrow heat affected zone (HAZ) leading to low thermal distortion.
Furthermore, the continuous weld seam is achieved with the movement of the laser beam along the surface of the material. On the contrary, the weld
seam and its position are limited to the spot gun location in the RSW. As
a consequence of narrow HAZ, deep penetration and continuous weld seam, the weld obtained by the RLW has better the weld quality (e.g. tensile, shear
strength) than the weld obtained by other welding methods. The keyhole, the
molten pool and the weld seam are illustrated in Fig. 1.3.
Base Metal Molten Pool
Keyhole Laser Beam
Weld Seam On-Surface Spot
Fig. 1.3. The longitudinal cross-section illustration of the laser welded joint
Yang and Lee (1999) concluded in their experimental research to compare the
fatigue strength of the RSW and laser spot welding (LSW) in which the laser beam is stationary. The diameter of the spot gun and the diameter of the
laser on-surface spot size were selected as equal in order to compare these two processes. It was reported that the fatigue strength of joints obtained by the
LSW was 3 times higher as well as the tensile strength was 5 times greater than
processes. Heat input is the ratio of the heat delivered to the base metal
to the velocity at which the heat source travels. This means that a welding process which has a high-speed capability has a low heat input value. Power
intensity is defined as the ratio of the delivered power from the heat source to
the area over which the heat source is applied. Power intensity associated with a welding process directly affects the amount of heat required to be supplied
for welding. An increase in power intensity decreases the heat input because
it decreases the time required for melting the base metal. The decrease in time lowers the amount of heat dissipated away so most of the applied heat
on the faying surfaces is used only for melting (Kou, 2003). The advantages of
increasing the power intensity are deeper penetration, higher welding speed, better weld quality, and high capital cost as indicated in Fig. 1.4.
Gas Welding Processes (Oxygen Welding, etc.)
Arc Welding Processes (GMAW, GTAW, etc.)
Beam Welding Processes (EBW, LBW, RLW, etc.)
Low High
High
Low
Power Intensity Heat Input
Moving from point Ato point C, there is a increase in:
• Penetration
• Welding speed
• Weld quality
• Capital cost Point A
Point B
[image:29.595.136.511.315.491.2]Point C
Fig. 1.4. The variation of heat input to the workpiece with power intensity of the heat source [Adapted from Kou (2003)]
Most welding processes use heat to transform the base metal from solid to
liquid phase. The molten pool solidifies when the applied heat is removed.
During the solidification stage, grains are formed. The grain size is impor-tant because it affects the mechanical properties of the weld. The grain size
is determined by the number of nucleation sites in the molten pool and the
cooling rate (Zhao et al., 2013). Another factor influencing mechanical prop-erties is the presence of grain boundaries. They represent imperfections in the
crystalline structure that interrupt the continued movement of dislocations.
Therefore, smaller grain size and more grain boundaries are generally prefer-able from a design point because they increase the strength and hardness of
During the welding, the base metal is influenced by a thermal cycle, the rapid
heating and cooling. Such thermal cycle alters the microstructure of the base metal. The grain size is inversely proportional to the cooling rate, and the
main parameters influencing the cooling rate are welding speed, heat input
and power intensity (Sokolov et al., 2011). The RLW can produce deep and narrow welds at high welding speed with a smaller grain size because of its
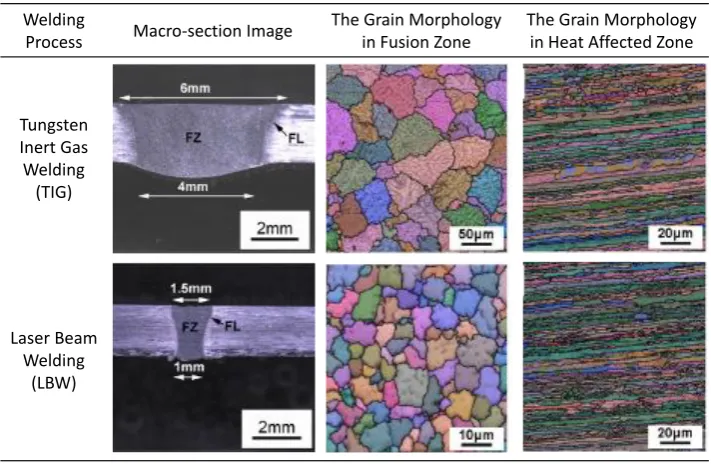
higher power intensity and lower heat input. Zhang et al. (2016) investigated
grain structure, tensile strength and hardness of the TIG and laser welding. The heat input of the TIG and laser welding is about 250 J/mm and 50
J/mm, respectively. Results showed that the mean grain size in the FZ for
both processes are 33.9µmand 6.1µmrespectively. It was noted that decrease in the heat input results in an increase in the average hardness and decrease
in the HAZ width. Macro-section image, the grain morphology in the FZ and
[image:30.595.141.497.381.613.2]the HAZ for both welding processes are given in Table 1.2.
Table 1.2: Macro-section images and the grain morphology of different zones in the joints [Adapted from Zhang et al. (2016)]
Welding
Process Macro-section Image
The Grain Morphology in Fusion Zone
The Grain Morphology in Heat Affected Zone
Tungsten Inert Gas Welding
(TIG)
Laser Beam Welding
(LBW)
To sum up, the RLW makes the welding process much faster with better
weld quality as well as helps to weight reduction. Furthermore, it provides flexible design due to the single-side access and large stand-off distance. However, the RLW
still faces many challenges in welding of zinc coated sheet metals, and in ensuring
1.2
The Research Scope
As for any other welding process, an unsuitable selection of process
param-eters leads to unacceptable weld defects. Without effective monitoring and control strategy, many engineering solutions have to be considered in order to overcome
quality related problems which will increase time and cost of production (You et al.,
2014; Stavridis et al., 2017).
Traditionally, weld quality is assessed manually which consists of four steps:
(i) establishing satisfactory welding parameters by procedure trials and testing,
(ii) selecting and maintaining the same parameters/procedure in production, (iii)
monitoring process by final inspection (i.e. non-destructive/destructive testing to
ensure that the required results are being achieved), and(iv)correcting for deviation from stated quality requirement by adjusting welding parameters. Furthermore, the
final inspection may involve selecting random samples from a batch of finished welds
and corrective action is normally based on statistical quality control techniques. The described approach, known asoff-line inspection, is costly, reduces productivity, and
requires dedicated test equipment and people.
To ensure the acceptable weld quality, to increase productivity and to elim-inate the need for post weld examination, the welding process can be monitored
during the process with sensors, known asin-process monitoring. The information
gathered from sensors is then transmitted to the process controller that fine adjusts the welding process parameters to produce consistently acceptable quality welds. It
must be pointed out that the weld quality, in terms of FZDs, is difficult to measure
directly during the welding process unless production is stopped which is nearly infeasible as it is economically unjustified; whereas, it is measured by signals and
relating these signals to relevant KPIs such as FZDs.
Therefore, development of in-process monitoring methodologies is essential to assure the weld quality. The quality assurance consists of two stages: (i) process
monitoring, and(ii)process control. The process monitoring is the manipulation of
measurements in determining the current state of the welding processes; whereas, the process control is the manipulation of process parameters based on the information
gathered from the monitoring stage in order to regulate the processes.
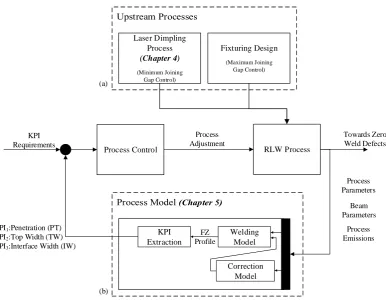
Figure 1.5 shows the outline of the dissertation consists of two major com-ponents as follows:
(a) The process parameters are defined as the parameters required to setup a welding process and they can be divided into two categories: (i) controllable
weld-ing speed, focal offset,etc.), and(ii) uncontrollable parameters are those that
cannot be modified during welding, such as joining gap. In this dissertation, the laser dimpling process (upstream process) is utilized to develop a joining
gap between two sheet metals. A methodology is developed inChapter 4to
select robust the laser dimpling process parameters in the presence of process variation.
(b) The primary aims of the proposed framework are to consistently produce
ade-quate quality welds by monitoring FZDs and to control the process parameters that affect FZDs. The effectiveness of the proposed framework is dependent
on the prediction of the process model. It is the mathematical
representa-tion of the actual process (i.e. remote laser welding process) which could be theoretical, empirical or simulation based.
Theoretical models are based on analytical solutions of governing physical
equations, empirical models are developed from experimental design methods for example response surface methodology, and simulation models are numeric
solutions of the governing physical equations with the help of computers. It
should be noted that the computational time and accuracy of the developed model should be as close as possible to the process time and the output (e.g.
macro-section image of the weld) to utilize the developed model in the pro-posed framework. A physics-driven model based on the occurring physical
phenomena is developed inChapter 5by considering the computational time
Process Control RLW Process
KPI1:Penetration (PT) KPI2:Top Width (TW) KPI3:Interface Width (IW)
FZ Profile KPI
Requirements
Process Adjustment
Towards Zero Weld Defects
KPI Extraction
Welding Model
Correction Model Fixturing Design
(Maximum Joining Gap Control)
Process Parameters
Beam Parameters Laser Dimpling
Process (Chapter 4)
(Minimum Joining Gap Control)
Process Emissions (a)
[image:33.595.130.517.103.403.2](b)
Fig. 1.5. The outline of the dissertation: (a) controlling minimum joining gap require-ment in the RLW process by utilizing the laser dimpling process (Chapter 4), (b) the physics-driven process model for quality assurance for the RLW process (Chapter 5)
Based on the aforementioned research scopes, the definition of the research
questions (RQ) are outlined as:
RQ 1 How to select robust dimple process parameters to achieve given quality
re-quirements in the presence of process variation?
The scope of this thesis is the laser welding of galvanized sheet metal which is highly utilized in the BIW due to its corrosion resistance, strength, cost and
hardness (Ma et al., 2012; Zhao et al., 2012; Chen et al., 2013). However, the
laser welding of this metal is unstable and difficult to control because of the vaporization temperature of the zinc (∼907◦C) is lower than the melting
tem-perature of the steel (∼1500◦C) resulting in highly pressurized zinc vapour
on the faying surfaces during the welding process. Left unaddressed, such zinc vapour can easily be trapped inside the molten pool which can lead to welding
defects such as porosity, spatter, burn-through, and severe undercuts (Norman
Over the past few years, various methodologies have been developed to
miti-gate zinc vapour from the welding medium without causing any disturbance in the molten pool and the keyhole. The state-of-the-art method in the
auto-motive industry is the ventilation of zinc vapour through a joining gap. The
required gap can be developed by, for example, “laser dimpling process”. It is a very promising manufacturing process as it does not require any additional
equipment and suppliers. Additionally, the same laser source and the fixture
adopted for welding can be utilized. In this process, dimples with a height of 0.05 mm - 0.2 mm are produced on the surfaces by the rapid movement of
the laser beam at a short distance. The number of dimples and the position
depends on the weld seam (i.e. linear or circular weld). After the realization of dimples, two sheet metals are placed in overlap configuration and welding
is performed.
Dimples work as a spacer between two sheet metals which control the mini-mum joining gap. On the other hand, the maximini-mum joining gap is controlled
by the welding fixture (Das et al., 2015). Since the joining gap is an
un-controllable process parameter and achieved by an upstream process, a novel methodology is introduced to control dimples so that minimum joining gap is
always achieved in the presence of process variation to prevent weld defects, such as blow-hole, spatters,etc.
According to the reviewed literature in Section 3.1, the research gap is
identi-fied as: (i) lack of KPIs to determine the dimple quality, (ii) complete char-acterisation of the dimpling process since the existing literature have focussed
mainly on single-input (i.e. welding speed), single-output (i.e. dimple height)
scenario (SISO scenario), and (iii) selection of process parameters for given quality requirement in the presence of the process variation.
RQ 2 How to directly monitor multi Fusion Zone Dimensions (Penetration, Top
Width, Interface Width) in the overlap laser welding of galvanized steels to
assess the weld quality?
Currently, data-driven process models are widely utilized for in-process
mon-itoring. These models work according to the principle of the acquisition of data (i.e. acoustic, optical and visual emissions) using sensors then correlated
them using multivariate statistical methods and machine learning algorithms to the formation of weld defects. The most common sensors in use today for
in-process monitoring are photodiode (Eriksson et al., 2010), high-speed and
According to the reviewed literature about process monitoring, which is given
in Section 3.2, the limitations of current data-driven in-process monitoring methods are that sensor signals are multi-dimensional and multi-modal, it is
often not realistic to use them directly as an input for control algorithms.
They do not monitor directly weld defects, but instead they monitor signals arising from the process and develop predictive models. As a result, changes in
process parameters or material properties can be handled only by rebuilding
these predictive models. Moreover, they are capable of detecting external KPIs but insufficient to directly monitoring internal KPIs, especially FZDs such as
interface width.
An alternative to the data-driven process model is a physics-driven model which numerically solves the governing physics in the laser welding process.
The developed model emulates the transverse cross-section of the weld.
How-ever, the problem is to obtain simulation results at a given accuracy within the welding process time. Therefore, a simplified model is developed that
al-lows a fast estimation of FZDs namely; penetration, top width; and interface
width. The key idea is to integrate the physics-driven model with gathered data to reduce computational time without losing accuracy. Furthermore, the
physics-driven model consists of four steps as: (i) calculating laser intensity acting on the material, (ii) calculating keyhole profile in using an analytic
method, (iii) solving the heat equation using FEM to calculate fusion zone
(FZ) profile, and (iv) aforementioned FZDs are obtained from the calculated FZ profile.
1.3
Research Objectives & Contributions
According toResearch Question 1, the following key objectives that will help to satisfy the aforementioned research gap to select the robust laser dimpling
process parameters to achieve given quality requirements in the presence of process
variation.
• Objective 1: To understand the quality requirements of a dimple:
In essence, the dimple works as a spacer between two sheet metals to create
a joining gap in which the zinc vapour is ventilated through. According to
the revised literature given in Section 3.1, the only studied key performance indicator (KPI) is the dimple height which directly affects the joining gap size.
welding. Thus, the dimple upper spot area can be another KPI to assess the
strength of a dimple to prevent excessive deformation of the dimple height un-der compression of clamping force. Furthermore, the excessive amount of laser
power creates a dark black spot on the lower surface of the sheet metal which
degrades the surface finish. The dimple lower spot area can be considered as another KPI to assess the aesthetic quality of a dimple.
• Objective 2: To obtain process capability space considering a multi-input,
multi-output (MIMO) based scenario:
Laser welding is a complicated multi-phases and multi-physics process which
involves interaction between the laser beam and material. This interaction is
governed by a number of factors including laser power, laser intensity distri-bution; and process parameters such as scanning speed, incidence angle and
focal offset. The proposed modelling approach addresses two key limitations
as discussed in the literature by taking into consideration (i) approximation of comprehensive multi-variate relations between multi-input (i.e. process
pa-rameters) and multi-output (i.e. key performance indicators), and(ii) process
variation over the design space by introducing deterministic and stochastic pro-cess capability spaces. The deterministic propro-cess capability space is a measure
of the dimpling process capability to satisfy simultaneously all the allowance limits of KPIs; whereas, the stochastic process capability space is the
estima-tion of success rate (SR) which is the probability of making a dimple that
satisfies simultaneously all the allowance limits.
• Objective 3: To find robust process parameters that are less sensitive to the
process variation:
The laser dimpling process is a pre-process for laser welding of galvanized sheet metals. It is important to note that the requirements of the laser dimpling
process are determined by an upstream process, such as assembly fixture design
and clamp layout optimization. For example, assembly fixture design for laser welding might require a specific value of KPIs with a given variability. In this
case, deterministic and stochastic process capability spaces are utilized to find
the robust process parameters that are less sensitive to process variation.
Based on the aforementioned objectives and the defined framework, the methodology for calculating surrogate driven deterministic and stochastic process
capability space have been proposed inChapter 4. The research contributions of
• Contribution 1: The new KPIs and their intervals are defined to assess the
dimple quality:
The product quality can be analysed by three features: (i) functionality,(ii)
durability, and (iii) aesthetic. According to the revised literature, one KPI,
which is the dimple height, is studied to address only the functionality of the dimple. Two new KPIs (i.e. the dimple upper spot area and the dimple lower
spot area) are introduced to address the remaining features. The dimple upper
and lower spot areas are utilized the assess durability and aesthetic quality of the dimple quality, respectively.
• Contribution 2: A comprehensive characterization of the laser dimpling
process:
The industrial needs are addressed in this study by(i) introducing two new
KPIs, and (ii) studying the effect of incidence angle and focal offset, which
are required for accessibility issue of the laser beam as well as scanning speed and laser track, which are required for the cycle time. Furthermore, the
de-terministic process capability space is introduced to find feasible the process
parameters which simultaneously satisfy all quality requirements. Due to the stochastic nature of the process, the feasible process parameters might produce
dimples that violate the allowance limits of KPIs. Therefore, the stochastic process capability space is introduced to measure the success rate using a
prob-abilistic approach. Based on the desired success rate, the natural specification
limits are determined to satisfy all quality allowance limits.
• Contribution 3: Process parameters selection and optimization using
surrogate-driven process capability space:
The proposed methodology offers a unique simulation tool which is generic and can be applied not only to the laser dimpling process but also it can be
exploited in the context of selection and optimization of process parameters
in the presence of process variation. The current best practice for process parameters selection is based on costly and time-consuming trial and error
approach. The proposed methodology offers identification of risky areas and
low reliable parameters settings which help to the selection of optimum process parameters and shorten the time for design and commissioning.
According to the Research Question 2, the following key objectives that
will help to satisfy the aforementioned research gap to directly monitor multi Fusion
• Objective 1: To develop a fast model by decoupling occurring multi-physics
in laser welding:
Laser welding is a complicated multi-phases and multi-physics process. As
discussed, there is a requirement for monitoring multi FZDs to assess the weld
quality. The lack of comprehensive models linking (i) in-process monitoring data (e.g. visual sensing, acoustic and optical emissions); with, (ii) multiple
quality indicators (e.g. penetration depth, interface width), and (iii)
weld-ing process parameters (e.g. laser power, weldweld-ing speed, focal point position) underscores the limitations of current data-driven in-process monitoring
meth-ods. Therefore, a model that gives results in a short time is required to predict
the transverse cross-section of weld in which FZDs are obtained. To meet this objective, the sequential decoupled multi-physics model has been developed.
The model calculates the keyhole profile in overlap joint using an analytic
method; and then, solves the heat equation using FEM to obtain FZDs.
• Objective 2: To integrate experiment and numeric simulation results to
im-prove the accuracy of the model:
The term fidelity refers to the level of accuracy or complexity of the developed model. A simplified numeric simulation model (i.e. Low Fidelity (LF) model)
of laser welding is developed by sequential solving the occurring physics. The key idea is to integrate the LF model with the experiment-based model (i.e.
High Fidelity (HF) model) to reduce computational time without losing
ac-curacy. For this purpose, two correction models are developed to increase the accuracy of the keyhole profile calculation in overlap joint. Then, heat
equation is numerically solved based on the corrected keyhole profile.
Based on the aforementioned objectives and the defined framework, the
methodology for calculating the decoupled multi-physics multi-fidelity (DMPMF) model is given proposed inChapter 5. The research contributions of the proposed
work are listed as:
• Contribution 1: Development of sequential decoupled multi-physics model
considering incidence angle and joining gap:
Complex welding simulation models have a realistic estimation of the FZ pro-file as well as FZDs, but they are often computationally expensive. Inexpensive
and less accurate the LF model can be achieved by dimension reduction, lin-earisation and considering simple physics. However, the LF model cannot be
directly utilized for in-process monitoring because the output of the LF model
the influence of the incidence angle on the keyhole shape has not been fully
addressed. In this work, the laser beam was assumed as a hyperboloid and the interaction of hyperboloid with any plane in the space was analytically
cal-culated so that the laser beam on-surface shape and the laser intensity were
obtained considering the incidence angle. According to the obtained intensity, the keyhole profile was calculated using a well-established analytical method.
• Contribution 2: Integration of correction model in to the LF model:
The multi-fidelity (MF) modelling method combines the information gain from both LF and HF models by using correction model. The correction model can
be based on either (i) scaling factor (β) which is the ratio of the HF model
results to the LF model results,(ii) discrepancy factor (δ) which is the differ-ence between HF and LF model results, or(iii) combination of both. After
obtaining scaling and discrepancy factor, the correction model is generally
de-veloped by employing surrogate modelling approach (i.e. regression, Kriging,
etc.). The MF model in this research is based on scaling factor to corrected
calculated the keyhole profile based on the decoupled multi-physics modelling
approach.
1.4
Thesis Organization
Chapter 2 provides background information and basics concepts relevant
to this thesis such as the operational characteristic of the laser welding process, the
weld quality assessment criteria.
Chapter 3reviews the related literature in the field of zinc vapour mitigation methods during the laser welding of galvanized steels by addressing limitations in
terms of manufacturing perspective; and highlighting the research gap in the laser
dimpling process which is the best practice in the automotive industry. Further, it reviews the reported work in the field of thermal modelling and prediction of fusion
zone dimension in laser welding of steels.
Chapter 4presents the methodology used for process parameters selection
and optimization using surrogate-driven process capability space. Deterministic
and stochastic process capability spaces are developed by the proposed success rate.
It is calculated as the probability value of satisfying the allowance limits of given KPIs namely; dimple height, dimple upper spot area, and dimple lower spot area.
The developed process capability spaces are used to optimize process parameters under competing quality requirements such as maximizing the dimple height while
Chapter 5 introduces a novel decoupled multi-physics multi-fidelity
(DMPMF) model for predicting multi FZDs (penetration, top and interface widths) in overlap laser welding of galvanized steel. The key idea is to calculate keyhole
pro-file in overlap joint using an analytic method; and then, to solve the heat equation
to obtain the transverse cross-section of weld in which FZDs are obtained by looking melting isotherm. The key idea is to incorporate results derived from the welding
ex-periments (high fidelity model) into the low fidelity model to reduce computational
time without losing accuracy.
Chapter 6presents the overall thesis conclusions and indicated a direction

![Fig. 1.4. The variation of heat input to the workpiece with power intensity of the heatsource [Adapted from Kou (2003)]](https://thumb-us.123doks.com/thumbv2/123dok_us/9427409.447305/29.595.136.511.315.491/fig-variation-input-workpiece-power-intensity-heatsource-adapted.webp)