warwick.ac.uk/lib-publications
Original citation:
Basik, Fuat, Gedik, Bugra, Ferhatosmanoglu, Hakan and Wu, Kun-Lung (2018) Fair task
allocation in crowdsourced delivery. IEEE Transactions on Services Computing .
doi:10.1109/TSC.2018.2854866
Permanent WRAP URL:
http://wrap.warwick.ac.uk/106585
Copyright and reuse:
The Warwick Research Archive Portal (WRAP) makes this work by researchers of the
University of Warwick available open access under the following conditions. Copyright ©
and all moral rights to the version of the paper presented here belong to the individual
author(s) and/or other copyright owners. To the extent reasonable and practicable the
material made available in WRAP has been checked for eligibility before being made
available.
Copies of full items can be used for personal research or study, educational, or not-for profit
purposes without prior permission or charge. Provided that the authors, title and full
bibliographic details are credited, a hyperlink and/or URL is given for the original metadata
page and the content is not changed in any way.
Publisher’s statement:
© 2018 IEEE. Personal use of this material is permitted. Permission from IEEE must be
obtained for all other uses, in any current or future media, including reprinting
/republishing this material for advertising or promotional purposes, creating new collective
works, for resale or redistribution to servers or lists, or reuse of any copyrighted component
of this work in other works.
A note on versions:
The version presented here may differ from the published version or, version of record, if
you wish to cite this item you are advised to consult the publisher’s version. Please see the
‘permanent WRAP url’ above for details on accessing the published version and note that
access may require a subscription.
Fair Task Allocation in Crowdsourced Delivery
Fuat Basık
†∗, Bu ˘gra Gedik
†, Hakan Ferhatosmanoglu
§, Kun-Lung Wu
‡†
Department of Computer Engineering, Bilkent University, Turkey
§
Department of Computer Science, University of Warwick, UK
‡
IBM Research, New York, USA
[email protected], [email protected], [email protected], [email protected]
Abstract—Faster and more cost-efficient, crowdsourced delivery is needed to meet the growing customer demands of many industries, including online shopping, on-demand local delivery, and on-demand transportation. The power of crowdsourced delivery stems from the large number of workers potentially available to provide services and reduce costs. It has been shown in social psychology literature thatfairnessis key to ensuring high worker participation. However, existing assignment solutions fall short on modeling the dynamic fairness metric. In this work, we introduce a new assignment strategy for crowdsourced delivery tasks. This strategy takes fairness towards workers into consideration, while maximizing the task allocation ratio. Since redundant assignments are not possible in delivery tasks, we first introduce a 2-phase allocation model that increases the reliability of a worker to complete a given task. To realize the effectiveness of our model in practice, we present both offline and online versions of our proposed algorithm called F-Aware. Given a task-to-worker bipartite graph, F-Aware assigns each task to a worker that minimizes unfairness, while allocating tasks to use worker capacities as much as possible. We present an evaluation of our algorithms with respect to running time, task allocation ratio (TAR), as well as unfairness and assignment ratio. Experiments show that F-Aware runs around107×faster than the
TAR-optimal solution and allocates96.9%of the tasks that can be allocated by it. Moreover, it is shown that, F-Aware is able to provide a much fair distribution of tasks to workers than the best competitor algorithm.
Index Terms—spatial crowdsourcing, crowdsourced delivery, fairness.
F
1
I
NTRODUCTIONSpatial crowdsourcing has emerged as a viable solution for delivery logistics, such as on-demand local delivery, online shopping, and on-demand transportation [10]. As such, it has attracted significant attention from both the academia and the industry in recent years. For instance, Amazon utilizes the crowd to provide same day shipment of packages from warehouses to customers1. Postmates2, a company offering on demand food and delivery, is available all around the US. Enormous growth of the crowdsourced taxi services Uber3and Lyft4has attracted significant inter-est, resulting in numerous research studies being conducted about them.
Crowdsourced delivery applications have three stake-holders: customers, workers and the matching platform. Customers submit tasks of spatial deliveries to the plat-form. The platform matches the tasks with the workers’ availabilities, and allocates workers to tasks considering the spatio-temporal requirements. To support faster and cheaper delivery, spatial crowdsourcing platforms require a critical mass of workers. The workers should be attracted by a high income potential which is possible with a large number of customers. This situation drives these platforms into a chicken and egg problem [29], in which a powerful network is necessary to attract customers and customers are necessary to engage a powerful network.
* Part of this work was done while the author was an intern at IBM. 1. http://flex.amazon.com
2. http://www.postmates.com 3. http://www.uber.com 4. http://www.lyft.com
A negative correlation between job satisfaction and worker turnover is naturally expected in crowdsourcing environments. According to a study with MTurk workers, a common indicator of positive behavior of the employer, hence the job satisfaction, is fairness [7]. Fairness can be defined in the context of anti discrimination laws, equity of opportunity and equality of outcome [37], [3]. In the context of crowdsourcing, the distributive fairness is particularly relevant [16], [17]. This definition seeks fairness based on the proximity between a worker’s own input/output ratio and the input/output ratio of a referent [1]. For example, the workers would expect to be assigned a fair number of tasks that is proportional to their spatio-temporal matching qualities/availabilities for the tasks. Effect of such fairness expectations on the likelihood of participation is more than that of considerations of self-interest [17]. Hence, fairness needs to be considered as an essential concept for sustaining a powerful crowd with significant participation of work-ers [5].
full time couriers [29], it ignores fairness and worker satis-faction. This can result in lower engagement and migration to other services. [16].
There is a number of challenges to achieve an effective and fair crowdsourced delivery. First, unlike other crowd-sourcing applications, a redundant allocation of tasks is not possible in the crowdsourced delivery. Redundant allocation improves the reliability of task completion by increasing the number of workers the task is assigned to [10][21]. In delivery tasks, however, only one worker can be allocated to complete the task. Hence, to increase the reliability of the worker selection in such tasks, we employ a 2-phase allocation model. In the first phase, the platform selects a set of nominees among available workers and the task is offered to a subset of them. In the second phase, the platform selects one worker among those who accepted the offer. This avoids the broadcasting of the offer to all nominees in the first phase to forestall spamming of the workers.
The second challenge is to providedistributional fairness among workers to ensure participation. Unless workers and their availabilities are identical, assigning each worker an equal number of tasks is not a fair distribution, as it does not take the user input into consideration. To address this issue, we call the input/output ratiolocal assignment ratioand set the output of a worker as the amount of revenue she gets from the system, while the input is the total reward of the offers she has accepted (not necessarily allocated). This view allows us to define a technical measure of the global fairness as the coefficient of variation, a statistical measure of relative variability, of alllocal assignment ratios. A low coefficient of variation is associated with the fairness of allocation.
Without considering fairness, the task allocation problem can be reduced to the minimum cost flow (MCF) prob-lem [21]. However, the MCF-based solutions fall short to capture fairness, since every assignment needs to update its cost matrix. We introduce F-Aware as a solution to assign tasks to workers in a bipartite graph, by minimizing the un-fairness locally and allocating tasks to fill worker capacities. The third challenge is to handle online allocation. In applications such as online shopping (e.g., with a 3-hour delivery guarantee), the platform can allocate multiple tasks in mini-batches with no global knowledge of all tasks and availabilities in advance. In contrast, in on-demand trans-portation services, like Uber and Lyft, customers want to know whether the vehicle is on the way, almost instantly. Therefore the allocation should be done at the very moment of the task arrival. F-Aware with the 2-phase model is shown to be applicable for offline, online, and mini-batch allocation strategies.
In summary, this paper makes the following contribu-tions:
• Model.We introduce a generic task allocation model to cover a variety of crowdsourced delivery sce-narios. The 2-phase allocation model increases the reliability of task completion by double-checking a worker’s willingness to complete the tasks. This modelhandles the case where a potential worker may refuse the task even though she is available.
• Algorithm.We introduce a fairness-aware solution calledF-Aware, which locally minimizes unfairness,
while targeting maximum task allocation. The MCF-based algorithms fall short on modeling the dynamic fairness metric, and are not feasible for the online scenarios.
• Online Allocation.We enhance our 2-phase model to perform online task allocation. We show that F-Aware is effective also for online and mini-batch allocation scenarios, as it is for offline allocation.
We provide a comprehensive experimental study using real-world datasets to showcase the effectiveness and effi-ciency of our 2-phase model and of theF-Awarealgorithm in terms of running time, task allocation ratio, and fairness it achieves.
The rest of this paper is organized as follows. Section 2 gives the preliminaries of the problem. Section 3 explains the details of our 2-phase task allocation model. Section 4 extends our approach to online task allocation. Section 5 presents the experimental evaluation. Section 6 discusses the related work. Finally, Section 7 concludes the paper.
2
P
ROBLEMD
EFINITIONWe aim to develop a new strategy on allocation of tasks to workers in a crowdsourced environment. The overall goal is to maximize the task allocation ratio (TAR), the ratio of number of allocated task over the number of all tasks, while distributing tasks to workers fairly. We now give the preliminaries of the domain and formalize this multi-criteria optimization problem.
Definition 1.Time period.A time period,h, is a pair of date-time valuesbande, representing the beginning and end times, respectively.
Definition 2.Delivery task.Tasks are in the form of spatio-temporal deliveries, such as workers need to move to the source of the delivery to receive the item and deliver it to the recipient. In this manner, one can consider a task as a composite of receive and deliver steps. We represent the set of all tasks withT, and ith
task with ti. A task is a quintuple{hs, ls, hr, lr, m}.Here,handl
represents a time period and a geo-spatial point such as a latitude/longitude pair, respectively. Subscriptssand r stands for the source and the destination of the task. In other words, ti.ls stands for location of the source
whileti.lr stands for location to deliver the item forith
taskti. Note that these steps are associated with different
time periods, asreceiveanddeliversteps have their own validity periods hs and hr. Lastly, m represents the
reward of the task.
Definition 3.Worker.Workers are people who participate in the platform to make money. We represent the set of all workers withW, andithworker withw
i. Each worker, is
a triple{A, c, f}.wi.Ais the set ofavailabilitiesof worker
wi,wi.cis her capacity andwi.f is the local assignment
{ls,hs,lr,hr,m}
Refinement of Nominees (Task Allocation and Assignment Ratio)
Selection of Best (Task Allocation Ratio and Fairness) Candidate
A llocation
L ( t
j, )
[image:4.612.52.561.43.183.2]{h,l,r}
Fig. 1: Tasks and availabilities are the inputs of the platform. For each task, the nominees are identified. During this calculation, the system also finds out theacceptance probability, based on Equation 8. The task is multicasted tokof those nominees. Workers who accept the offer are referred to ascandidatesand one worker among the candidates is selected for allocation.
Definition 4.Availability.Workers inform the system about their working status using availabilities. aip is the pth
availability ofithworkerw
i, such thataip ∈wi.A. Each
availability is a triple,{h, l, r}.aip.lis a geo-spatial point.
It is the center of the region in which wi is willing to
accept tasks. aip.ris the radius of the same region. Let
us represent this region with theCr(l, r)function. The worker is ready to serve during the time periodaip.h.
For a task,ti, to be completed, a worker has to move to
thereceivelocation,ti.ls, during its validity periodti.hs; and
after that, she has to move to thedeliverlocation,ti.lr, during
its validity periodti.hr. An example tasktiin crowdsourced
delivery could be to pick-up a gift item from a local shop (ti.ls) between 12:00 and 14:00 on 23rd of December 2016
(ti.hs), and deliver it to a home address (ti.lr) between 18:00
and 22:00 on the same day (ti.hr). In return for completing
this task, the worker will be paid ti.m amount of money.
In the real world, multiple parameters effect theti.mvalue,
including the distance betweenti.lsandti.lr, the size of the
package, and the sensitivity of the content, etc.
2.1 Fairness
An effective network is key to building a powerful crowd-sourcing platform, therefore, providing continuous partici-pation of workers and avoiding worker turnover are crucial. A negative correlation is naturally expected between job satisfaction and worker turnover in crowdsourcing envi-ronments. According to a study with MTurk5 workers,11 to26percent of turnover in crowdsourcing environment is explained with job satisfaction. In the same study, fairness is listed as one of the most common indicator of the job satisfaction [7], [30]. Fairness needs to be considered as a first class citizen in designing crowdsourcing applications to ensure long term commitment and participation [5].
There are three major forms of fairness defined in the social psychology literature, namely:procedural,interactional, anddistributive.Proceduralfairness is the perception of jus-tice on the procedures, policies, and the criteria used by the decision maker [16].Interactionalfairness is the interper-sonal aspect of the procedural fairness. Distributivefairness
5. http://www.mturk.com/
is defined as the proximity between a worker’s own in-put/output ratio and the inin-put/output ratio of a referent [1]. Prior research on the relationship betweenfairness and job satisfaction shows that when fairness is regressed along all three dimensions, the job satisfaction gets impacted the most due to the loss of distributed fairness[30]. Note that, unless the workers are identical, assigning each worker to an equal number of tasks is not a fair distribution by this definition, as it does not take user input into consideration. Therefore, we define a new fairness model that captures distributive fairness, which will be detailed shortly.
2.2 Formalization
With the given definitions, let us first define the problem before discussing each component separately.
Fair allocation of delivery tasks in a crowdsourcing environment: Given the set of delivery tasks T and the set of workersW, represented with their availabilities, the problem is allocating tasks to workers with the goals of maximizing the task allocation ratio (T AR) and minimizing the unfairness (F) objectives, under thecandidacy,capacity and assignment ratio (AR) constraints which will be explained next.
Task Allocation Ratio (TAR): To reduce the dependency of the businesses to using a third party service we set maximizingtask allocation ratio (TAR)as the first component of our objective function. T AR is defined as the ratio of the number of allocated tasks over the number of all tasks. Formally, letTallbe the set of allocated tasks andT be the
set of all tasks. TheT AR, defined as:
T AR= |Tall|
|T | (1)
nominees, and they have an opportunity to accept or reject it. A worker may refuse the offer, even though she is available. For brevity, we leave the details of nomination and offering strategy to the next section. Workers who have accepted the offer are calledcandidates. In the second phase, one worker among the candidates is selected and is assigned to the task.
Fairness: Recall that distributive fairness is defined as the proximity between a worker’s own input/output ratio and the input/output ratio of a referent. In the 2-phase allocation model, the input of a worker is the total reward of the offers she accepted. Note that availabilities cannot be used as input since a worker might reject offers even though she is available. The output of a worker, on the other hand, is the amount of money she earned. Intuitively, not all tasks have the same complexity, yet the reward of each task is proportional to its hardness. To capture the hardness of the tasks while determining a worker’s input/output ratio, instead of counting the number of tasks a worker accepted or got assigned, we use the reward of each task. Each worker wi is associated with a local assignment ratio (LAR), w.fi,
defined as the ratio of the total reward of tasks allocated to a worker (output) over the total reward of tasks she has accepted (input). Formally, let wi.Tall be the set of tasks
allocated to workerwi, andwi.Tacc is the set of offers she
has accepted, the LAR ofwiis defined as:
wi.f =
Px
j=1tj.m
Py
k=1tk.m
, ∀j,ktj∈wi.Tall, tk∈wi.Tacc (2)
where
x=|wi.Tall|and y=min(|wi.Tacc|, wi.c) (3)
The number of tasks a worker accepts can exceed her ca-pacity, since she will be assigned to a subset of the tasks she has accepted. However, since the capacity limits the number of allocations, we consider minimum of {|wi.Tacc|, wi.c}
acceptances when calculating the denominator. The system is considered more fair as the proximity of theLARvalues will be higher. Although the standard deviation of the set of LAR values represents this proximity, using it as the evaluation metric would be misleading since the different allocation schemes will have different number of tasks allo-cated. Hence, we evaluate the overall fairness of the system, F, using coefficient of variation of the set of LAR values, i.e., standard deviation of the LAR values divided by their mean. LetF be the set of alllocal assignment ratiovalues of users system fairness,F, is formalized as:
F= σ(F)
µ(F) (4)
Candidacy Constraint: Recall wi.Tacc is the set of tasks
worker wi has accepted. A given tasktj can be assigned
to workerwi only if the systemnominatedher for the task,
and sheacceptedthe offer:ti ∈wi.Tacc.
Capacity Constraint:Definition of the capacity constraint is intuitive. The number of tasks assigned to a worker cannot exceed her capacity:|wi.Tall| ≤wi.c.
[image:5.612.314.565.48.197.2]Assignment Ratio Constraint:Note that each task is offered
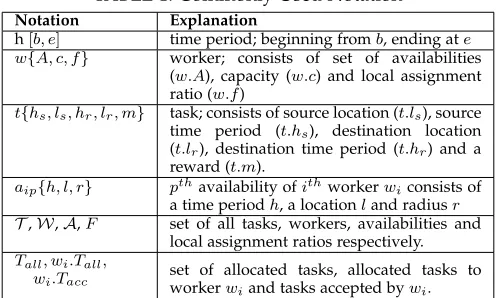
TABLE 1: Commonly Used Notation
Notation Explanation
h[b, e] time period; beginning fromb, ending ate w{A, c, f} worker; consists of set of availabilities
(w.A), capacity (w.c) and local assignment ratio (w.f)
t{hs, ls, hr, lr, m} task; consists of source location (t.ls), source
time period (t.hs), destination location
(t.lr), destination time period (t.hr) and a
reward (t.m).
aip{h, l, r} pthavailability ofithworkerwiconsists of
a time periodh, a locationland radiusr
T,W,A,F set of all tasks, workers, availabilities and local assignment ratios respectively.
Tall, wi.Tall,
wi.Tacc set of allocated tasks, allocated tasks to
workerwiand tasks accepted bywi.
to a set of nominees, yet among the candidates who accept the offer, only one worker will be selected. To forestall spamming of workers and avoid unnecessary communi-cation costs, we avoid broadcasting offers to nominees. At the one extreme, the task can be repeatedly unicasted until onenomineeaccepts it. However, this approach would cause potentially long wait times. Therefore, we present a hybrid solution: multicasting the offer tokworkers, which avoids spamming of the workers while increasing the probability of at least one nominee accepting the offer. The value ofkis calculated for each task independently. In the next section, we show that higher values ofkwill result in higher number ofcandidates, but it leads to a large set of spammed workers. To be able to define an upper limit, we introduce a system-wide metric calledassignment ratio (AR), which is the ratio of thenumber of allocated tasksover thenumber of accepted offers. Higher AR indicates more accurate nominee selection, or less number of spammed workers. Therefore, we constraint assignment ratio to be higher than a predefined thresholdθ. We formalize theARas follows:
AR= |Tall|
P|W|
i=1|wi.Tacc|
(5)
And defineassignment ratioconstraint asAR≥θ. Later, we will discuss relaxing this constraint to decrease the wait time of the customers.
3
A
LLOCATIONM
ODELIn this section, we describe the details of the 2-phase allo-cation model. Inputs to the system are the tasks from the customers, and theavailabilitiesfrom the workers, both with time and location components. In many practical cases, both the tasks and the availabilities are registered in advance. Hence, one needs to check if a worker is still willing to do the job. Our model is able to do this check to increase the reliability of the worker with respect to the completion of the given task. In the next section, we also cover the online allocation scenario, in which tasks and availabilities can appear anywhere, anytime.
tj.ls tj.lr
wi aip wi aiq
d ( tj.ls, tj.lr)
wi aip
[image:6.612.62.287.44.120.2]tj.ls tj.lr
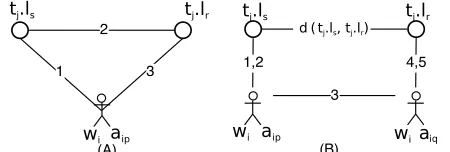
Fig. 2: Movement cost calculation of a task is different de-pending on the number of availabilities satisfying it. Roads are numbered with respect to travel order.
3.1 Nomination of Workers
Initial step of the 2-phase allocation procedure is to find out the appropriate set of workers to offer the task. These workers are called nominees. For a workerwi to be
nomi-nated to a tasktj, her availability set,wi.A, should contain
the necessary availabilities to satisfy both steps oftj. Recall
since tasks are in the form of spatio-temporal deliveries, one can divide them into two: receive and deliver steps. Satisfying one of these parts, lets assumereceive, means that worker wi should have at least one availability aip, such
that time period of task tj.hs intersects with time period
of availabilityaip.hand source locationtj.lslies inside the
regionCr(aip.l, aip.r).
One can formalize the satisfaction relation between a step,receiveordeliver, of a tasktj and anavailabilityaipof a
worker as a functionS:
S(tj.hs, tj.ls, aip)≡(tj.hs∩aip.h6=∅)∧ (tj.ls∈Cr(aip.l, aip.r))
(6)
The intuition behind dividing the tasks into two steps is that, a worker can have separateavailabilitiessuch that one satisfies the requirements of thereceive step and the other satisfies thedeliverstep. Given the set of workers, the system searches for those workers that have satisfying availabilities for both steps of a task. To formulate this relation, we employ the S function to locate the pair of availabilities of a worker wi that satisfy the receive and deliver steps,
respectively. We denote the resulting function asN(tj, wi).
If no such pair can be located, then the function produces an empty set.
N(tj, wi) =
{aip, aiq}
∃aip∈wi.A|S(tj.hs, tj.ls, aip)∧
∃aiq∈wi.A|S(tj.hr, tj.lr, aiq)
∅ otherwise
(7) We should note that, in Equation 7,pandqvalues can be equal, which means a singleavailability might satisfy both requirements.
It would be unrealistic to assume that all nominated workers will have the same probability to accept the of-fered task. Besides availability, there are many factors that influence such a decision. Existing research showed that workers are willing to accept the tasks that are less costly for them and closer to their home locations [2]. Therefore, the acceptance probabilityof each nominated worker for a given task is negatively correlated with the task’s cost, which is the movement cost in our case.
Many existing local delivery systems use the distance between the source and the destination as an indicator of the payment amount. It means that, tasks which require longer traveling pay more to their workers. On the other hand, the movement cost of a task might differ between workers, as they should move towards the source from their current location or move back to their previous location from the destination. Since we do not track the workers’ locations, we assume that a worker is at the location provided as part of her valid availability and she tends to go back to that location, after completing the deliver step. We also assume that the acceptance does not depend on the previous acceptances or rejections.
Figure 2 shows two different scenarios regarding the calculation of the movement cost of a task. Let us define the movement cost of a task as α+β, and let dbe the func-tion that calculates the distance between two geo-spatial points. The distance between source and the destination, given by α = d(tj.ls, tj.lr), remains the same no matter
which worker is assigned to the task. On the other hand, the distance traveled towards the source and from the destination,β, depends on the worker availabilities. In the first scenario, single availability of the worker,aip, satisfies
both of the steps of the task. Therefore, the worker will only move towards the source, and from the destination (β = d(aip.l, tj.ls) +d(tj.lr, aip.l)). In the second scenario
however, after moving towards the source, as well as after delivering the item, worker will go back her initial posi-tion. Moreover, distances between the locations of those availabilities should be considered as well. Consequently, workers movement in the second scenario would be equal toβ = 2×d(aip.l, tj.ls) + 2×d(tj.lr, aiq.l) +d(aip.l, aiq.l).
The reward of the task is positively correlated with α and indifferent to who completes the task. Minimum value for the total travel distance is2×α, which happens when the worker is already at the source location, or at the destination location, or lies on the linear line connecting these two points, i.e.α = β. Intuitively, workers are will-ing to accept tasks with high income and less movement. Therefore, acceptance probability of a tasktj by workerwi,
denoted as R(tj, wi), is positively correlated with α, but
negatively correlated with β. For the ideal case, α = β acceptance probability should be1. We formalize this model in Equation 8. To take into account the probability of a worker refusing an offer even when she is a perfect match, we use a constantc, where0≤c≤1.
R(tj, wi) =eα−β×c (8)
Sinceα≤βand0≤c≤1the value ofRis guaranteed to lay between 0 and 1. Selection of nominees for a task tj outputs the setL(tj,W), which contains the workerwi
and acceptance probabilityR(tj, wi)pair. This set is used
in our batched progressive offer strategy, a technique we implement to minimize the waiting time, while maximizing theassignment ratio.
through the availabilities set A and calculates R(tj, wi) if
N(tj, wi) 6= ∅, for each worker wi ∈ W. For all tasks,
complexity of this calculation isO(|T ||A|). To decrease the computation time, we index availabilities on the temporal dimension using interval trees. For each task, we query this index two times, one for the receive step, and one for the deliver step. We check the spatial intersection only for the resulting availabilities. In theOnline Task Allocationsection, we discuss how long to wait between task arrival and nominee selection processes.
3.2 Batched Progressive Offer Strategy
There are three different approaches regarding offering a task to a predefined set of nominees. The first approach is broadcasting the offer. To forestall spamming of workers and avoid unnecessary communication costs, we avoid broadcasting offers to nominees. Moreover, we want to minimize the number of cases where a worker accepts the incoming offer but is not allocated to the task, as this might cause churn over time. Therefore, the ideal case is when there is exactly one candidate. Reaching this ideal case is only possible with unicasting the offer. However, there is the probability of the nominee rejecting the offer, even though she is available. Therefore, the system should follow a progressive approach, by offering the task one by one, until somebody accepts, and waiting for a preset time between each round. Obviously, this will result in a long waiting time for the customer to see if his task is going to be served or not. To avoid both situations, we multicast the offer toknominees in batches, progressively, until there is at least one candidate. With this approach, we decrease the waiting time of the customer, while limiting the number of candidates. For each task, once the value ofkis calculated, it is used for further batching, if necessary.
Let us call the probability of the task being accepted by at least one nominee asprobability of response. For each task tj, the probability of response, when offered toknominees,
can be calculated using the probability of all k nominees refusing it. Recall thatL(tj,W)is the set of nominee and
acceptance probability pairs, and assume that it is sorted by theacceptance probabilityvalues. Probability of response for a batch ofkworkers is calculated as follows.
P(k, L(tj,W)) = 1− k
Y
i=1
(1−(R(tj, wi))) (10)
By keeping the value of P(k, L(tj,W)) above a tuning
parameter, the lower bound of the kcan be defined. We call, thethreshold of probability of response.
The upper bound, however, is calculated using the as-signment ratio as a constraint. To limit the value of k, first we should be able to predict how many nominees are likely to accept the offer. In the worst case for assignment ratio allknominees accept the offer. As we try to maximize the assignment ratio, the number of candidates should not exceed a certain number. Although it is not realistic to expect that all kworkers will accept the offer, it is still useful to limit thekvalue.
Given a task tj, let us define the probability of ith
worker accepting the offer as a random variable xi. Then
the expected value of it isE[xi] = R(tj, wi). Transforming
into multiple workers, assignment ratio would be one over the number of candidates, therefore, it would be equal to
E[x 1
1+x2+...+xk]. From probability theory, it is known that
E[x1+x2+1...+x
k] ≥
1
E[x1+x2+...+xk], thus the latter could
be used as a lower bound for the expected value, where, E[x1+x2...+xk] = R(tj, w1) +R(tj, w2) +...R(tj, wk).
With this at hand, let us define a functionE(k, L(tj))as a
lower bound for the expected value of theassignment ratio:
E(k, L(tj,W)) =
1
E[x1+x2+...+xk]
(11)
Recall one of the constraints is keeping the assignment ratio of the system above a predefined threshold θ. We use the same threshold, as a lower bound to function E(k, L(tj,W))to satisfy assignment ratio constraint locally,
for each allocation. Although local satisfaction is stronger than the global constraint, as we will discuss next, the assignment ratio constraint is relaxed when it contradicts with the probability of response.
While the probability of responseP(k, L(tj,W))is
pos-itively correlated withk, as it is shown above, the expected value of the assignment ratio (value of E(k, L(tj,W)))
de-creases with it. Therefore, boundingE function from below, sets an upper bound on the value of k. With the above defined thresholds, the value of k should guarantee that probability of responseP(k, L(tj,W))is above, while the
assignment ratio constraint is satisfied for each task, i.e. E(k, L(tj,W))is aboveθ.
In summary,kis selected using following inequality:
k≥min{k|(P(k, L(tj,W))≥}
k≤max{k|E(k, L(tj,W))≥θ}
(12)
kis set to the maximum value that satisfies both of those inequalities. However, the given inequality might be invalid with respect to selection of theandθvalues. Consider that, even the smallest k value satisfying the upper inequality might not satisfy the lower one. In that case, we relax the assignment ratio constraint, and use thekthat satisfies the upper inequality.
After this calculation, the task is offered to the first k workers and the system waits for a predefined time. Recall that, workers are sorted in the decreasing order of the acceptance probability. In case of all nominees refuse the offer, the task is offered to the nextkworkers, until there is at least one candidate or all nominees are asked.
3.3 Task Allocation
The last step of the 2-phase model is to select one worker among the candidates to allocate the task.
Figure 3 shows an example scenario in which there are three tasks and three candidates. The edges are from tasks to their candidates. For examplet1is accepted byw1andw2,
whilew1is the only candidate fort2. The simplest version of
Fig. 3: Allocation of tasks to candidates
edge weights to represent movement cost and add capacity to workers as well. Including these additional constraints, the task-to-worker bipartite graph can be represented as a flow graph by adding a source and a sink. With this repre-sentation, task to worker allocation can be reduced to the minimum cost flow (MCF) problem and solved optimally with well known algorithms, i.e. successive shortest path or cycle canceling [21].
Even though they reach optimal result on task allocation, minimum cost flow based solutions have their own draw-backs. First of all, running time of the optimal solution is far from being feasible because of high complexity. Given the task to candidate bipartite graphG(E, V), s.t.V =T ∪ W andE represents the acceptances, the complexity of a care-ful implementation of successive shortest path algorithm is O(|V||E|log|V|). Second, with the aforementioned defini-tion offairness, it is hard to integrate it into the MCF-based algorithms. This is because at each iterationLARvalues are updated, which updates the cost-matrix as well.
Assuming that LAR values are static, introducing fair-ness as a new constraint transforms the problem to mini-mum cost maximini-mum flow problem. The goal of this prob-lem is to select the minimum cost flow among multiple maximum flows. In our setting, this corresponds to max-imizing task allocation ratio while minmax-imizing unfairness objectives. This problem could be solved with Hungarian algorithm, however, similar to the previous discussion, the high complexity of the algorithm,O(n3), makes it inefficient
for online allocation scenarios [24].
The na¨ıve approach for allocation is random selection of one candidate, which is used as one of the baselines in our experimental evaluation. On the other hand, to capture the spatial aspect of crowdsourced delivery, it is beneficial to allocate the nearest worker [21]. This approach can be extended by proactive allocation of workers, if distribution of tasks is known in advance [25]. Last but not the least, inspired from file allocation techniques from the operating systems literature, selecting the Least Allocated Worker first could increase the Task Allocation Ratio by reserving room for further allocations. While all approaches are feasible in terms of their running time, our experimental evaluation shows that they either fell short in terms of modeling the fairness or have subpar performance with respect to task allocation when the capacity is constrained.
To cope with the aforementioned challenges, we intro-duce an algorithm calledF-Aware, given in Algorithm 1. It is a greedy algorithm that allocates tasks to workers one by
Alg. 1:F-Aware Task Allocation
Data: G(E, V): Task-Worker Bipartite Graph s.t.V =T ∪ W
Result:G0(E, V):Updated Bipartite Graph
G0(E, V)←G(E, V) .Copy the original graph
T ←sort(T) .Tasks sorted in increasing order of in-degree
fort∈ T do .For each task in task list
.Get the subset of workers sharing an edge witht
W0←G(E, V).get(t)
W0←sort(W0).Workers sorted in increasing LAR order
isAssigned←F alse
index←0
while¬isAssigned&&index <|W0|do .Assignment is not done but there are still candidates
w←W0.get(index)
ifw.c >0then .If worker has capacity
G0(E, V)←G0(E, V)∪assign(t, w) .Mark edge
prof it(w)←prof it(w) +t.m .Update profit
w.c←w.c−1 .Decrease capacity
isAssigned←T rue
else
index←index+ 1
returnG0(E, V) .Return the modified bipartite graph
one. Given the task-to-worker bipartite graphG(E, V), s.t. V = T ∪ W, it considers tasks in the increasing order of the node in-degree. Tasks with less candidates are placed first, as the ones with higher degree have more flexibility. For each task, each worker with remaining capacity higher than 0 is considered as a candidate and the one with the lowest local assignment ratio is selected. If there are more than one worker with the same LAR, the one with the higher denominator is selected. Recall that if the capacity of a worker, wi.c, is lower than the number of tasks she
has accepted, we only consider the first wi.c offers. The
process continues until all tasks are visited. When a tasktjis
assigned to a workerwi, the input graph, the total earnings,
and the residual capacity ofwiare updated accordingly.
Our experimental results confirm the effectiveness of F-Aware in terms of running time, task allocation ratio, and fairness it achieves.
4
O
NLINET
ASKA
LLOCATIONWhile in offline allocation based applications, all the tasks and availabilities are known in advance, in real-time en-vironments, they can appear at anytime, anywhere [36]. Consider an example scenario, in which a customer would like to travel to airport and asks the crowd for a ride. Overnight reply to this request would be too late, as the user would take a taxi after waiting for a relatively small amount of time. In fact, these dynamically arriving requests require online processing. Therefore, the problem ofallocating tasks to workers in a dynamically changing environmentraises.
each other when the period expires. In this section, we present our modifications on the 2-phase allocation model to cover both instant and mini-batch allocation scenarios.
Figure 1 shows the illustration of the workflow for the 2-phaseallocation model. Our first modification for adapt-ing this workflow to online task allocation is addadapt-ing two windows on the selection of nominees. These windows are for the tasks and for the availabilities, respectively. They are neither sliding nor tumbling windows. When a task or availability arrives, it is appended into the corresponding window. An availability is removed from the window when it expires. A task on the other hand can be removed under two conditions: i)it is assigned to a worker,ii) it expires. However, waiting until expiration of a task before allocation might cause misses, as all satisfying availabilities might expire meanwhile. Therefore, we also define a window size, in terms of minutes. For every window expiration, the tasks are processed against availabilities and nominees are identified. After this step, batched progressive offer and task allocation steps are used as they are. There are two corner cases about tasks. First, if a task has no nominees at the time of the window expiration, it stays in the window and participates in the following window expirations, until its own expiration. Second, if the task has nominees but all of them rejected the offer, it again remains in the window for new nominees to arrive. The same task is never offered to the same nominee more than once.
There are multiple constraints on the window size deci-sion. First of all, it should be shorter than the smallest time period of the set of all tasks and availabilities to guarantee processing. Second, the waiting time should not exceed reasonable response time of the application. An online shopping application that needs 2-hours delivery guarantee cannot define the window size as3hours. For applications that require instant reply, the window size can be set to0. In instant task allocation, when a task arrives, it is processed against the availabilities window to identify nominees. If there are not any, it is added to the tasks window and stays there until its expiration time. When an availability arrives, all tasks and availabilities present in the window are processed, since this availability might be completing a partial match. A partial match is possible when a worker has a satisfying availability for only one of the steps of the task. We leave the detailed discussion of partial match processing as future work. In our experimental evaluation, we study the feasibility and effectiveness of our allocation model with various window sizes, including instant allocation, i.e. window size equals to0.
5
E
XPERIMENTALE
VALUATIONIn this section, we present the detailed evaluation of our proposed 2-phase allocation model and the fairness-aware task allocation algorithm,F-Aware.
To easily determine the superiority of a solution over other solutions, we combine optimization goals into a single parametric objective functionOand define it as:
O=T AR×e−(ρ∗F) (13)
Since the goals are maximizing the TAR while minimiz-ing the unfairness, the objective function is proportional to
TAR. But the exponential part of it is inversely proportional with the global unfairness metric F. To enable the system to prioritize one component of the objective over the other, we introduce the parameterρ, where0≤ρ≤1.By setting ρto0, one can simplify this objective to task allocation ratio only. Higher values of it will increase the importance of the unfairness in the overall objective.
The evaluation includes four sets of experiments. In the first set, we compareF-Aware with 4 other competitor algorithms in terms of task allocation ratio(TAR),unfairness and value of theobjective function. Recall that the objective function, as defined in Eq. 13, is the combined metric of TARand unfairness. The na¨ıve approach of assigning tasks to workers is random selection among the candidates, re-ferred to asRandomin the performance graphs. The second approach is to select Least Allocated Worker First(LAF). The intuition behind this approach is trying to reserve room for further task allocations. Existing work of task allocation in spatial crowdsourcing mostly use Nearest Neighbor Priority strategy [21], [25] to capture the spatial-aspect of the prob-lem. [21] introduces allocation techniques based on location entropy, and [25] extends nearest worker priority technique with pro-active deployment of workers to geo-grids. We only prioritize the nearest worker since we do not make assumptions on distribution of tasks. This algorithm is re-ferred to asNearestin this section. Lastly, we use successive shortest paths algorithm which solves the minimum cost flow(MCF) problem [23]. This algorithm is optimal on Task Allocation Ratio, hence it is used to evaluateTARof all algo-rithms. The second set of experiments studies the efficiency of our batch incremental offer strategy, that is how different values ofandθ affect thek value, thus assignment ratio, and unfairness. The third set studies online task allocation, presenting task allocation ratio and unfairness as a function of window size. Finally, the last set is the sensitivity study that presents task allocation ratio and unfairness of different time period lengths as a function of coefficient of mean. As we will detail soon, length of the time period and coefficient of the mean are two variables we use to adapt real-world data to our setup.
We implemented all algorithms using Java 1.8. All exper-iments were executed on a Linux server with 2 Intel Xeon E5520 2.27GHz CPUs and 64GB of RAM.
Dataset. Experiments are performed using two real-world datasets. The first dataset contains the Foursquare check-ins from New York City for the month of May 2012 [34]6. This dataset contains around 50,000 check-ins from 987 different users. The second dataset is a taxi-trip dataset for Manhattan, for the same time period7. We used up to512,000randomly sampled rows from the taxi dataset. Half million tasks for a city, for one month, is a fair work-load, considering assignment could be done independently for each city. Each row of the check-in data contains a user id, time of the check-in, and the location of it. Each row in the taxi dataset contains the time and the location of the pick-up and the drop-off. It also contains the cost of the trip. To simulate crowdsourced delivery behavior, we use taxi trips as tasks and check-ins as spatio-temporal availabilities
0 100 200 300 400 500 600 Task Count(K) 100 101 102 103 104 105 106 107 108 109 Runtime LAF MCF Random Nearest F-Aware (a) Runtime
0 100 200 300 400 500 600
Task Count(K) 0.0 0.2 0.4 0.6 0.8 1.0 TAR LAF MCF Random Nearest F-Aware (b) TAR
0 100 200 300 400 500 600
Task Count(K) 0.00 0.05 0.10 0.15 0.20 0.25 0.30 0.35 0.40 0.45 Unfairness LAF MCF Random Nearest F-Aware (c) Unfairness
0 100 200 300 400 500 600
Task Count(K) 0.4 0.5 0.6 0.7 0.8 0.9
Objective Function (
[image:10.612.47.561.42.303.2]) MCF LAF Random F-Aware Nearest (d) Objective Fig. 4: Scalability
0 0.5 1 1.5 2 2.5 3 3.5 4 4.5 Capacity(K) 0.00 0.05 0.10 0.15 0.20 0.25 0.30 0.35 0.40 0.45 Unfairness LAF Random Nearest F-Aware (a) Unfairness
0 50 100 150 200 250 300
Capacity 0.0 0.1 0.2 0.3 0.4 0.5 0.6 Unfairness LAF MCF Random Nearest F-Aware
(b) Unfairness-small task set
0 0.5 1 1.5 2 2.5 3 3.5 4 4.5 Capacity(K) 0 10 20 30 40 50 60 70 80 Number Of Ass ignm ents(K ) LAF Random Nearest F-Aware
(c) # Of Completed Tasks
0 0.5 1 1.5 2 2.5 3 3.5 4 4.5 Capacity(K) 0.15 0.20 0.25 0.30 0.35 0.40 0.45 0.50 0.55
Objective Function (
) Nearest LAF Random F-Aware (d) Objective
Fig. 5: Effect of the Worker Capacity
of the workers. For both datasets, we converted all time points to time ranges by adding time periods. Given a point in time,p, a period of length∆T is created with beginning and end points[p, p+ (∆T)]. We treat pick-up location and time of a taxi trip as the task’s source location and source validity time. The same applies to drop-off location and time and tasks deliver location and validity. For each check-in, we use the location of it as the location of the availability and converted the time of it to a time period as described above. Radius of each availability is sampled from a Normal distribution with mean and standard deviation calculated using taxi trips. We study the effect of this conversion as part of our last experiment presented in this section, by varying the mean size of the time period. For all other experiments, the mean value for the time period is taken as 2 hours. Last, we used the cost of the trip as the reward of the task.
5.1 Scalability
In this set, we present two subsets of experiments. In the first subset, we observe the running time performance, task allocation ratio, and unfairness as a function of the number of tasks. The number of tasks is doubled for every data point ranging from4000tasks up to512,000. Capacities of the workers are assigned using a Normal distribution and the mean is set to the number of tasks over the number of workers. Standard deviation of the distribution is set to mean over 4 to make sure all capacities are at least 0. Using this tight capacity assignment for this particular experiment set, we ensure that the capacity is barely enough for allocating all the tasks. This gives a clear advantage to algorithms that can allocate tasks close to optimal. In the second subset, we observe the task allocation ratio and unfairness as a function of worker capacity.128,000 tasks are used, and capacities are doubled for every data point ranging from 32 to 4096. To observe the behavior of the MCFalgorithm, we also present unfairness as a function of
capacity using 8000 tasks (Figure 5b). In this experiment, capacities are ranging from4to256.
Figures 4, and 5 present our scalability related results. In all figures, thex-axis represents either the number of tasks to allocate, or the capacity of workers, andy-axis represents the performance metric. Different series represent different assignment algorithms. Figure 4a plots the running time as a function of the number of the tasks. We make two observations from the figure. First, and most importantly, F-Awareruns107
times faster than the Minimum Cost Flow MCF algorithm. For32,000 tasks, the running time of the MCF is1.89×108milliseconds whileF-Awarecompletes in
27 milliseconds. Because of the long evaluation time, we do not present MCF results for more than 32,000 tasks. Secondly, the running time of theF-Awarealgorithm is linear with the task count. Increasing from4000tasks to512,000 tasks, the running time increases from 4.6 milliseconds to 13,130 milliseconds. The difference between the running times of Random, LAF and Nearest assignment algorithms are negligible.
the number of allocated tasks. However,TARofF-Awareis still higher. For512,000tasks,F-Awarereaches to98.1%task allocation ratio, whileLAFreaches to95.3%.
We discuss the Figures 4c, 5a, 5b and 5c together as they are complementary. First three figures plot the unfairness as a function of task count, capacity and capacity respectively. The last one represents the number of assigned tasks, as a function of capacity. In Figure 5b, we use only8000tasks to includeMCFalgorithm. In the first Figure, (4c), we use up to 512,000tasks but excludeMCFafter32,000tasks, because of the impractically long running time. For the remaining two, we use 128,000 tasks, and capacity of the workers varies from32to4096.
At this point, it would be useful to recall, LAR of a worker is the ratio of revenue she made from completed task over total reward of the offers she has accepted. How-ever, since capacity limits the assignable task count, if a workerwiaccepts more offer than her capacitywic, we only
consider first wc
i offers when calculating LAR. Therefore,
when evaluating performance of an algorithm in terms of fairness, one must consider two cases when capacity limits assignments, and when there are more than enough room for assignments.
When worker capacities are enough to serve all tasks, we observe a significant difference between unfairness values. In Figure 5b, for small dataset, Random,Nearest, and MCF perform similar. In contrast, unfairness metric ofLAF0.8× of the same metric of those three. We observe F-Aware, performs best among all. Unfairness metricMCFalgorithm is 1.5× that of our F-Aware algorithm when capacity is 256. For the larger task set, the difference between LAF andF-Awarebecomes even more significant (figures 5a, 5c). When the capacity is set to1024unfairness value ofLAFis 0.41whileF-Awarehas only0.16unfairness. For same data pointNearest, andRandomhave0.30,0.27unfairness values respectively. We make two additional observations from this figure. First, up to256 capacity, unfairness values increase. This is because capacity of workers less than number of ac-ceptances. In this set of experiments each worker accepts215 offers in average. After this point number of accepted tasks used when calculating LAR. Using Figure 5c we observe all algorithms reach maximum number of allocated tasks at capacity 1024, which reflected as stabilized unfairness values in Figure 5a. Second, LAF performs poorer than Nearest and Random assignment approaches. Since it does not take user input into account, (i.e. accepting offers) when tasks are distributed evenly, workers who have accepted small number of offers haveLAR= 1, while workers with large number of acceptances have too lowLARvalues.
When capacity is set to a too low value, we cannot observe significant difference between unfairness values of MCF, LAF, and F-Aware. This is because all workers are fully allocated. On the other hand, in Figure 4c values of unfairness metric for Random, andNearest is around 3.6× that of F-Aware. The reason behind is system could serve less number of tasks (Figure 4b), when one of these two assignment algorithm is used.
Figures 4d and 5d present the performance in terms of our objective, Eq 13, as a function of task count and capacity respectively. In these experiments, theρparameter is set to 1, to observe the balanced outcome oftask allocation ratioand
fairness. In Figure 4d, we observe that the difference between the objective values of F-AwareandMCFare negligible. F-Awareperforms as good asMCF, in terms of our objective, with107times faster processing speed. Another observation
from the same figure is that, F-Aware performs4% better thanLAF, even with limited capacity. For128,000tasks, F-Aware has 0.86objective value while LAF has 0.82. When there are more than enough room for assignments, we observe that the gap between F-Aware and LAF becomes even more significant, as shown by Figure 5d. For a capacity value of 4096 the objective value of F-Aware is 0.5, while LAFcould reach only0.39. Objective values ofNearestand Randomare better thanLAF, because of the lower unfairness values, but still they are far from performing as good as F-Aware.
To summarize this experiment set, one can say that using MCFis impractical due to its long running time. In contrast, F-Aware runs 107 times faster. When only TAR is considered, LAF performs similar to F-Aware, but the other two approaches,Random andNearest, leave19% and 15%of all tasks unassigned, respectively. WhileLAFis the best competitor of F-Aware, in terms of TAR and runtime, its unfairness metric value is2.5×that ofF-Awareand its objective value is80%that of ourF-Awarealgorithm.
5.2 Effect of the Batch Size
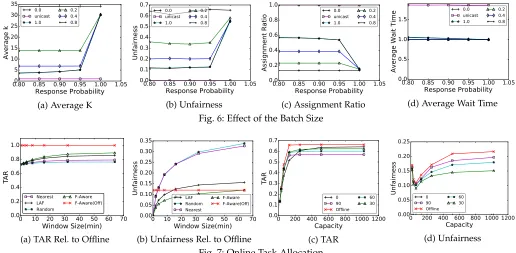
We observe averagek, unfairness, assignment ratio, and av-erage wait time as a function of the probability of response threshold. Figure 6 presents our batch size related results. In all figures x-axis represents the value of and y-axis represents a performance metric. Different series represent different assignment ratio thresholds, θ. For all series we use the F-Aware assignment algorithm. For this set of ex-periments capacity of workers is high enough to prevent a bottleneck.
Figure 6a plots the change in the value ofkas a function of. The series with circle marker is the unicast line, i.e.k is set to1. Recall that the value ofkis bounded from below by a function ofand bounded from above by a function of θ. We select the largest kinside this range. Higher values of and θ imply tighter bounds. Since θ = 0.0 means unlimited upper bound, practically it is the broadcasting line. We observe that as long as ≤ 0.95 the value of k is limited by the assignment ratio thresholdθ. Increasing θ from 0.2 to 0.4 decreases the average k value from 14 to 6. Since task completion is our primary goal, when lower bound is higher than the upper bound (possible in some cases based on the definition of Equation 12), we use the lower bound for deciding thekvalue. One can observe this behavior when ≥ 0.95, as all the average k values are closer to broadcasting.
0.80 0.85 0.90 0.95 1.00 1.05 Response Probability 0 5 10 15 20 25 30 35 Average k 0.0 unicast 1.0 0.2 0.4 0.8
(a) Average K
0.80 0.85 0.90 0.95 1.00 1.05 Response Probability 0.0 0.1 0.2 0.3 0.4 0.5 0.6 0.7 Unfairness 0.0 unicast 1.0 0.2 0.4 0.8 (b) Unfairness
0.80 0.85 0.90 0.95 1.00 1.05 Response Probability 0.0 0.2 0.4 0.6 0.8 1.0 Assignment Ratio 0.0 unicast 1.0 0.2 0.4 0.8
(c) Assignment Ratio
0.80 0.85 0.90 0.95 1.00 1.05
Response Probability 0.0
0.5 1.0 1.5
Average Wait Time
0.0 unicast 1.0 0.2 0.4 0.8
[image:12.612.45.561.42.295.2](d) Average Wait Time
Fig. 6: Effect of the Batch Size
0 10 20 30 40 50 60 70
Window Size(min) 0.0 0.2 0.4 0.6 0.8 1.0 TAR Nearest LAF Random F-Aware F-Aware(Off)
(a) TAR Rel. to Offline
0 10 20 30 40 50 60 70
Window Size(min) 0.00 0.05 0.10 0.15 0.20 0.25 0.30 0.35 Unfairness LAF Random Nearest F-Aware F-Aware(Off)
(b) Unfairness Rel. to Offline
0 200 400 600 800 1000 1200 Capacity 0.0 0.1 0.2 0.3 0.4 0.5 0.6 0.7 TAR 0 90 Offline 60 30 (c) TAR
0 200 400 600 800 1000 1200
Capacity 0.00 0.05 0.10 0.15 0.20 0.25 Unfairness 0 90 Offline 60 30 (d) Unfairness Fig. 7: Online Task Allocation
the set ofLARvalues increases, which leads to a decrease in the coefficient of variation metric. Second, and more importantly, when a worker accepts an offer, probability of her getting the job is higher with the smaller values ofk. In the extreme case, that is unicasting, acceptance implies assignment, hence unfairness = 0. We can also observe a similar behavior in Figure 6c. Assignment ratio of the unicasting equals to1. For the other series, we can see that assignment ratio is negatively correlated with the average k value. For broadcasting, it decreases up to 0.13. When the averagek is5.8, the assignment ratio is 0.38. Another important observation is theoretically θ = 1.0 should be the unicast line but it has0.6assignment ratio. The reason behind isis a stronger constraint thanθ. We do not observe same behavior lines other thanθ= 1.0, andθ= 0.8
Figure 6d plots the average wait time as a function of .y-axis shows the average number of rounds passed until there is at least onecandidate. Recall that the task is offered to nominees in batches until there is at least one response. Between each round, the system waits for a predefined period to let nominees decide. For some scenarios, e.g. on-demand transportation, customers expect almost instant reply. Higher number of rounds before acceptance leads to late notification to a customer. In case of broadcasting, since all nominees are notified at once, number of rounds for response is always 1. However, as we have just seen, broadcasting leads to low assignment ratio and high unfair-ness. At the other extreme, that is unicasting, the average wait time is 1.8× of broadcasting. Multicasting is better than both approaches. Multicasting the task to an average of 5.08(= 0.8, θ= 0.95) nominees leads to only1.01average rounds, while providing only0.13unfairness.
In summary, one can say that multicasting is better than broadcasting in terms ofassignment ratioandfairness. More-over, it beats unicasting whenaverage wait timeis considered, while being almost as fair.
5.3 Online Allocation
We observe the task allocation ratio and unfairness as a function of the window size and as a function of capacity. Figure 7 shows our online allocation related results. For Figures 7a and 7b, the x-axis represents the window size in terms of minutes. In addition to window size equals to 0, the x-axis also includes data points starting from 2 minutes, going up to 64, doubling at each step. Different series represent different task allocation algorithms. For Figures 7c and 7d, thex-axis represents worker capacities. The values are doubled for each data point, starting from 16, going up to512. For all figures, they-axis represents a performance metric. In this set, we used96,000tasks.
Figure 7a shows the task allocation ratio as a function of the window size. The red line with cross markers represents offline F-Aware algorithm. All the other series are drawn relative to this line, therefore it is the y = 1 line. We observe that for the instant task allocation, the difference between different series is negligible. This is because the number of nominees for each task is very small, and thus the decisions of the algorithms do not create any difference. On the other hand, when the window size is increased, we can see thatF-Aware, andLAFperforms better than the other two approaches and gets closer to the offline assignment. For the 64minutes window, F-Aware, and LAF allocates88%, and 85% of the tasks assignable by offline allocation, whereas Nearest, andRandomallocation approaches stay at79%and 76%, respectively.
0 1 2 3 4 5 6 7 8 Coefficient of Mean 0.0
0.1 0.2 0.3 0.4 0.5 0.6 0.7 0.8
TAR
1 2
4 8
(a) Task Allocation Ratio
0 1 2 3 4 5 6 7 8
Coefficient of Mean
0.00 0.05 0.10 0.15 0.20
Unfairness
1
2 48
[image:13.612.59.561.43.170.2](b) Unfairness Fig. 8: Sensitivity Experiment
0 5 10 15 20 25 30
Earnings
0 50 100 150 200 250 300 350 400 450
Number Of Workers
F-Aware LAF Nearest Random
(a) Earning Distribution
0 1 2 3 4 5 6 7 8
Coefficient of Mean
1.75 1.80 1.85 1.90 1.95 2.00
Dollar/Km
LAF Random
Nearest F-Aware
(b) Earnings of Workers Pre-sented as Dollar per Kilometer Fig. 9: Discussions
0.13, while onlineF-Awareincreases from0.04to0.11when window size increased to 64minutes from2minutes. The most important observation isF-Awareperforms best among all online algorithms. For the window size of 64 minutes onlineF-Awarehas0.11unfairness whileLAF,Nearest, and Randomhave 0.15,0.32,0.33respectively. We also observe the other three algorithms are even less fair than offline F-Aware, for windows larger than16minutes.
Figures 7c and 7d plot the task allocation ratio and unfairness as a function of worker capacity. Different series represent different window sizes, including offline and in-stant assignments. For all series,F-Awarealgorithm is used. We make two main observations. First, the task allocation ratio for smaller window sizes is higher compared to larger window sizes. The reason behind this is that, some of the availabilities satisfying tasks expire before making a decision. At first sight, one might think larger window sizes should produce closer results to the offline scenario, but this is not the case. In the offline scenario all the information is known in advance, and decisions are made before expira-tion. In contrast, with large windows the availabilities might expire before processing. Second, larger windows result in less fair allocation. As we mentioned earlier, smaller windows behave like batches with smaller k values. As batch-size experiments showed, when a task offered to less number of workers, fairness increases since sum of total accepted offers for each worker decreases.
5.4 Sensitivity Experiments
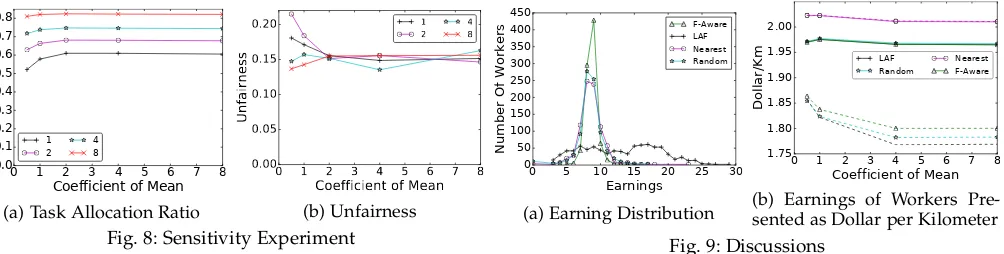
We observe the task allocation ratio and unfairness as a function of the coefficient of mean. Different series represent different∆T values. Recall that these are the two parame-ters involved when we used the taxi trips as the tasks, and the check-ins as spatio-temporal availabilities of workers. The radius added to a check-in is sampled from a Normal distribution with mean and standard deviation set to that of the taxi trips. For each data point on thex-axis, the mean of this distribution is multiplied with the respective number. For all experiments,y-axis represents a performance metric. Figure 8a plots the task allocation ratio as a function of the coefficient of radius. We observe that ∆T has a great effect on the task allocation ratio. When coefficient of radius is1and∆T = 1,57%of the tasks are allocated, while this number is82%when∆T = 8for the same coefficient. On the other hand, we cannot observe the same effect for larger radius values. Consider the∆T = 4line. The task allocation ratio increases by only0.1%when the coefficient is increased from1to4.
Figure 8b plots unfairness using the same setup from Figure 8a. We observe that the difference between unfairness values is negligible. The peaks are a results of randomness present in task acceptance. Therefore, we conclude that unfairness is not effected from the adaption of real-world data to our problem setup.
5.5 Discussions
We present two additional experiments that provide in-sights of our 2-phase assignment model and the F-Aware algorithm. Figure 9a shows the distribution of workers as a function of theaverage earning per acceptance. We observe that800 workers have average values between 2$and 4$ whenF-Awarealgorithm is used. Although the most dense areas similar for other approaches as well, we can see that the standard deviation of them is much higher, which is an indicator of unfairness.
Unlike traditional crowdsourcing, in spatial crowdsourc-ing workers have to physically travel to the source and destination of the task. Therefore, dollar earned per traveled kilometer is a good indicator of the what is the reward of a worker in return of her labor. In this point we would like to remind that, batched progressive offer strategy multicasts the offer to the workers who are most likely to accept it, implicitly workers who are closer to the task.
Figure 9b presents dollar earned per kilometer as a function of the coefficient of mean values as in the sensitivity experiments. Solid lines represent different assignment algo-rithms when the batched progressive offer strategy is used, while dashed lines show the same but when the offers are broadcasted. Recall that the nearest worker assignment is beneficial for capturing the spatial aspect of the assignment problem. In case of broadcasting, represented with dashed lines, we observe theNearestbetter than other approaches. Using this approach, workers could make more than 20 cents per kilometer more compared to other approaches. On the other hand, we observe the other three approaches benefit significantly from multicasting. The difference be-tweenNearestandF-Awaredecreases from22cents to5cents when the system prefers to multicast the offers instead of broadcast. Therefore, we could state thatF-Awareapproach captures the spatial aspect of the problem, with the help of multicasting, as well as allocating each task to Nearest worker.
• F-Awareis efficient: It runs around 107 times faster than theMCF algorithm and allocates98.1%of the assignable tasks.
• F-Awareis fair: Unfairness metric of theLAFis2.5× that of F-Aware and, it maintains its fairness with increasing capacity, and increasing task count. • Batched progressive offering is useful to limit the
assignment ratio, while not sacrificing the wait time. Moreover, it helps to capture the spatial aspect of the problem by helping to provide competitive dollar per kilometer ratio withNearestworker approach.
6
R
ELATEDW
ORKWe discuss the related work in the areas of crowdsourcing, including spatial crowdsourcing and fairness.
Crowdsourcing.A wide spectrum of crowdsourcing appli-cations are surveyed in [12]. Crowdsourcing is proposed also for technical tasks such as relational query process-ing [18], [28], [26]. In [20], three crucial aspects of crowd-sourcing, namely task design, marketplace dynamics, and worker behavior are analyzed. However, none of these methods from the literature have considered fairness among workers. To the best of our knowledge, this is the first work that applies the concept and findings of fairness from social psychology research to crowdsourcing applications.
Spatial Crowdsourcing. Spatial crowdsourcing requires workers to physically travel to task locations. Earlier work [2], [21], [11] extended crowdsourcing to the physical world, with a variety of applications such as answering queries [18], [28] and serving micro-tasks (such as taking a photo of a monument) [10], [36], [9]. Numerous work has addressed the maximum task assignment problem [21], [11], [31] and its extensions that integrate the reliability of workers [22], [33]. In [10], maximizing the reliability and spatial diversity are considered together. Although these works study task allocation in spatial crowdsourcing, they mostly focus on offline scenarios. In [19], online allocation is performed when only the workers are dynamic. In [36], micro tasks are allocated when both tasks and workers can appear anywhere, anytime. Different from our work, [32] learns the workers’ acceptance probability in dynamic tasks static workers setup. Recall, we assume acceptance depends on the hardness level of the tasks and independent from previous acceptances. Unlike these works, in crowdsourced delivery, redundant task allocation is not possible. Similar to our problem, in the context of crowdsensing, there is a trade off among quality of information (QoI), budget and time constraints, which requires multi-objective aware task allocation algorithms as well. A recent work solves this problem with a particle swarm optimization technique that maximizes the aggregated QoI/budget ratio. A delegation mechanism is used, in case the workers cannot finish their allocated task, they may recommend a set of workers from their social network to complete it [15]. This technique serves the same purpose with our 2-phase allocation model. Fairness is not in the scope of any of the aforementioned work.
Fairness in Crowdsourcing. In various application do-mains, such as networking [27], staff scheduling [14], and
resource allocation [4], fairness is considered to be one of the most important constraints. In [8], fairness among customers, but not workers, is considered. Its goal is making sure that the system is fair to the customer when it is not possible to serve all tasks. In [6] unfairness is defined as discrimination against individuals, while in [13], the au-thors differentiate between various perspectives on fairness and ethics in crowdsourcing. They consider distributional fairness as a subjective measure and discuss ethical implica-tions. In [35], in addition to the cost minimization objective, fair allocation of tasks to heterogeneous workers (workers with different capacities and costs to execute the task) is studied. The central idea of fairness in [35] is to maximize the minimum utility of all bidders (workers). Utility is defined as the number of allocations. They also assume that the set of all tasks is known in advance and workers are predefined. Unlike previous works in spatial crowdsourc-ing, [25] stresses both the cost incurred by the movement of the worker and the fairness of the assignment among the workers. A sequence of sets of spatial tasks are assigned to crowdsourced workers as they arrive. The one-to-one assignment of tasks to workers is done in mini-batches. In their setup, workers are not assigned to multiple tasks. On the other hand, to provide redundant task allocation they copy the task, and allocate one worker for each copy. Besides utilizing a redundant task allocation strategy, the fairness definition of this work is different from for our scenario. Yet, in the experimental evaluation we included the least allocated worker first,LAF, which is inspired from this work. We showed that, according to the state-of-the-art fairness definition,LAFis not fair unless all workers are homogeneous.
7
C
ONCLUSIONIn this paper, we created a strategy on allocation ofdelivery tasks. In this strategy, we use a combined objective of maxi-mum task allocation and fair distribution of tasks to work-ers. In our 2-phase allocation model, for each task a set of nominees are identified using availabilities of workers. The task is offered to nominees using ourbatched-progressive offer strategy. Once the candidates for each task are identified, we showed that the problem can be reduced to Minimum Cost Flow(MCF) problem if fairness is not considered. To cope with drawbacks of MCF-based solutions in terms of running time and lack of fairness handling, we introduce ourF-Aware algorithm. We then adapt our model to online task allocation and mini-batch task allocation scenarios. Our evaluation showed thatF-Awareruns around107×faster than the TAR-optimal solution and assigns96.9%of the tasks that can be assigned by it. Moreover, F-Aware assigns18% more tasks than random assignment approach and is 2.5× more fair than the least allocated worker first assignment strategy.