Remote sensing of mesospheric dust layers using
active modulation of PMWE by high-power
radiowaves
A. Mahmoudian,1 , A. Mohebalhojeh,1 , M. Farahani,1 , W. A. Scales,2 , M.
Kosch,3,4,5
1Institute of Geophysics, University of
Tehran, Tehran, Iran
2The Bradley Department of Electrical
and Computer Engineering,Virginia Tech,
USA
3South African National Space Agency,
Hermanus 7200, South Africa
4Physics dept., Lancaster University,
Lancaster LA1 4YB, UK
5Physics dept., University of Western
Abstract.
This paper presents the first study of the modulation of polar mesospheric
winter echoes (PMWE) by artificial radiowave heating using computational
modeling and experimental observation in different radar frequency bands.
The temporal behavior of PMWE response to HF pump heating can be
em-ployed to diagnose the charged dust layer associated with Mesospheric Smoke
Paricles (MSP). Specifically, the rise and fall time of radar echo strength as
well as relaxation and recovery time after heater turn-on and off are distinct
parameters that are a function of radar frequency. The variation of PMWE
strength with PMWE source region parameters such as electron-neutral
col-lision frequency, photodetachment current, electron temperature
enhance-ment ratio, dust density and radius is considered. The comparison of recent
PMWE measurements at 56 MHz and 224 MHz with computational results
is discussed and dust parameters in the PMWE generation regime are
es-timated. Predictions for HF PMWE modification and its connection to the
dust charging process by free electrons is investigated. The possibility for
re-mote sensing of dust and plasma parameters in artificially modified PMWE
regions using simultaneous measurements in multiple frequency bands are
1. Introduction
So-called polar mesospheric winter echoes (PMWE) are radar echoes observed during
the polar winter at altitudes around 50–80 km and are much weaker than their PMSE
(Polar Mesospheric Summer Echoes, e.g. Rapp and Lubken, 2004) counterpart and also
much less studied. Breaking of gravity waves and the associated turbulence are proposed
as the major source for PMWE echoes. The action of neutral turbulence alone does not
appear to give a good explanation for PMWE. The close similarity in spectral widths inside
and outside the PMWE source region lends evidence to this assertion (Kirkwood et al.,
2006a, 2006b; Zeller et al., 2006). It should be noted that so-called PMSE are due to Bragg
scatter from electron irregularities which result from charging of free electrons and ions
onto subvisible ice particles (e.g. Inhester et al., 1994). While some theories can explain
the PMWE characteristics only by the turbulence, there are rocket and radar observations
that show the presence of nanometer scale particles throughout PMWE regions (Baumann
et al., 2013). Ablation and evaporation of meteors in the atmosphere between 60 km
and 90 km are the main source of Mesospheric Smoke Paricles (MSP). These particles
may influence electron density fluctuations through charging and as a result radar echoes
(Lubken et al., 2006). MSPs therefore have been proposed to exist in the PMWE source
region and lead to electron irregularities that produce the radar echoes (Havnes and
Kassa, 2009). Most previous PMWE observations were during enhanced electron density
conditions. Charging of MSP by free electrons (Friedrich et al., 2012) and ion chemical
reactions (Kero et al., 2008) are the two main sources of electron reduction in PMWE
the austral hemisphere observed by the PANSY (Program of the Antarctic Syowa MST/IS)
radar in 2013 (Nishiyama et al., 2015). According to these observations, ionization during
energetic electron precipitation was the possible cause of PMWE and the strongest PMWE
was reported in May. A review of continuous observations of PMWE at northern latitudes
using the ALWIN VHF radar located at the Norwegian island Andoya (69.30N, 16.04E)
(2004–2008) and the Middle Atmosphere Alomar Radar System (MAARSY) (since 2011)
has been reported by Latteck and Strelnikova (2015). Based on these observations, the
PMWE occurrence depends on the time of the day (or solar zenith angle) which indicates
the strong dependence on electron density. It has been shown that September is the
beginning of PMWE appearance (Latteck and Strelnikova, 2015). It should be noted that
MSP responsible for PMWE and ice particles associated with PMSE are referred to as
dust throughout this paper for simplicity of notation.
The impact of heating the PMSE source region with high power radiowaves has been
studied extensively using computational models as well as experimentally at EISCAT
with 7.9 MHz, 56 MHz, 224 MHz, and 930 MHz after the first observations of Chilson
(2000) showed suppression of PMSE after heater turn-on. Pumping the plasma with
radio-waves enhances the electron temperature which affects diffusion and charging of
any ice particle present. The temporary enhancement of PMSE after heater turn-off,
described as the PMSE overshoot, was observed in experiments by Havnes et al. (2003)
and Havnes (2004). The first theoretical model was developed by Havnes (2004) to explain
the overshoot effect after heater turn-off for VHF radar data. Enhancement of HF PMSE
after heater turn-on was predicted by Chen and Scales (2005). Mahmoudian et al. (2011)
parameters on PMSE turn-on overshoot. The dust parameters (density and radius) for
turn-on overshoot at 56 MHz and 7.9 MHz were predicted. The first modulation of
high-frequency (HF, 7.9 MHz) PMSE at EISCAT was observed by Senior et al. (2014). This
behavior was interpreted as a result of dominant dust charging over plasma diffusion
which is in line with the model predictions. The ice particle radii and concentration were
estimated using the comparision of HF and VHF PMSE with the computational model
(Senior et al., 2014). Havnes et al. (2015) also reported the comparison of observations
of modulated PMSE at 224 MHz and 56 MHz with model predictions. Although there
was in alignment with model predictions, it was suggested that the discrepancies between
the observations and model were due to limitations in physical processes incorporated
in the charging model. It should be noted that Biebricher et al. (2012) developed a
computational model that is in line with these experimental observations as well.
The first active modulation of PMWE observed by the 224 MHz radar was conducted
by Kavanagh et al., (2006). A 10 s heating cycle was used during this experiment and a
suppression of PMWE by a factor of 93% was observed. This experiment was repeated
by Belova et al., (2008) with a 20s on and 160 s off heating cycle. A 50% reduction of
signal strength during heating turn-on and a turn off overshoot was reported. La Hoz and
Havnes (2008) reported a similar observation at 56 MHz with 70 percent reduction of the
radar signal during heating. Havnes et al. (2011) repeated the experiment which shows
a small recovery of signal intensity during HF-pump on period and an enhancement of
∼15% after heater turn-off were observed. Both effects are attributed to charging of free
electrons onto the dust particles as a result of enhanced background electron temperature
(224 MHz) was reported by Kero et al., (2008). The electron temperature was estimated
to be around 5 times the neutral temperature during heater turn-on. The comparison
between the electron density variation during heater on and off period using Sodankyla Ion
chemistry model (SIC) and the observations has shown the signature of negative charged
particles (Kero et al., 2008). Therefore, active modulation of PMWE mainly depends on
the presence of MSPs in the vicinity of PMWE source region (50-80 km) which is due to
the modified charging process of free electrons on to MSP through electron temperature
enhancement.
The only study on modeling of PMWE heating experiments was done by Havnes and
Kassa., (2009). The finite diffusion timescale was overlooked by treating electrons and
ions using the Boltzmann approximation. It should be noted that the Havnes model
was limited to high radar frequencies, small dust sizes and low dust densities because of
incorporating the Boltzmann approximation and neglecting finite diffusion time effects.
The computational model developed by Chen and Scales (2005) and Mahmoudian et al.
(2011) is able to simulate the time evolution of HF modulated PMSE in all radar
fre-quency bands. This model is incorporated in this paper. The objective of this paper is
to consider the temporal variation of PMWE during heating on and off cycles to obtain
diagnostic information about the source region. Radar frequencies used in this paper are
based on the available facilities at EISCAT and HAARP (The High Frequency Active
Auroral Research Program). The importance of charging and diffusion timescales in the
PMWE source region is first discussed. Key differences in the PMWE and PMSE
pa-rameter regimes are emphasized. According to recent in-situ measurements using rocket
process of dust particles in space which are not consistent with the standard charging
the-ory. Therefore, a modified charging model including photoemission current and positive
dust particles is adopted in this work. A comparison of the data collected during VHF
PMWE modulation experiments using 56 MHz and 224 MHz with computational results
is presented. The possible diagnostic information for charged dust and background plasma
parameters is discussed. Predictions on the temporal evolution of HF PMWE modulation
and its implications on characterizing the dust charging process are considered in section
4. Finally, a summary and conclusion is provided.
2. Modeling
2.1. Computational model
The computational model previously used to study the active modification of PMSE is
adopted to study the PMWE heating. The model used in this study is a hybrid model
including fluid plasma and particle in cell (PIC) dust (Scales, 2004; Chen and Scales,
2005; Mahmoudian et al., 2011). A continuous charging model based on the
Orbital-Motion-Limited (OML) approach has been used for the time varying charge on the dust
particles. Unlike the previous models developed by Havnes and Kassa (2009), the model
presented here enables the study of the evolution of electron irregularity amplitude at a
range of relevant frequency, plasma and dust parameters. Variation of the ion density
(the electron density ne is determined by quasi-neutrality) is described by the continuity
equation:
∂ni ∂t +
∂
∂x(nivi) = Pi+Li+ dni
where Li denotes the loss due to dissociative recombination and Pi denotes the ion
pro-duction due to photoionization and energetic particle precipitation. The last term in Eq.
(1) represents the ion reduction due to charging onto the dust particles. The
recombina-tion rate is modeled usingLi=γneni with a recombination rate coefficient γ. Neglecting
inertial effects in the momentum equation, the ion velocity can be written in this form,
vi= 1 νin
qi mi
E− KTi
mi ∂
∂x(log(ni))
!
, (2)
where qi, mi,Ti and νin are the ion charge, mass, temperature and ion-neutral collision
frequency, respectively. The electrostatic field (E) is determined using a current closure
condition in ionospheric plasma and to a good approximation is (Mahmoudian et a., 2011)
E ≈ −KTe
e ∂
∂x(log(ne)) (3)
The winter polar mesopause temperature for both ions and electrons is taken to beTe =
Ti = 250 K. The ion-neutral collision frequency is of order 5×10⁵ s−1. The electron-neutral
collision frequency temperature dependence is assumed to beνen ∝Te and recombination
rate dependence on temperature is taken to beγ ∝T−1/2
e . The electron density is assumed
to be 108 m−3. Recent rocket measurement has detected meteoric smoke particles in the
D-region (altitude range 65-75 km) with 1 nm< rd< 5 nm andnd=109 m−3 (Baumann
et al., 2013). Larger MSPs 5 nm < rd < 15 nm with nd =108 m−3 were also observed by
Baumann et al., (2013). Hunten et al., (1980) predicted large MSP densities below 1 nm.
Although due to limitations on the most of rocket experiment dust particles smaller than 1
revealed the tiny MSP with radii of less than 1 nm (e.g., Strelnikova et al., 2007; Fentzke
et al., 2009; Robertson et al., 2014). Due to the limitations of the model presented for
dust particles smaller than 1 nm and especially at lower radar frequencies, a minimum
dust radius of 1 nm will be used throughout this work as part of the model constraints.
Although considering dust radius distribution from 0.5 nm to 1.5 nm is expected to not
change the results much. Collision frequencies are higher in the PMWE region by a factor
of 5 to 10 in comparision with the PMSE region (Schmitter, 2011).
The charging model used in this study has been modified with respect to the model
used in the previous study by including the photodetachment current (Mahmoudian et al.,
2011). The time variation of charge on dust particles based on continuous
Orbital-Motion-Limited OML approach (Bernstein and Rabinowitz, 1959) can be written as follows:
dQd
dt =Ie+Ii+IP (4)
where Ie, Ii, and IP are the electron and ion current on each dust particle, and
photo-detachment current, respectively. The currents on to the negatively charged dust particles
are given by:
IeOML,Zd<0 =√8πrd2qenevteexp(−qeφd/KTe) (5)
IiOML,Z
d<0 =
√
8πrd2qinivti(1−qiφd/KTi) (6)
IeOML,Z
d>0 =
√
8πr2dqenevte(1−qeφd/KTi), (7)
IiOML,Z
d>0 =
√
8πrd2qinivtiexp(−qiφd/KTe). (8)
Here, rd is the dust radius, ne(i) electron (ion) density, Te(i) electron (ion) temperature,
K Boltzmann constant, qe(i) electron (ion) charge, Zd dust charge, vte(i) electron (ion)
thermal velocity and φd dust floating potential. Assuming negative charged dust,
photo-detachment current can be approximated by (Rosenberg, 1996)
IP,Zd<0 =−πr
2
dα, (9)
For positive grains, it can be shown that an approximation is
IP,Zd>0 =−πr
2
dαexp(qeφd/KTp), (10)
where rd is the dust radius. In Eq.(9) and (10), the parameter α is α = qeJpQabYp
where qe, Jp, Qab, Yp, and Tp are the electron charge, photon flux, photon absorption
efficiency, photoelectron yield, and average photoelectron temperature. Previous study
has estimated solar photon fluxJp of the order of ∼1.5×10⁵ photon cm−2 s−1 forhν ∼4-5
eV and the absorption efficiencyQab ∼1 (e.g. Brasseur and Simon, 1981). Photoelectron
yield Yp can also be estimated using Yp =C(hν−W)2, with C = 0.01/(eV)2 (Rapp and
Lubken, 1999). Qab is assumed to be∼1 for 2πrd/λ >1, whereλ is the wavelength of the
photo-detachment current is important for sufficiently small radii (1 nm) and metallic
compounds (e.g. Fe2O3 , SiO). The average photoelectron temperature Tp is assumed to
be ∼400Te. The previous studies have shown that MSP present in the mesosphere may
be positively charged due to photoemission by solar UV radiation (Rosenberg and Shukla,
2002). Rosenberg et al., (1996) provided an estimation of photo-emission current for UV
intensity of 8-9 eV photon.
2.2. Physical Time-scales
The temporal behavior of the PMWE radar signal after heater turn-on depends on two
physical processes. The diffusion process tends to suppress the electron density fluctuation
amplitude. On the other hand, the charging process of free electrons onto the dust particles
tends to enhance the density fluctuation amplitude. Depending on which process occurs
in a shorter timescale, the corresponding radar echoes may increase or decrease after the
heater turn-on. The timescale for electron attachment onto the dust at the initial time
after turn-on of the radio wave is approximated by:
τchg ≈
e Ie
= √ 1
8πne0vter2d(1−qeφd/KTe)
(11)
where vte, ne0, and φd are electron thermal velocity, electron density, and dust floating
potential (Mahmoudian et al., 2011). Te denotes electron temperature and rd is the dust
radius. As can be seen, electron charging time scale depends on Te and is expected
to be reduced as the Te/Ti increases during heating. The diffusion timescale can be
τdiff ≈νin(
λirreg
2πvti
)2 1
(1 + Te
Ti(1 +
zd0nd0
ne0 ))
(12)
where νin is the ion-neutral collision frequency, λirreg is the irregularity wavelength and
vthi is ion thermal velocity. zd0, nd0, and ne0 are dust charge, dust density, and
elec-tron density. According to the Bragg scattering condition λ = 2λirreg where λ is the
radar wavelength. The diffusion timescale is a function of scale-size of electron density
fluctuations. Therefore, for larger irregularity wavelengths (or lower radar frequencies),
the charging timescale may be smaller than the diffusion timescale. The electron density
fluctuation amplitude and radar backscattered signal in the HF band are expected to be
enhanced after the heater turn-on. The diffusion timescale for typical winter mesospheric
parameters (section 2.1) is of the order of∼200 sec,∼4 sec, and∼0.2 sec for frequencies
8 MHz, 56 MHz, and 224 MHz, respectively.
According to the computational results, including the photo-detachment current
re-sults in a lower charge state on the dust particles and, in general, extends the charging
timescale. A large portion of small particles may remain neutral by including
photo-detachment current compared to much larger dust particles (Havnes and Kassa, 2009).
Including photo-detachment current depending on the parameters significantly impacts
the charge state of small MSP. As a result, photo-detachment current leads to a weaker
PMWE and suppresses the modulation of PMWE by high power radiowaves. The
photo-detachment timescale can be described as 1/(πr2
dα). Therefore, increasing the value of
α reduces the photo-emission timescale which can dominate the charging and diffusion
process. Including photo-detachment current may result in positively charged dust
positive dust particles can cause substantial change in the electron irregularity amplitude
(radar echoes) and will be discussed in the following paragraph.
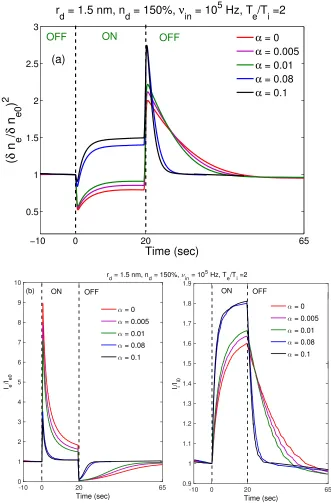
As an example Figure 1 shows the effect of photo-detachment current on the charged
dust particles associated with radar frequency 224 MHz. Dust radius rd is assumed to be
1.5 nm, dust density nd/ne0 150%, Te/Ti = 2 and νin = 105 Hz. The photo-detachment
coeffientαis varied from 0 to 1 where zero denotes no photo-detachment. Figure 1b shows
the variation of electron and ion currents during HF pump heating at 224 MHz. As can be
seen in Figure 1b, increasing the photo-detachment coefficient results in higher density of
neutral particles as it reduces the electron current onto the dust particles. Small portion
of dust particles (a few percent) will be charged positively in the case of high values of
α. This is predicted in the previous study by Knappmiller et al., (2011) that showed
less than 9 percent of MSP with rd = 1 nm will have a positive charge in the presence
of photo-detachment current. As α increases, the number of neutral and positive dust
particles increases. As shown in Figure 1a, increase of positive and neutral dust particles
is equivalent to the case of low dust density. The presence of positive particles and high
neutral density results in a reduced charging timescale (due to high value ofne/nd) and a
fast recovery of VHF PMWE during heater on period is expected (as shown in Figure 1
for α= 0.1 and 0.08 ). The large enhancement of turn-off overshoot for high values of α,
is also due to enhanced ion discharging current. Therefore, including photo-detachment
process especially for small dust particles has a significant effect on the temporal evolution
It should be noted that the squared electron density fluctuation amplitude (δne/δne0)2is
related to backscattered radar signal. The following expression represents the relationship
between the irregularities and the radar reflectivity (Ryrvik and Smith, 1984):
σ(k) = nπ 8k
2f 4
pe
4f4
Sne(k)
n2
e
(13)
where k = 2π/λand f are the wave number and frequency of the radio wave in Hz, λ is
the wavelength,σ(k) denotes the radar scattering cross-section per unit volume,fpe is the
electron plasma frequency, n is the exponent of the electron power spectral density, and
Sne(k) is the 1-D power spectrum of the electron irregularities. Chen and Scales (2005)
have shown that Eq. (13) can be simplified to σ(k) ∼ δn2
e for the sinusoidal density
perturbations considered in this study.
3. Experimental Observations
3.1. Case study I (56 MHz)
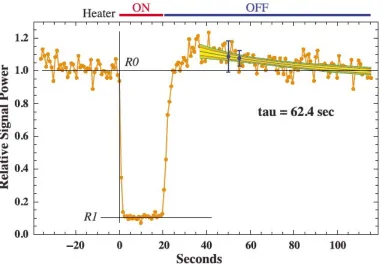
Recent PMWE heating observations by Havnes et al., (2011) using MORRO radar (56
MHz) imply the presence of dust particles in the source region. Figure 2 shows the PMWE
under artificial electron heating using 56 MHz radar reported by Havnes et al., (2011). A
heating cycle of 20 s on and 100 s off is used. The observations show a relaxation time
of about 60-70 s. Photo-detachment which plays an important role in the charge state of
small MSPs, has been proposed as the main candidate for the observed relaxation rates
(Havnes et al., 2011). Ion attachment to negative dust particles and discharging were
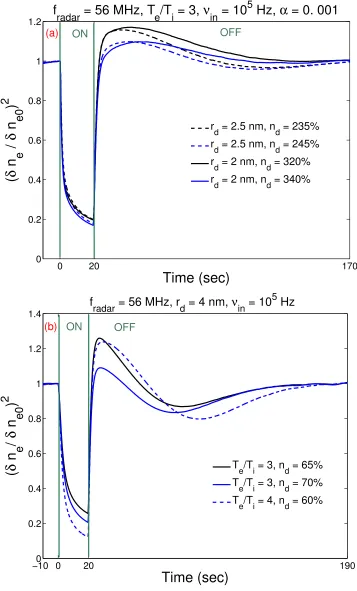
The main goal of simulations shown in Figure 3a is to study the dusty plasma (including
small MSP) parameters associated with observations shown in Figure 2 by including small
dust particles in the model as well as photo-detachment current. The reason for choosing
such a small particle size is to study the relaxation time after the heater turn-off and
compare that with the experimental data shown in Figure 2. It should be noted that
Te/Ti was estimated to be around 3 during this experiment. The same ratio forTe/Ti has
been considered in the simulations. As can be seen in Figure 3a, the dashed line shows the
simulation results for rd =2.5 nm and solid lines denotes the results for rd =2 nm. The
photo-detachment coefficientα is assumed to be 0.001 in all cases. Higher dust densities
are considered for smaller dust radius to get the best agreement with the experimental
data. As can be seen in Figure 3a, all cases show a reduction of radar signal by about 80%
during heating which are consistent with the observations shown in Figure 2. A sharp
increase of signal amplitude right after the turn-off to its value before the heater turn-on
is predicted which is of the order of 3 sec. This is in agreement with the experimental
data which shows the increase of radar echo strength within 5 sec after the heater turn-off.
The maximum amplitude of turn off overshoot of the order of 1.2 is predicted for rd =
2 nm, nd =320 % and rd = 2.5 nm, nd =235 %. The main difference between the cases
withrd =2 nm and 2.5 nm is the behavior of radar signal during heater turn-off and after
the maximum amplitude is reached. According to Figure 3a, dust radius 2.5 nm shows a
faster decay after the heater turn-off to the initial amplitude. The relaxation time after
the heater turn-off is about 65 s for dust radius 2.5 nm which is in reasonable agreement
with the experimental observations. The relaxation time estimated forrd =2 nm is about
for the observed relaxation time. Considering the computational results presented in
Figure 3a, combination of photo-detachment current and small dust radius produce the
best agreement with the observations. This contradicts the conclusion of Havnes et al.
(2011) who overlooked the role of small dust particles on such a long relaxation time. It
should be noted forνin larger than 105 Hz, a small turn-on overshoot is observed (within
5 s of heater turn-on) in the numerical simulations. The presence of the turn-on overshoot
at 56 MHz is possible and may not be observed due to high absorption rate at 8 MHz or
low time resolution of the radar.
Figure 3b shows the calculated behavior of PMWE at 56 MHz for larger dust radii
(4 nm). The electron temperature enhancement ratio is assumed to be 3 and 4 to be
consistent with the experimental observations by Havnes et al., (2011) which predicted
Te/Ti ∼ 3 for the altitude range 60 to 62 km. Three sets of parameters with rd =4 nm
are used to determine the dust parameters associated with Figure 2. The main difference
between the observations and computational model is the fall time or the time for the
minimum amplitude of 0.2 after the heater turn-on to be reached. The observation shows
a fall time less than 4 s, but Figure 3b represents a slow decay of the order of 10-15 s.
This is mainly due to small particle sizes used in the simulation. The sharp decrease in
the experimental data could be a result of enhanced D-region absorption. The minimum
amplitude matches the observations well. The dashed line (Te/Ti =4, nd =60%) and solid
black line (Te/Ti =3, nd =65%) show the turn-off overshoot amplitude of 1.2 which is
consistent with observations (Figure 2). The main difference between Figures 3a and 3b
is the behavior of radar signal after the heater turn-off. As can be seen in Figure 3b, the
heater turn-on. Therefore, increasing the dust radius to 4 nm can not produce similar
results to the observations after the heater turn-off.
Three main parameters have been considered to compare the comutational results with
the observations. The mimimum amplitude of radar echoes at 56 MHz during heating, the
time that the maximum turn-off overshoot is reached, and decay of radar echoes to their
initial value during heater turn-off (relaxation time) are the main characteristics of radar
signal considered to compare the model and the observations. As discussed above and a
close comparision of Figures 3a and 3b with the observations illustrated in Figure 2 shows
that smaller dust particles (∼ 2 nm) produce the best agreement with the experimental
data.
3.2. Case study II (224 MHz)
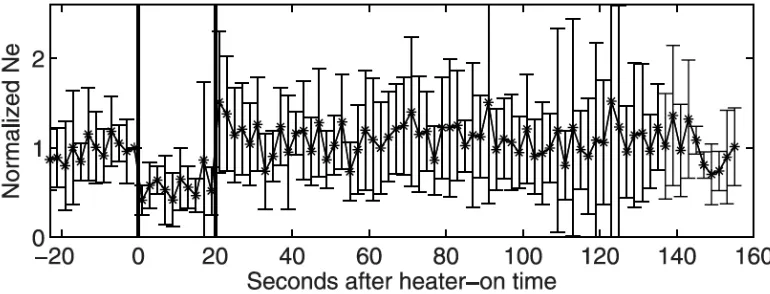
Belova et al., (2008) presented the overshoot effect during active modulation of PMWE
detected by VHF radar (224 MHz). A sharp decrease in power within 2 s after X-mode
turn-on and a sharp increase after turn-off were observed during PMWE modulation. As
can be seen in Figure 4, the data recorded during this experiment show a 50 % decrease in
echo strength when the heater was turned-on. The heater was on for 20 s and off for 160
s. No recovery was observed during heating that was attributed to the existence of dust
particles with radii larger than 10 nm (Belova et al., 2008). The echo strength increases
about 50% beyond the undisturbed level within 2 s after heater turn-off. The relaxation
time of echo power to the undisturbed level is about 20 s.
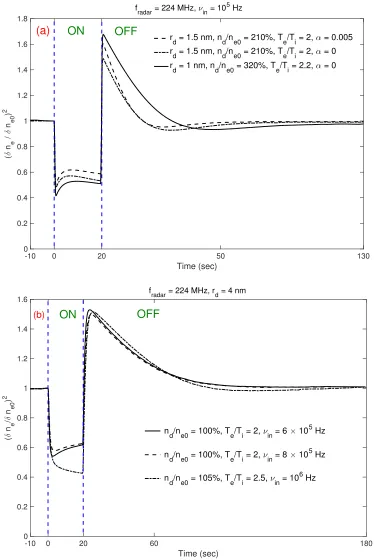
The computational model described in the section 2 is used with different parameters
set to obtain the best agreement with the observations. Dust radius of 1 nm, nd = 320
rd = 1 nm shows good agreement with the experimental data during the heater turn-off
(Figure 4), but it shows an overestimate of the order of 0.2 for the turn-off overshoot. The
dashed and dotted lines represent the temporal evolution of PMWE with including the
photodetachment current for the same parameter sets. As can be seen in Figure 5a
includ-ing photodetachment current with α =0.005 in Eq. (9) and (10), shifts the curve about
0.1 during heater on and off period which matches the experimenal observations shown in
Figure 4 well. This effect could be due to the increase of neutral density and enhancement
ofνin which directly increase the diffusion time-scale. Therefore, less suppression of radar
signal strength is expected during HF pump heating with including photo-detachment
current. It is note-worthy that including photodetachment current does not change the
recovery time after the initial suppression during heater turn-on. The turn-off overshoot
appears in about 1 s after the heater turn-off and decay time is of the order of 20 s which
are consistent with the observations.
The variation of plasma-neutral collision frequency and its effects on the time evolution
of PMWE at 224 MHz is shown in Figure 5b. In-situ measurements in the altitude
range 70 km to 80 km in the mesosphere have detected meteoric smoke particles (MSP)
with densities around 108 m−3 and radii about 5 nm (Baumann et al., 2013). Dust
radius is assumed to be 4 nm in the simulation. νin = 6 ×10⁵ Hz, 8 ×10⁵ Hz, and
106 Hz are considered. Other parameters including dust density and Te/Ti are varied
accordingly to match the experimental observations. Smaller collision frequencies show
the best agreement with the data presented in Figure 4. Both solid (nd/ne0 =100%,
Te/Ti =2, νin =6 ×10⁵ Hz) and dashed (nd/ne0 =100%, Te/Ti =2, νin =8 ×10⁵ Hz)
after the heater turn-off. A slow recovery is observed for both collision frequencies which
is in agreement with the data shown in Figure 4. Increasing the νin to 106 Hz enhances
the suppression about 0.2 during heating, but the turn-off overshoot stays about the
same. The dust density is increased about 5% and Te/Ti =2.5 is considered. Therefore,
measurement of Te/Ti during heating using an ISR (incoherent scatter radar) can be
used as an input to the model which may lead to an good estimation of neutral density.
According to Figure 5b, no recovery during heating on is observed for dust particles of 4
nm. The recovery time for dust radii 1 nm and 1.5 nm shown in Figure 5a is negligible and
matches the experimental observations. Therefore, the computational results contradict
the conclusion by Belova et al., (2006) who proposed the presence of dust particles larger
than 10 nm for not observing the recovery during heater on period. The only difference
between the computational results in Figure 5 and the observations in Figure 4 is a slower
decay time of the turn-off overshoot at higher collision frequencies.
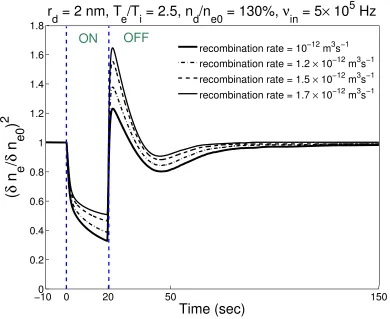
Another parameter that can affect the amplitude of electron density fluctuations during
heater turn-on is the recombination of electrons and ions. The recombination timeτrecom≈
1
γni0
1
√
rh where γ is the recombination rate and rh is the ratio of electron temperature
increase during heating. The effect of recombination rate τrecom on the temporal behavior
of PMWE during heater turn-on and off is shown in Figure 6. As can be seen, increasing
the recombination rate changes the turn-off overshoot and suppression level significantly.
The suppression level reduces about 20 percent and the turn-off overshoot is increased
from 1.2 to 1.7 whenτrecom increased by a factor of 1.7. It should be noted that the effect
of recombination rate was overlooked in the previous studies. Therefore, the recovery
with recombination rate 1.5 × 10⁻¹² m3s−1 is in quite reasonable agreement with the
experimental observations including suppresion level, turn-off overshoot, fall time and
rise time. The rise time of turn-off overshoot is about 2 s and the relaxation time to
undisturbed value is about 20 s.
4. HF PMWE
While there have been investigations of PMWE heating experiments in the VHF band,
there is no computational modelling or experimental observation of HF PMWE.
Consid-ering that the behavior of the temporal evolution of HF PMWE is expected to be different
than VHF PMWE as a result of longer irregularity wavelengths, the first computational
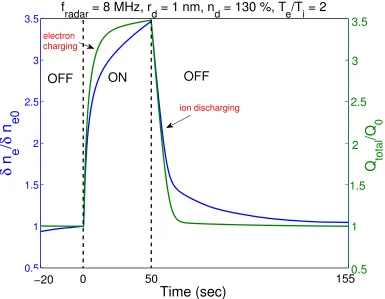
modeling of HF PMWE is considered in this paper. Figure 7 shows the computational
results for temporal evolution of electron irregularities associated with PMWE at 8 MHz
and average charge on dust particles. The comparison of the electron fluctuation
am-plitude (again related to radar cross-section) and the average dust charge Zd shows that
electron density fluctuation amplitude increases during HF pump heating. The average
charge on the dust particles is normalized to its value before the heater turn-on. The
average charge on dust particles is increased by a factor of 3.5 during heating and
re-turns to undisturbed value after heater turn-off. Small dust radius of 1 nm with density
about 130% relative to the background electron density are considered. It is assumed
that the irregularity scale size corresponds to a radar frequency of 8 MHz. It is evident
that the charge and fluctuation amplitude have very similar behavior and much can be
learned about the charging from the radar return. Therefore, enhancement of the
irregu-larity amplitude after heater turn-on in the HF band is a direct manifestation of the dust
be used to study fundamental physics of the dust charging process in space. It should
be noted that the electron density irregularity amplitude during HF PMSE heating also
is very closely related to the temporal evolution of charge on the dust particles (Scales
and Mahmoudian, 2016). The main difference between the PMSE and PMWE source
re-gions are the dust radius and density, background electron temperature and density, and
plasma/dust-neutral collision frequencies. According to Eq. (12), the diffusion timescale
is proportional toνin. Therefore,τdif f is typically larger in the PMWE source region. This
implies the ratio of τdif f to τchg may typically be larger than that in PMSE. Therefore
the conditions for turn-on enhancement of PMWE may possibly be more favorable. It is
note-worthy that including photo-detachment current will reduce the average charge on
the dust particles and as a result a weaker turn-on overshoot is expected.
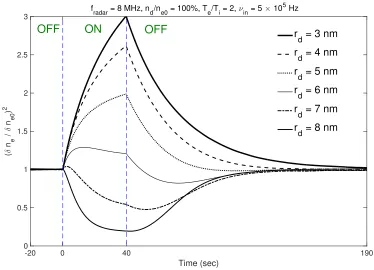
Another important parameter that affects the amplitude of turn-on overshoot is the
dust radius. Figure 8 shows the time evolution of PMWE at 8 MHz during radiowave
heating for dust radius variation from 3 nm to 8 nm. The dust density to background
plasma density is 100% to be consistent with previous in-situ measument of MSP in
PMWE region (Baumann et al., 2013). The electron temperature is elevated by a factor
of 2 during heating. As can be seen, the corresponding radar echoes are expected to
be enhanced by a factor of 3.5 and 3 after the heater turn-on for rd=3 nm and 4 nm,
respectively. Increasing dust radius to 5 nm and 6 nm, reduces the maximum turn-on
overshoot by about 50% and 70%, respectively. No turn-on overshoot is seen forrd= 7 nm
and 8 nm. Therefore, the smaller meteoric smoke particles in the PMWE source region
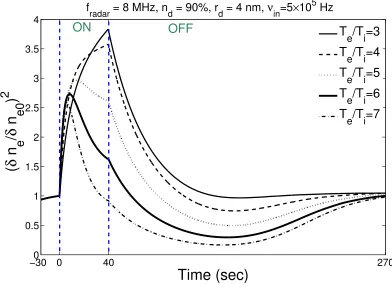
Figure 9 represents the variation of electron density fluctuation amplitude with varying
Te/Ti at 8 MHz during radiowave heating. As the electron temperature enhancement
ratio during heating increases, the maximum amplitude of backscattered radar signal and
turn-on overshoot reduces. The turn-on overshoot amplitude reaches 3.8 for Te/Ti = 3
and 2.5 for Te/Ti = 7. While the enhancement of radar signal is observed in the entire
heating cycle forTe/Ti = 3, the enhanced signal is observed only for 20 sec after the heater
turn-on and drops below one after that for Te/Ti =7. The enhanced radar signal decays
to its initial value within 50 s after the turn-off forTe/Ti = 3 and 4 and eventually reaches
the equilibrium state. The recovery time of radar echoes for Te/Ti= 5, 6 and 7 is about
200 s. According to Eq. (11), increasing the Te/Ti ratio reduces the charging timescale
while the reduction in electron density increases τchg since the charging time is inversely
proportional to ne. Therefore, there is a competition between the increased charging due
to increase in temperature but a decrease due to reduction in electron density. As can be
seen in Figure 9, the maximum amplitude of turn-on overshoot reduces by increasingTe/Ti
which is due to the larger reduction in electron density with increasingTe/Ti. Considering
that HF radar is signicantly affected by D-region absorption, measurement with high time
resolution is required to observe HF turn-on overshoot during experiment. As the dust
density and radius increases, the chance of observing the turn-on overshoot reduces. Based
on numerical simulations with 1< Te/Ti <2, the chance of observing turn-on overshoot at
8 MHz during PMWE heating experiment may be increased. Therefore, considering the
parameters used in Figure 9, the range 1< Te/Ti <2 may be most efficient for observing
5. Conclusions
Unlike polar mesospheric summer echoes (PMSE), polar mesospheric winter echoes
(PMWE) are less studied and understood. The computational study of active
modula-tion of PMWE by high power radiowaves at 8 MHz, 56 MHz, and 224 MHz, has been
presented in this study. The available radar frequencies at the EISCAT facility are
consid-ered. Variation of dust plasma parameters associated with PMWE such as dust radius,
dust density, recombination rate, electron- and dust-neutral collision frequencies, and
electron temperature enhancement ratio are included. The important role of
photode-tachment current and its effects on the agreement of experimental observation with the
computational results is investigated. Specifically, two sets of parameters are included
in this paper for dust radius. It has been shown for the first time that the dependence
of recombination rate on Te/Ti affects the time evolution of PMWE signal significantly
during radiowave heating. Dust radius as small as 1 nm as well as dust radius of 4 nm is
used. Computational results derived from different sets of parameters are considered and
compared with observations at 224 MHz and 56 MHz. The agreement between the model
results and the observations show the high potential of remote sensing of dust and plasma
parameters associated with PMWE. Measurement of Te/Ti using ISR and simultaneous
observations in two frequency bands may lead to a more accurate estimation of dust
den-sity and radius. Although it has been predicted that including dust particles smaller than
1nm will not qualitatively change the results, it requires a more sophisticated charging
model and is the subject of future investigation.
The enhancement of backscattered signal in the HF band during PMWE heating is
power (Te/Ti) for the observation of turn-on overshoot are investigated. It has been
shown that the similarity of the temporal evolution of electron density fluctuation (radar
echoes) in the HF band and average charge on the dust particles can be used to study
the fundamental physics associated with the dust charging in the PMWE source region.
Further active experiments of PMWEs should be pursued in the HF band to illuminate
the fundamental charging physics in the space environment and get more insight to this
unique medium. It has been determined that collision frequency and particle size in
PMWE are more important to observing the turn-on overshoot. Considering that there
has been no rocket measurement during PMWE in the past due low rate of occurrence,
conducting PMWE heating experiments along with the computational modeling in the
future could be useful approach to study the role of MSP in PMWE formation.
Acknowledgments. AM was supported through a research grant in the Institute of
Geophysics at the University of Tehran. Data used in this paper are availbale upon
request.
References
Baumann, C., Rapp, M., Kero, A., and Enell, C.-F.: Meteor smoke influences on the
D-region charge balance: Review of recent in situ measurements and one-dimensional
model results, Ann. Geophys., 31, 2049-2062, doi:10.5194/angeo-31-2049-2013, 2013.
Belova, E., Smirnova, M., Rietveld, M.T., Isham, B., Kirkwood, S., and Siergienko,
T, First observation of the overshoot effect for polar mesospheric winter echoes
dur-ing radiowave electron temperature modulation, Geophys. Res. Lett, 35, 2008. doi:
Bernstein, I.B. and I.N. Rabinowitz, Theory of electrostatic probes in a low density
plasma, Phys. Fluids, 2, 112-121, 1959.
Biebricher, A., and O. Havnes (2012), Non-equilibrium modeling of the PMSE
Over-shoot Effect revisited: A comprehensive study, J. Plasma Phys., 78, 303319,
doi:10.1017/S0022377812000141.
Brasseur, G., and P. C. Simon, Stratospheric chemical and thermal response to long-term
variability in solar irradiance, J. Geophys. Res., 86, 7343-7362, 1981.
Chen, C. and W.A. Scales, Electron temperature enhancement effects on plasma
irregu-larities associated with charged dust in the Earths mesosphere, J. Geophys. Res., 110,
A12313, doi:10.1029/2005JA011341, 2005.
Chilson, P. B., Belova, E., Rietveld, M. T., Kirkwood, S., and Hoppe, U.: First artificially
induced modulation of PMSE using the EISCAT heating facility, Geophys. Res. Lett.,
27, 38013804, 2000.
Friedrich, M., M. Rapp, T. Blix, U.-P. Hoppe, K. Torkar, S. Robertson, S. Dickson, and
K. Lynch (2012), Electron loss and meteoric dust in the mesosphere, Ann. Geophys.,
30, 14951501, doi:10.5194/angeo-30-1495-2012.
Havnes, O., J. Trim, T. Blix, W. Mortensen, L. I. Nsheim, E. Thrane, and T. Tnnesen
(1996), First detection of charged dust particles in the Earth’s mesosphere, J. Geophys.
Res., 101(A5), 1083910847, doi:10.1029/96JA00003.
Havnes, O.: Polar Mesospheric Summer Echoes (PMSE) overshoot effect due
to cycling of artificial electron heating, J. Geophys. Res., 109, A02309,
Havnes, O., and M. Kassa (2009), On the sizes and observable effects of dust
particles in polar mesospheric winter echoes, J. Geophys. Res., 114, D09209,
doi:10.1029/2008JD011276.
Havnes, O., C. La Hoz, M. T. Rietveld, M. Kassa, G. Baroni, and A. Biebricher
(2011), Dust charging and density conditions deduced from observations of
PMWE modulated by artificial electron heating, J. Geophys. Res., 116, D24203,
doi:10.1029/2011JD016411.
Havnes, O, Pinedo, H, La Hoz, C, Senior, A, Hartquist, TW, Rietveld, MT and Kosch,
MJ (2015), A comparison of overshoot modelling with observations of polar mesospheric
summer echoes at radar frequencies of 56 and 224 MHz. Annales Geophysicae, 33 (6).
737 - 747. ISSN 0992-7689.
Hunten, D. M., Turco, R. P., and Toon, O. B.: Smoke and Dust Particles of Meteoric
Origin in the Mesosphere and Stratosphere, J. Atmos. Sci., 37, 13421357, 1980.
Inhester, B., J. C. Ulwick, J. Y. N. Cho, M. C. Kelley, and G. Schmidt (1994), Consistency
of rocket and radar electron density observations: Implication about the anisotropy of
mesospheric turbulence, J. Atmos. Terr. Phys., 52, 855873.
Kavanagh, A.J., Honary, F., Rietveld, M.T., and A. Senior, First observations of the
artificial modulation of polar mesosphere winter echoes. Geophys. Res. Lett 33, L19801,
2006. doi:10.1029/2006GL02756.
Kero, A., C.-F. Enell, A. J. Kavanagh, J. Vierinen, I. Virtanen, and E. Turunen (2008),
Could negative ion production explain the polar mesosphere winter echo (PMWE)
modulation in active HF heating experiments?, Geophys. Res. Lett., 35, L23102,
Kirkwood, S., P. Chilson, E. Belova, P. Dalin, I. Haggstrom, M. Rietveld, and W. Singer
(2006a), Infrasound: The cause of strong Polar Mesosphere Winter Echoes?, Ann.
Geo-phys., 24, 475491.
Kirkwood, S., E. Belova, U. Blum, C. Croskey, P. Dalin, K.-H. Fricke, R. A. Goldberg, J.
Manninen, J. D. Mitchell, and F. Schmidlin (2006b), Polar Mesosphere Winter Echoes
during MaCWAVE, Ann. Geophys., 24, 12451255.
Kirkwood, S., Barabash, V., Belova, E., Nilsson, H., Rao, T. N., Stebel, K., Osepian, A.,
and Chilson, P. B.: Polar Mesosphere Winter Echoes during Solar Proton Events, Adv.
Polar Upper Atmos. Res., 16, 111125, 2002.
Knappmiller et al., S. Knappmiller, M. Rapp, S. Robertson, J. Gumbel (2011), Charging
of meteoric smoke and ice particles in the mesosphere including photoemission and
photodetachment rates J. Atmos. Sol. Terr. Phys., 73 (2011), pp. 2212–2220.
La Hoz, C., and O. Havnes (2008), Artificial modification of polar mesospheric winter
echoes with an RF heater: Do charged dust particles play an active role?, J. Geophys.
Res., 113, D19205, doi:10.1029/2008JD010460.
Latteck, R., and I. Strelnikova (2015), Extended observations of polar mesosphere winter
echoes over Andya (69N) using MAARSY, J. Geophys. Res. Atmos., 120, 82168226,
doi:10.1002/2015JD023291.
Lubken, F.-J., Strelnikov, B., Rapp, M., Singer, W., Latteck, R., Brattli, A., Hoppe,
U.-P., and Friedrich, M.: The thermal and dynamical state of the atmosphere during polar
mesosphere winter echoes, Atmos. Chem. Phys., 6, 13-24, doi:10.5194/acp-6-13-2006,
Mahmoudian, A., Scales, W. A., Kosch, M. J., Senior, A., and Rietveld, M.: Dusty space
plasma diagnosis using temporal behavior of polar mesospheric summer echoes during
active modification, Ann. Geophys., 29, 2169-2179, doi: 10.5194/angeo-29-2169-2011,
2011.
Mahmoudian, A. and W. A. Scales, Temporal evolution of radar echoes associated
with mesospheric dust clouds after turn-on of radiowave heating, J. Geophys. Res.,
doi:10.1029 /2011 JD017166, 2012.
Nishiyama, T., K. Sato, T. Nakamura, M. Tsutsumi, T. Sato, M. Kohma, K. Nishimura,
Y. Tomikawa, M. K. Ejiri, and T. T. Tsuda (2015), Height and time characteristics of
seasonal and diurnal variations in PMWE based on 1 year observations by the PANSY
radar (69.0◦S, 39.6◦E), Geophys. Res. Lett., 42, 21002108, doi:10.1002/2015GL063349.
Rapp, M., and F. J. Lubken, Modeling of positively charged aerosols in the polar summer
mesopause region, Earth Planets Space, 51, 799 807, 1999.
Rapp, M. and F.J. Lubken (2004), Polar mesosphere summer echoes (PMSE): Review of
observations and current understanding, Atmos. Chem. Phys., 4, 26012633.
Rapp, M., Charging of mesospheric aerosol particles: the role of photodetachment and
photoionization from meteoric smoke and ice particles, Annales Geophys. 27, 24172422,
2009.
Rosenberg, M., J. Vac. Sci. Technol., Ion-dust streaming stabilities in processing plasmas,
14, 631, 1996.
Rosenberg, M., and P. K. Shukla, Dust-acoustic-drift wave instability in a space dusty
Robertson, et al., (2009), Mass analysis of charged aerosol particles in NLC and PMSE
during the ECOMA/MASS campaign, Ann. Geophys., 27, 12131232
(http://www.ann-geophys.net/specialissue219.html).
Robertson, S., Dicksom, S., Horanyi, M., Sternovsky, Z., Friedrich, M., Janches, D.,
Megner, L., and Williams, B.: Detection of meteoric smoke particles in the mesosphere
by a rocket-borne mass spectrometer, J. Atmos. Sol. Terr. Phys., 118, 161179, 2014
Russell, J. M., et al. (2009), Aeronomy of Ice in the Mesosphere (AIM): Overview and
early science results, J. Atmos. Sol. Terr. Phys., 71, 289299.
Scales, W.A. and Mahmoudian, A. (2016), Charged dust phenomena in the
near Earth space environment, Reports on Progress in Physics, Vol 79, No 10,
http://dx.doi.org/10.1088/0034-4885/79/10/106802.
Senior, A., A. Mahmoudian, H. Pinedo,C. La Hoz, M. T. Rietveld, W. A.
Scales,and M. J. Kosch (2014), First mod-ulation of high-frequency
polarmeso-spheric summer echoes byradio heating of the ionosphere,Geophys. Res. Lett., 41,
53475353,doi:10.1002/2014GL060703.
Schmitter, E. D.: Remote sensing planetary waves in the midlatitude mesosphere using
low frequency transmitter signals, Ann. Geophys., 29, 1287-1293,
doi:10.5194/angeo-29-1287-2011, 2011.
Shukla, P. D., and A. A. Mamun (2002), Introduction to Dusty Plasma Physics, Inst. of
Phys., Bristol, U. K.
Strelnikova, I., M. Rapp, S. Raizada, and M. Sulzer (2007), Meteor smoke particle
prop-erties derived from Arecibo incoherent scatter radar observations, Geophys. Res. Lett.,
Zeller, O., M. Zecha, J. Bremer, R. Latteck, and W. Singer (2006), Mean characteristics
of mesosphere winter echoes at mid and high latitudes, J. Atmos. Sol. Terr. Phys., 68,
−10 0 20 65 0.5 1 1.5 2 2.5 3 Time (sec) ( δ n e / δ n e0 ) 2 r
d = 1.5 nm, nd = 150%, νin = 10 5
Hz, T
e/Ti =2
α = 0 α = 0.005 α = 0.01 α = 0.08 α = 0.1
ON
OFF OFF
(a)
-10 0 20 65
Time (sec) 0 1 2 3 4 5 6 7 8 9 10 Ie /Ie0
α = 0
α = 0.005
α = 0.01
α = 0.08
α = 0.1
-10 0 20 65
Time (sec) 0.9 1 1.1 1.2 1.3 1.4 1.5 1.6 1.7 1.8 1.9 Ii /Ii0
rd = 1.5 nm, nd = 150%, ν in = 10
5
Hz, Te/Ti =2
α = 0
α = 0.005
α = 0.01
α = 0.08
α = 0.1
ON OFF ON OFF
[image:31.612.72.403.176.679.2](b)
Figure 1. Variation of a) electron irregularity amplitude and b) normalized total
Figure 2. Average curves of modulated PMWE at 56 MHz for 68 heating cycles in the
altitude range 58.1 and 63.2 km observed by Havnes et l., (2011). Epoch analysis of two
0 20 170 0 0.2 0.4 0.6 0.8 1 1.2
Time (sec)
(
δ
n
e/
δ
n
e0)
2f
radar
= 56 MHz, T
e/T
i= 3,
ν
in= 10
5Hz,
α
= 0. 001
r
d = 2.5 nm, nd = 235% r
d = 2.5 nm, nd = 245% r
d = 2 nm, nd = 320% r
d = 2 nm, nd = 340%
(a) ON OFF
−10 00 20 190
0.2 0.4 0.6 0.8 1 1.2 1.4
Time (sec)
(
δ
n
e/
δ
n
e0)
2 fradar = 56 MHz, rd = 4 nm, νin = 10
5 Hz
T
e/Ti = 3, nd = 65% T
e/Ti = 3, nd = 70% T
e/Ti = 4, nd = 60%
ON OFF
[image:33.612.73.430.69.660.2](b)
Figure 4. Epoch analysis of PMWE layer during 7 heating cycles. Data were normalized
by the values observed 12 s prior to the time of heating switching on. The heater is
-10 0 20 50 130 Time (sec) 0 0.2 0.4 0.6 0.8 1 1.2 1.4 1.6 1.8 ( δ n e / δ n e0 ) 2
fradar = 224 MHz, ν
in = 10
5 Hz
r
d = 1.5 nm, nd/ne0 = 210%, Te/Ti = 2, α = 0.005
r
d = 1.5 nm, nd/ne0 = 210%, Te/Ti = 2, α = 0
r
d = 1 nm, nd/ne0 = 320%, Te/Ti = 2.2, α = 0
OFF ON
(a)
-10 0 20 60 180
Time (sec) 0 0.2 0.4 0.6 0.8 1 1.2 1.4 1.6 ( δ n e / δ n e0 ) 2
fradar = 224 MHz, rd = 4 nm
n
d/ne0 = 100%, Te/Ti = 2, νin = 6 × 10
5 Hz
n
d/ne0 = 100%, Te/Ti = 2, νin = 8 × 10
5 Hz
n
d/ne0 = 105%, Te/Ti = 2.5, νin = 10
6 Hz
OFF ON
[image:35.612.89.463.71.631.2](b)
Figure 5. Temporal evolution of PMWE during radiowave heating at 224 MHz for a)
rd = 1 nm and 1.5 nm and b) rd = 4 nm with varying ion-, dust-, and electron-neutral
−100 0 20 50 150 0.2
0.4 0.6 0.8 1 1.2 1.4 1.6 1.8
r
d
= 2 nm, T
e/T
i= 2.5, n
d/n
e0= 130%,
ν
in= 5
×
10
5Hz
Time (sec)
(
δ
n
e/
δ
n
e0)
2
recombination rate = 10−12 m3s−1
recombination rate = 1.2 × 10⁻¹² m3s−1
recombination rate = 1.5 × 10⁻¹² m3s−1
recombination rate = 1.7 × 10⁻¹² m3s−1
[image:36.612.62.452.70.389.2]ON
OFF
Figure 6. Temporal evolution of PMWE during radiowave heating at 224 MHz with
varying recombination rate. The heater is turned-on at t = 0 s and turned-off at t = 20
0.5 1 1.5 2 2.5 3 3.5
f
radar
= 8 MHz, r
d= 1 nm, n
d= 130 %, T
e/T
i= 2
δ
n
e/
δ
n
e00.2 0.4 0.6 0.8 1 1.2 1.4 1.6 1.8 2
x 105
0.5 1 1.5 2 2.5 3 3.5
Q
total/Q
0ON
OFF
OFF
−25 0−20 0 0.5
[image:37.612.79.464.73.372.2]1 1.5 2 2.5 3.5 3 50 155
Time (sec)
electron charging ion dischargingFigure 7. Comparison of average dust charge and electron fluctuation associated with
-20 0 40 190 Time (sec)
0 0.5 1 1.5 2 2.5 3
(
δ
n e
/
δ
n e0
)
2
fradar = 8 MHz, nd/ne0 = 100%, Te/Ti = 2, ν
in = 5 × 10
5 Hz
r
d = 3 nm r
d = 4 nm r
d = 5 nm r
d = 6 nm r
d = 7 nm r
d = 8 nm
ON OFF
[image:38.612.77.451.74.344.2]OFF
Figure 8. Time evolution of electron density fluctuation amplitude in PMWE region
during radiowave heating with varying dust radius. The heater is turned at t = 0 s and
−300 0 40 270 0.5
1 1.5 2 2.5 3 3.5 4
f
radar = 8 MHz, nd = 90%, rd = 4 nm, νin=5×10
5 Hz
Time (sec)
(
δ
n
e/
δ
n
e0)
2
T
e/Ti=3
T
e/Ti=4
T
e/Ti=5
T
e/Ti=6
T
e/Ti=7
[image:39.612.69.461.73.360.2]ON OFF
Figure 9. Time evolution of electron density fluctuation amplitude in PMWE region
during radiowave heating with varying dust radius. The heater is turned at t = 0 s and