GALAXY ZOO: MAJOR GALAXY MERGERS ARE NOT A SIGNIFICANT QUENCHING PATHWAY*
ANNAK. WEIGEL1, KEVINSCHAWINSKI1, NEVENCAPLAR1, ALFREDOCARPINETI2, ROSSE. HART3, SUGATAKAVIRAJ4, 5, WILLIAMC. KEEL6, SANDORJ. KRUK7, CHRISJ. LINTOTT7, ROBERTC. NICHOL8, 9, BROOKED. SIMMONS10ANDREBECCAJ.
SMETHURST3, 7
Draft version August 4, 2017
ABSTRACT
We use stellar mass functions to study the properties and the significance of quenching through major galaxy mergers. In addition to SDSS DR7 and Galaxy Zoo 1 data, we use samples of visually selected major galaxy mergers and post merger galaxies. We determine the stellar mass functions of the stages that we would expect major merger quenched galaxies to pass through on their way from the blue cloud to the red sequence: 1: major merger, 2: post merger, 3: blue early type, 4: green early type and 5: red early type. Based on the similar mass function shapes we conclude that major mergers are likely to form an evolutionary sequence from star formation to quiescence via quenching. Relative to all blue galaxies, the major merger fraction increases as a function of stellar mass. Major merger quenching is inconsistent with the mass and environment quenching model. Atz∼0 major merger quenched galaxies are unlikely to constitute the majority of galaxies that transition the green valley. Furthermore, betweenz∼0−0.5 major merger quenched galaxies account for
1−5% of all quenched galaxies at a given stellar mass. Major galaxy mergers are therefore not a significant
quenching pathway, neither atz∼0 nor within the last 5 Gyr. The majority of red galaxies must have been quenched through an alternative quenching mechanism which causes a slow blue to red evolution.
Subject headings:galaxies: interactions — galaxies: luminosity function, mass function — galaxies: evolution
1. INTRODUCTION
The physical cause of the cessation of star formation is an open question in astrophysics today. In the local Universe, galaxies fall into two broad categories: spiral or late type galaxies, which mostly have a blue optical colour, and ellip-tical or early type galaxies, which are primarily opellip-tically red (but also see: Schawinski et al. 2009;Masters et al. 2010). In the colour-mass and colour-magnitude diagrams galaxies separate into the ‘blue cloud’ and the ‘red sequence’ (Bell et al. 2003;Baldry et al. 2004;Martin et al. 2007;Taylor et al. 2015). Between the blue cloud and the red sequence lies the so-called ‘green valley’ (Bell et al. 2003;Martin et al. 2007;
Faber et al. 2007;Fang et al. 2012;Schawinski et al. 2014), a transition zone that contains both late and early type ies. Blue cloud galaxies are also often referred to as galax-ies on the ‘main sequence’ (Brinchmann et al. 2004; Salim et al. 2007;Noeske et al. 2007;Daddi et al. 2007;Elbaz et al.
*This publication has been made possible by the participation of more
than 100 000 volunteers in the Galaxy Zoo project. Their contributions are individually acknowledged athttp://authors.galaxyzoo.org.
1Institute for Astronomy, Department of Physics, ETH Zurich,
Wolfgang-Pauli-Strasse 27, CH-8093 Zurich, Switzerland
2Blackett Laboratory, Imperial College London, London SW7 2AZ,
UK
3School of Physics and Astronomy, The University of Nottingham,
University Park, Nottingham NG7 2RD, UK
4Centre for Astrophysics Research, University of Hertfordshire,
Col-lege Lane, Hatfield AL10 9 AB, UK
5Worcester College, Oxford, UK
6Department of Physics and Astronomy, University of Alabama, Box
879324, Tuscaloosa, AL 35487, USA
7Oxford Astrophysics, Denys Wilkinson Building, Keble Road, Oxford
OX1 3RH, UK
8Institute of Cosmology & Gravitation, University of Portsmouth,
Den-nis Sciama Building, Portsmouth PO1 3FX, UK
9South East Physics Network, www.sepnet.ac.uk
10Center for Astrophysics and Space Sciences (CASS), Department of
Physics, University of California, San Diego, CA 92093, USA
2007;Peng et al. 2010;Lilly et al. 2013;Speagle et al. 2014;
Lee et al. 2015;Tomczak et al. 2016;Kurczynski et al. 2016). In star formation rate (SFR) versus stellar mass space they lie on an almost linear relation. Red early type galaxies are quiescent. They have significantly lower SFRs than blue late types and thus lie below the main sequence. The bimodality in colour-mass and colour-magnitude space and the existence of the main sequence imply that blue galaxies are likely to shut down their star formation at some point during their lifetime. A significant decrease in the SFR causes them to transition from the blue cloud to the green valley and finally to the red sequence. In combination with a morphological transforma-tion from spiral to elliptical, this evolutransforma-tion could explain the existence of the red sequence. We refer to the physical process that causes blue galaxies to shut down their star formation as quenching.
A variety of physical processes that could cause star for-mation quenching have been proposed. These can be classi-fied into internal and external processes. Internal processes include AGN feedback (Silk & Rees 1998;Di Matteo et al. 2005;Schawinski et al. 2006;Kauffmann et al. 2007; Geor-gakakis et al. 2008;Hickox et al. 2009;Cattaneo et al. 2009;
Fabian 2012; Bongiorno et al. 2016; Kaviraj et al. 2017) and secular processes (Kormendy & Kennicutt 2004;Masters et al. 2011;Cheung et al. 2013). Externally, quenching could be correlated with the environment (Gunn & Gott 1972; Lar-son et al. 1980;Balogh et al. 2000;Woo et al. 2015;Knobel et al. 2015;Peng et al. 2015) or with the occurrence of ma-jor galaxy mergers (Sanders et al. 1988;Mihos & Hernquist 1996;Springel et al. 2005b;Di Matteo et al. 2005;Hopkins et al. 2006; Croton et al. 2006;Hopkins et al. 2008b; Kha-latyan et al. 2008;Somerville et al. 2008). Of course we could also imagine a combination of different processes. For ex-ample, (Peng et al. 2010hereafterP10andPeng et al. 2012) use external (‘environment quenching’) and mass dependent, likely internal (‘mass quenching’) processes to reproduce the
stellar mass function of red galaxies with their phenomeno-logical model.
Our aim is to study the classical quenching model based on major mergers. Mergers between gas rich galaxies of com-parable mass cause most of the galaxies’ gas to be driven to the new center. This can ignite both a starburst and an AGN. Star formation and AGN feedback can expel the gas from the galaxy, preventing further star formation. The now ellipti-cal galaxy leaves the blue cloud and crosses the green valley before settling on the red sequence (Sanders et al. 1988; Mi-hos & Hernquist 1996;Springel et al. 2005b;Di Matteo et al. 2005;Hopkins et al. 2006;Croton et al. 2006;Hopkins et al. 2008b;Khalatyan et al. 2008;Somerville et al. 2008).
We use stellar mass functions of galaxies that are transition-ing from the blue cloud to the red sequence to study the prop-erties and the significance of this quenching process. Stellar mass functions are an important statistical measure that allow us to study and infer the properties of a large sample of galax-ies. Specifically, they allow us to probe if quenching through major mergers includes a mass dependence. Furthermore, we can constrain the relative amount of time spent in stages along the sequence and measure the merger fraction. By compar-ing the stellar mass function shapes of major mergers and red galaxies we can also test if merger quenching can account for all quenched galaxies or if an additional quenching channel is necessary.
To construct these stellar mass functions, we rely on mor-phological classifications from Galaxy Zoo12. Besides the
classifications from Galaxy Zoo 1 (GZ1;Lintott et al. 2008,
2011), we also use the major merger sample byD10(hereafter
D10) andDarg et al.(2010b) and the post merger sample by
Carpineti et al.(2012). Our analysis is thus based on the vi-sual classifications of over 100 000 Galaxy Zoo volunteers.
We determine the stellar mass functions of galaxies along the major merger quenching sequence by using the method introduced in Weigel et al. (2016). This approach is based on the combination of three independent methods (1/Vmax:
Schmidt 1968, STY:Sandage et al. 1979, SWML:Efstathiou et al. 1988). Blue, star forming and red, quiescent galaxies are usually well fit by single and double Schechter functions, respectively (e.g.Li & White 2009;P10;Pozzetti et al. 2010;
Baldry et al. 2012;Ilbert et al. 2013;Muzzin et al. 2013). Yet it is important to note that when fitting the stellar mass func-tions, we are not making any a priori assumptions on which galaxy subsample should be fit with a single and a double Schechter function. We use a likelihood ratio test to deter-mine the better fitting model.
This paper is organized as follows. In Section2we intro-duce the galaxy, the major merger and the post merger sample and give a brief overview of the stellar mass function method used in Weigel et al.(2016). Section 4 represents the first part of the paper and is purely data driven: we introduce the stellar mass functions of major mergers and post mergers, de-termine the merger fraction and test if our measurements are consistent with the phenomenological model byP10. In the second part of the paper we use these stellar mass functions to investigate the process of major merger quenching. First, we introduce and motivate our assumptions in Section4. Second, in Section5we apply these assumptions to our measurements. This is followed by a discussion and a summary in Sections6
and7, respectively.
Throughout this paper we assume aΛCDM cosmology with
12http://www.galaxyzoo.org
h0= 0.7,Ωm= 0.3 andΩΛ= 0.7 (Komatsu et al. 2011).
2. DATA
2.1. The SDSS galaxy sample
For our analysis we use data from the seventh data release (DR7) of the Sloan Digital Sky Survey (SDSS; York et al. 2000;Abazajian et al. 2009). We extract spectroscopic red-shift and magnitude values from the New York Value-Added Galaxy Catalog (NYU VAGC;Blanton et al. 2005; Padman-abhan et al. 2008). For the stellar masses measurements we useBrinchmann et al.(2004) recorded in the Max Planck In-stitute for Astrophysics John Hopkins University (MPA JHU;
Kauffmann et al. 2003;Brinchmann et al. 2004;Salim et al. 2007) catalog. These stellar mass estimates are based on fits to the photometry and model spectra by Bruzual & Charlot
(2003) and are in good agreement to the 4000 Å and HδA
based measurements byKauffmann et al.(2003)13.
We cross match to the GZ1 catalog14 (table 2 in Lin-tott et al. 2011, also see Lintott et al. 2008; Land et al. 2008) to obtain morphological classifications for all galax-ies. Each object in the sample was classified 38 times on average by over 100 000 Galaxy Zoo volunteers. GZ115
users were given six possible classifications for each galaxy (‘Elliptical galaxy’, ‘Clockwise/Z-wise spiral galaxy’, ‘Anti-clockwise/S-wise spiral galaxy’, ‘Spiral galaxy other (e.g. edge on)’, ‘Star or do not know’, ‘Merger’). These can be summarized into ‘elliptical’ (E) and ‘combined spiral’ (CS = ‘Clockwise/Z-wise spiral galaxy’ + ‘Anti-clockwise/S-wise spiral galaxy’ + ‘Spiral galaxy other (e.g. edge on)’) galaxies. The likelihood of a galaxy having a spiral or an elliptical mor-phology depends on the fraction of users that have classified the galaxy as such. This is referred to as the vote fraction.
We base our analysis on the ‘elliptical’, ‘spiral’ and ‘uncer-tain’ type flags. These flags are based on vote distributions that have been corrected for classification bias (Bamford et al. 2009, seeWillett et al. 2013andHart et al. 2016for Galaxy Zoo 2). High redshift galaxies are more likely to be catego-rized as ellipticals since they appear fainter and smaller which makes it more difficult for the classifier to recognize mor-phological features. To correct for this effect elliptical and combined spiral galaxies with raw vote fractions above 80% are chosen to compute the elliptical-to-spiral ratio. The raw vote distributions are then debiased by assuming that there is no redshift evolution in this morphological ratio within bins of luminosity and size. Galaxies with debiased vote frac-tions above 80% in the elliptical and spiral categories are then flagged as ‘elliptical’ and ‘spiral’, respectively. Galaxies for which the debiased vote fractions in both the elliptical and the combined spiral category lie below 80% are flagged as ‘un-certain’. We note that the GZ1 interface did not allow users to classify galaxies as ‘uncertain’. The ‘uncertain’ flag simply reflects the fact that a galaxy’s spiral and elliptical probabili-ties lie below the corresponding thresholds.Schawinski et al.
(2014) argue that the majority of galaxies in the ‘uncertain’ category show late type characteristics, whereas only a small fraction might be misclassified early types. By using a high debiased vote fraction cut of 80% we eliminate some of the nuances in galaxy morphologies. Yet the resulting clean early type sample allows the inference of a broad picture of galaxy
13 http://wwwmpa.mpa-garching.mpg.de/SDSS/DR7/
mass_comp.html
14http://data.galaxyzoo.org
1.0
2.0
3.0
u
−
r
co
lo
r
[A
B
]
entire sample
blue
green
red
1.0e+03
1.9e+033.7e+03
7.2e+031.4e+04
2.7e+04
2.7e+04
5.2e+04
late types
blue
green
red
1.0e+031.9e+033.7e+03
7.2e+03
1.4e+04
2.7e+04
9.0
10.0
11.0
Stellar Mass log(
M /M
¯)
1.0
2.0
3.0
u
−
r
co
lo
r
[A
B
]
indeterminates
blue
green
red
1.0e+03 1.9e+03 3.7e+03 7.2e+03 1.4e+04
2.7e+04 2.7e+04
9.0
10.0
11.0
Stellar Mass log(
M /M
¯)
early types
blue
green
red
1.0e+03 1.9e+03 3.7e+03 7.2e+03
1.4e+04
FIG. 1.— Colour mass diagrams for the entire galaxy sample, indeterminates and late and early types. All colours are dust and k- corrected. The dashed lines indicate our definition of the green valley (equations1,2). Out of the∼110’000 objects in the entire galaxy sample, 33.29% and 8.44% are classified as being late and early type galaxies, respectively. For the remaining galaxies the probability of being a late or an early type galaxy lies below the vote fraction threshold. They are categorized as indeterminate. This figure illustrates that splitting the sample by colour is not equivalent to splitting the sample by morphology since not all late type galaxies are blue (Masters et al. 2010) and not all early type galaxies are red (Schawinski et al. 2009). The contours represent equal steps in in log space and show the number of objects.
evolution. We refer to galaxies which are flagged as ‘ellip-tical’, ‘spiral’ and ‘uncertain’ as early types, late types and indeterminates.
To be able to correct for dust, we use the absorption- and emission-line measurements from OSSY (Oh et al. 2011). As an environment estimate, we include the overdensity measure-ments fromWeigel et al.(2016) which are based on a 5th near-est neighbor approach (M>109M
, recession velocity range
±1000km/s). We also add halo mass measurements, spec-tral completeness values and the classification into censpec-trals and satellites from the Yang et al.(2007) catalog. We limit our main sample to the redshift range between 0.02 and 0.06 and to objects of the MPA JHU spectral type ‘GALAXY’. We refer to the sample of galaxies that lie within this red-shift range, have the correct spectroscopic classification and for which stellar masses, morphological classifications and environment and emission line measurements are available as the ‘entire galaxy sample’. For more details on this sample and the overdensity measurement seeWeigel et al.(2016).
2.2. Colour cuts
We use the colour-mass diagram (Bell et al. 2003;Baldry et al. 2004;Martin et al. 2007;Faber et al. 2007;Schawinski et al. 2014) to split our sample into red, green and blue galax-ies. We use the Petrosian flux values from the NYU VAGC
and apply a dust and k-correction. We k-correct to redshift zero using theKCORRECT IDLpackage (version 4.2) by Blan-ton & Roweis(2007) and use the Calzetti law (Calzetti et al. 2000) withE(B−V) values from OSSY ([EBV_STAR], Oh et al. 2011) to correct for internal dust extinction. We show the colour-mass diagram for our main sample in Fig.1.
We use the colour definitions fromWeigel et al.(2016) and refer to sources lying above :
u−r(logM) = 0.6+0.15×logM (1) as being red and to galaxies below
u−r(logM) = 0.15+0.15×logM (2) as being blue. Objects between equations1and2are part of the green valley (Bell et al. 2004;Martin et al. 2007;Fang et al. 2012;Schawinski et al. 2014) and are referred to as be-ing green.
The colour-mass diagram in Fig. 1illustrates that splitting the sample by colour and morphology yields different results. Not all early types are red (Schawinski et al. 2009) and not all late types are blue (Masters et al. 2010).
2.3. The major merger sample
con-tains 3003 visually classified merging systems in the redshift range 0.005−0.1.
D10based their sample on the GZ1 morphological classifi-cations (see Sect. 2.1). For each source,D10calculated the ratio of the number of people who classified this objects as a merger to the total number of classifications of this source. The weighted-merger-vote fraction fm of this object is then
defined as this ratio multiplied by a weighting factor that rep-resents the reliability of all users that classified the object. If
fmis equal to its minimum value 0, the galaxy is unlikely to
be a merger. If fmis equal to its maximum value 1 the galaxy
has consistently been classified as a merger. In their catalog
D10only include galaxies for which fm>0.4.
D10determine stellar masses for all galaxies in their sam-ple by fitting two-component star formation histories to the photometry. These fits are based onMaraston(1998,2005) stellar models, a Salpeter (Salpeter 1955) initial mass func-tion, stellar populations with fixed solar metallicity and vari-able ages and a dust implementation according to the Calzetti law (Calzetti et al. 2000). SDSS spectra and thus MPA JHU (Kauffmann et al. 2003;Brinchmann et al. 2004;Salim et al. 2007) stellar mass measurements for both galaxies involved in the merger are only available for 23% of all merging systems in theD10catalog. We thus use the photometry based stellar mass measurements byD10to restrict ourselves to mergers between galaxies with a mass ratio within 1/3<M1/M2<3.
While we use the stellar mass estimates byD10to select major mergers, we use the stellar mass values by Brinch-mann et al.(2004) for the construction of the major merger mass function to ensure consistency with the other mass func-tions presented here. If spectra are available for both merging galaxies we consider the mass of the more massive merging partner in the construction of the major merger mass function. If only one of the two sources has been observed spectroscop-ically, we take the mass of the source with an available spec-trum into account. According ot theD10mass measurements, this corresponds to the more massive merging partner in 69% of all merging systems with one spectrum. We discuss the effect of this approach on the merger mass function shape in SectionA.1.
D10 find that their sample of merging galaxies contains three times as many spiral as elliptical galaxies and is dom-inated by mergers between spiral galaxies. In the general galaxy population the ratio of spirals to ellipticals is 3:2 for the same redshift range and above the same magnitude limit.
Willett et al.(2015) show that on average theD10merging galaxies pairs lie ∼0.3 dex above the main sequence rela-tion. Using the colour definitions introduced in Section2.2, we classify∼55% of all major merger galaxies in our sam-ple as blue. We thus conclude that the majority of merging galaxies in theD10sample are blue, star forming spirals.
Galaxy pairs which seem to be merging due to projection effects can easily be eliminated if spectroscopic redshifts are available for both galaxies. When only one of the merging galaxies has an available spectrum, the major merger candi-date has to be visually examined for galaxy interactions.D10
argue that galaxies withfm>0.4 are predominately clear
ma-jor mergers and that decisions regarding possible projection effects only have to be made in rare cases. Stellar projections are excluded based on the SDSS PHOTOTAG ‘type’ classi-fication which indicates whether the possible merging partner is point-like or extended.
2.4. The post merger sample
In the construction of their major merger sampleD10flag objects that were classified as being a major merger by the Galaxy Zoo users and only show a single core. These objects are identified as a single source by SDSS, but show strong perturbations in the outskirts. They are therefore likely to be objects in the late stages of a merger. D10flag these ob-jects which can no longer be resolved by the SDSS pipeline as ‘post mergers’. Strong perturbations in the periphery can also be caused by a close encounter with a second galaxy that is no longer in the field of view. These objects are flagged as ‘fly-bys’. WhileD10do not include these perturbed systems in their major merger catalog,Carpineti et al.(2012) investi-gate the colour and AGN activity of as ‘post merger’ flagged sources relative to early type galaxies. We refer to galaxies in theCarpineti et al.(2012) sample as post mergers.
Carpineti et al.(2012) select a sample of spheroidal post mergers and argue that∼55% of sources in this sample are remnants of merging systems which involved at least one late type galaxy. According to our colour definitions,∼87% are defined as blue.
We note that the major merger and post merger sample are based on SDSS DR6 while the rest of our analysis is based on SDSS DR7. The galaxies of the SDSS DR6 spectroscopic sample make up ∼85% of the galaxies in the SDSS DR7 spectroscopic sample 16. Assuming there is no bias in the
way the additional galaxies in DR7 were selected, we would expect to find ∼15% more major merger and post merger galaxies if we select them in the same way from DR7 instead of DR6. For the major merger and post merger mass func-tions which we will determine below this would result in a constant increase in the normalization by∼0.06 dex. Using SDSS DR6 instead of SDSS DR7 data for the major merger and post merger sample does hence not significantly affect our results.
2.5. Stellar mass function construction
To construct stellar mass functions we followWeigel et al.
(2016) and combine the classical 1/Vmax approach
devel-oped bySchmidt(1968) with the parametric maximum like-lihood method by Sandage et al.(1979) (STY) and the non-parametric step-wise maximum likelihood method (SWML) which was established byEfstathiou et al.(1988) .
In STY, we are assuming that the stellar mass function can be modelled by either a single or a double Schechter function (Schechter 1976). We estimate the likelihood of both func-tional forms and use a likelihood ratio test to determine which model provides a better description of the data.
In the figures below we show the 1/Vmax and SWML
re-sults with open and filled symbols, respectively. Upper limits according to the two methods are shown with arrows of the same style. The best-fitting Schechter functions according to the STY method are illustrated with solid lines. The corre-sponding 1σerrors are shown as shaded regions.
We define the single Schechter function as:
ΦdlogM= ln(10)Φ∗e−M/M∗
M M∗
α+1
dlogM (3) and use the following definition for the double Schechter
16 See http://classic.sdss.org/dr6/ and http:
function:
ΦdlogM= ln(10)e−M/M∗
×
"
Φ∗1
M M∗
α1+1 +Φ∗2
M M∗
α2+1#
dlogM.
(4) Note that the ln 10 factor and the+1 in the exponent ofM/M∗
is due to the conversion fromdMtodlogM.
For each sample, we determine the stellar mass complete-ness as a function of redshift using the technique introduced byPozzetti et al.(2010). This approach is based on keeping the mass-to-light ratio of each individual source constant and determining the stellar mass that this object would have if its redshift stayed constant, but its flux was equal to the magni-tude limit.
For the 1/Vmaxapproach we determine the stellar mass
com-pleteness of each subsample and subsequently theVmaxvalues
of each source by using the approach byPozzetti et al.(2010). To be able to apply the STY and the SWML method, we also estimate the minimum stellar mass at which each galaxy would still be part of the sample. We do so by keeping the mass-to-light ratio constant and scaling the flux down to the
r-band flux limit.
Weigel et al.(2016) show that the three independent mass function estimators deviate at the low mass end. Compared to STY and SWML, the 1/Vmaxtechnique tends to overestimate
Φ(also seeEfstathiou et al. 1988andWillmer 1997) and de-pends strongly on the shape of the stellar mass completeness function. While STY and SWML might be less commonly used mass function estimators, they have the advantage that theΦvalues in different mass bins are not independent form each other. This makes these two techniques more robust to-wards deviations in the mass completeness function. For a more detailed discussion of each of the mass function estima-tors, their advantages and disadvantages and systematics that might affect them seeWeigel et al.(2016).
3. MAJOR MERGER AND POST MERGER STELLAR
MASS FUNCTIONS
In the following section we present the stellar mass func-tions of local major mergers and post mergers. We use these stellar mass functions to determine the major merger fraction as a function of stellar mass. Furthermore, we determine the stellar mass functions of major mergers in different environ-ments to compare our results to the predictions byP10.
3.1. Stellar mass functions of major mergers and post mergers
In Fig. 2 we show the stellar mass functions of local ma-jor mergers and post mergers based on the samples byD10
and Carpineti et al. (2012). As we discussed above, we combine three stellar mass function techniques according to
Weigel et al.(2016). The results of the classical 1/Vmax and
the SWML method are shown with open and filled symbols, respectively. The solid lines illustrate the results of the STY technique, the shaded regions show the corresponding 1σ er-ror contours. Upper limits are computed and shown for the 1/Vmax and SWML results. The best-fitting Schechter
func-tion parameters are given within the panels and are also given in Table1which summarizes the parameters of all stellar mass functions used in this analysis.
-7.0
-5.0
-3.0
major mergers
log(
M
∗/M
¯
) = 10
.
89
±0
.
06
log(Φ
∗/
h
3Mpc
−3) =
−4
.
30
±0
.
03
α
=
−0
.
55
±0
.
08
9.0
10.0
11.0
12.0
Stellar Mass log(
M /M
¯)
-7.0
-5.0
-3.0
post mergers
log(
M
∗/M
¯
) = 11
.
00
±0
.
11
log(Φ
∗/
h
3Mpc
−3) =
−5
.
01
±0
.
09
α
=
−0
.
81
±0
.
09
lo
g
(
φ/
h
3
M
pc
−
3
de
x
−
1
)
FIG. 2.— Stellar mass functions of local major mergers and post mergers. To construct these stellar mass functions we use the samples of visually clas-sified major mergers and post mergers byD10andCarpineti et al.(2012), respectively. The open (1/Vmax) and filled (SWML) symbols and solid lines
(STY) show the results of different stellar mass function techniques accord-ing toWeigel et al.(2016). Upper limits are computed based on both the 1/Vmaxand SWML technique. The best-fitting Schechter function parameters
are given within the panels and are summarized in Table1.
3.2. Merger fraction
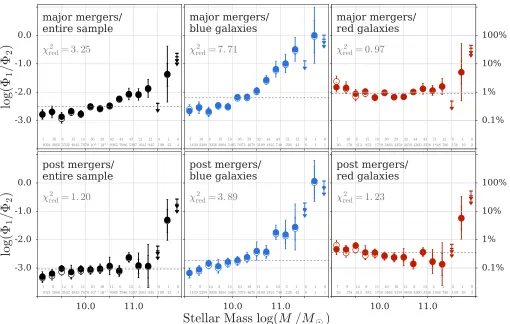
Having determined the stellar mass functions for major mergers and post mergers, we are able to constrain the merger and post merger fraction as a function of stellar mass. In the top panels of Fig.3we compare the number densities of major mergers to the entire galaxy sample, all blue galaxies and all red galaxies. The bottom panels illustrate the number density of post mergers relative to the entire galaxy sample, all blue galaxies and all red galaxies. At the bottom of each panel we give the number of objects in each mass bin which were used to compute the stellar mass functions. The top and the bottom row show the number of objects used for the numerator and the denominator, respectively.
We compare the major merger fraction relative to all galax-ies in our sample (top left-hand panel in Fig. 3) to the results byD10. D10report a major merger fraction that ranges be-tween 1.5−4.5%. This estimate is not based on the original major merger catalog, which we use for our analysis, but on an extended sample of ‘strongly perturbed’ galaxies in the local Universe.D10add expert visual assessments of galaxies with
fm<0.4 to derive the overall fraction of galaxies observed
in a major merger. Furthermore, D10introduce an absolute magnitude limit (Mr<−20.55) to construct a volume
com-plete sample. For our sample the number of major mergers relative to all galaxies ranges from 0−10% at a given stellar
TABLE 1
BEST-FITTINGSCHECHTER FUNCTION PARAMETERS
sample S D Nr. objects log(M∗/M) log(Φ∗/h3Mpc−3) α log(Φ∗2/h3Mpc−3) α2 χ2reduced
entire sample X 69289 10.79±0.01 −3.31±0.20 −1.69±0.10 −2.01±0.28 −0.79±0.04 9.78
blue X 32825 10.60±0.01 −2.43±0.01 −1.21±0.01 4.70
green X 13429 10.65±0.02 −3.95±0.23 −1.84±0.15 −2.54±0.33 −0.44±0.07 5.94 red X 26143 10.77±0.01 −6.73±0.79 −3.12±0.51 −2.21±1.12 −0.46±0.02 6.67
major mergers X 276 10.89±0.06 −4.30±0.03 −0.55±0.08 1.93
post mergers X 104 11.00±0.11 −5.01±0.09 −0.81±0.09 1.04
Early types & blue X 219 10.66±0.08 −4.47±0.06 −0.72±0.11 0.72 Early types & green X 735 10.75±0.05 −7.14±1.12 −2.95±0.71 −3.82±1.57 −0.46±0.16 0.74 Early types & red X 8035 10.74±0.01 −7.07±0.80 −3.09±0.57 −2.62±1.14 0.13±0.03 3.19 major mergers & log(δ+1)>0.05 X 216 10.77±0.08 −7.76±1.12 −2.99±0.70 −4.25±1.58 −0.14±0.23 1.36 major mergers & log(δ+1)≤0.05 X 68 10.90±0.16 −5.25±0.15 −0.92±0.13 1.06 mergers & satellites X 134 10.94±0.10 −4.70±0.07 −0.69±0.11 1.84 mergers & centrals X 161 10.90±0.08 −4.56±0.04 −0.53±0.10 2.22
NOTE. — We determine the parameters based on the parametric maximum likelihood approach (STY,Sandage et al. 1979) and give the 1σrandom errors which we compute directly from the STY MCMC chain. The second and third columns show if the subsample is better described by a single (S) or by a double (D) Schechter function according to the likelihood ratio test, which we use to compare the STY single and double Schechter likelihoods. The number of objects given in the fourth column corresponds to the number of galaxies above the mass completeness cut. Theχ2
reducedvalue given in the last column was derived by comparing
the non-parametric maximum likelihood values (SWML,Efstathiou et al. 1988) to the STY best-fitting Schechter function.
-3.0
-2.0
-1.0
0.0
lo
g(
Φ
1
/
Φ
2
)
7 10 8 15 18 36 29 32 44 43 21 12 0 1 0 1024 2066 3532 4942 7670 104.1104.19965 7986 5297 2641 945 190 23 4
major mergers/
entire sample
χ
2red
= 3
.
25
7 10 8 15 18 36 29 32 44 43 21 12 0 1 0 1439 2289 3036 3994 5465 5974 4678 3109 1825 740 226 42 6 1 1
major mergers/
blue galaxies
χ
2red
= 7
.
71
7 10 8 15 18 36 29 32 44 43 21 12 0 1 0 26 178 413 852 1719 3464 4358 4650 4360 3316 1848 780 158 19 2
major mergers/
red galaxies
χ
2red
= 0
.
97
10.0
11.0
-3.0
-2.0
-1.0
0.0
lo
g(
Φ
1
/
Φ
2
)
7 9 14 9 11 10 10 11 6 12 3 1 0 1 0 1024 2066 3532 4942 7670 104.1104.19965 7986 5297 2641 945 190 23 4
post mergers/
entire sample
χ
2red
= 1
.
20
10.0
11.0
Stellar Mass log(
M /M
¯)
7 9 14 9 11 10 10 11 6 12 3 1 0 1 0 1439 2289 3036 3994 5465 5974 4678 3109 1825 740 226 42 6 1 1
post mergers/
blue galaxies
χ
2red
= 3
.
89
10.0
11.0
7 9 14 9 11 10 10 11 6 12 3 1 0 1 0 26 178 413 852 1719 3464 4358 4650 4360 3316 1848 780 158 19 2
post mergers/
red galaxies
χ
2red
= 1
.
23
0.1%
1%
10%
100%
0.1%
1%
10%
100%
FIG. 3.— Merger fractions. The top panels show the number density of major mergers relative to the number density of all, all blue and all red galaxies. The bottom panels show the number of post mergers relative to the entire galaxy sample, all blue galaxies and all red galaxies. In analogy to Fig. 2, the open and filled markers show the fractions based on the 1/Vmaxand SWML results, respectively. Upper limits are computed using theΦvalues from both methods which is
why for some of the mass bins we show two upper limits. The grey dashed lines show the best-fitting relation for a constant fraction. The correspondingχ2 reduced
fraction of galaxies in a major merger relative to all galaxies is thus∼4% which is consistent with the results byD10.
Fig.3shows an increase in the major merger fraction rela-tive to all blue galaxies towards higher masses. A similar, but weaker trend can be seen for the number of major mergers rel-ative to the entire galaxy sample and relrel-ative to red galaxies.
For simulations this trend has been discussed by, for exam-ple,Bertone & Conselice(2009) andHopkins et al.(2010a,b).
Hopkins et al.(2010a,b) argue that while the halo merger frac-tion shows no strong halo mass dependence, it is the stellar mass to halo mass conversion (e.g.Behroozi et al. 2013) that introduces the stellar mass dependence in the galaxy merger fraction. At low halo masses, a 1:3 halo mass merger cor-responds to a minor galaxy merger since the stellar mass to halo mass relation is steep, i.e. a small halo mass range cor-responds to a wide stellar mass range. At high halo masses, even a minor halo mass merger corresponds to a major galaxy merger as the stellar mass to halo mass conversion is shallow, i.e. a wide range in halo mass corresponds to a small range in stellar mass. Compared to the halo major merger fraction, the galaxy major merger fraction is thus suppressed at low stellar masses and enhanced at high stellar masses.
Observational estimates of the merger fraction are method dependent (Lotz et al. 2011). Due to this, no clear consen-sus regarding the mass or luminosity dependence of the major merger fraction has been reached. For example,Casteels et al.
(2014) use morphological measurements based on concen-tration, asymmetry and clumpiness (CAS) to identify major mergers. They find a merger fraction that is consistent with being constant at stellar masses 9.5<log(M/M)<11.5. This is in agreement with the results ofXu et al.(2012) who find a constant pair fraction for the same mass range. At stel-lar masses below log(M/M) = 9.5Casteels et al.(2014) find an increased merger fraction.Domingue et al.(2009) andXu et al.(2004) find close pair fractions that are constant and in-crease with luminosity, respectively. Atz∼0.5Bundy et al.
(2009) find a pair fraction that increases as a function of stellar mass.
3.3. Mass and environment quenching
In the following section we compare the major merger stel-lar mass function to the predictions byP10. We first summa-rize the results byP10 and then discuss the implications of our measurements.
3.3.1. The empirical model
In their purely empirical modelP10consider three physi-cal processes that are likely to lead to quenching and predict the corresponding stellar mass functions. The following three processes are the quenching channels that they consider:
• mass quenching: Mass quenching is independent of the environment, but does depend on stellar mass. Mass quenched galaxies follow a single Schechter function. Compared to the mass function of blue galaxies, this Schechter function has the same M∗, but a shallower, more positive slopeα(Mmass∗ =Mblue∗ ,αmass=αblue+1).
Mass quenching could be associated with AGN feed-back (Silk & Rees 1998;Di Matteo et al. 2005; Schaw-inski et al. 2006;Kauffmann et al. 2007;Georgakakis et al. 2008; Hickox et al. 2009; Cattaneo et al. 2009;
Fabian 2012; Bongiorno et al. 2016;Smethurst et al. 2016) or secular processes (Kormendy & Kennicutt 2004;Masters et al. 2011;Cheung et al. 2013).
• satellite quenching: Satellite quenching is mass inde-pendent, but environment dependent. As the satel-lite quenching efficiency is mass independent, the stel-lar mass function of satellite quenched galaxies has the same single Schechter function shape as blue, star forming galaxies (Menv∗ =Mblue∗ ,αenv=αblue). Satellite
quenching could be associated with external processes such as ram pressure stripping (Gunn & Gott 1972) or strangulation (Larson et al. 1980;Balogh et al. 2000).
• merger quenching: Merger quenching has the same properties as satellite quenching. P10assume that the merger quenching efficiency is mass independent, but environment dependent. They thus predict the mass function of merger quenched galaxies to have the same shape as the mass function of satellite quenched galax-ies.
The sum of mass, satellite and merger quenched galax-ies makes up the red sequence and the combination of their respective single Schechter functions reproduces the double Schechter function that we observe for red galaxies (Mred∗ =
M∗blue,α1,red=αenv,α2,red=αmass). We illustrate the effect of
mass, satellite and merger quenching in Fig.4.
As merger and satellite quenching have the same proper-ties and result in the same stellar mass function shape, these two processes are often considered as one environment depen-dent quenching channel. P10argue that merger and satellite quenching are different manifestations of the same physical processes: a dark matter halo merger. If the baryonic galaxies merge we observe a merger quenched galaxy. If the baryonic galaxies do not merge we conclude that satellite quenching has occurred. We refer to these two processes as environment quenching.
An important part of the P10 model is the fact that the quenching channels can be disentangled based on their en-vironmental dependence. According to P10, satellite and merger quenching is dominant in overdense regions and mostly affects satellites. Mass quenching becomes apparent in underdense regions and mainly causes centrals to quench.
3.3.2. The observations
We now compare our major merger mass function to the predictions by P10. We not only consider the major merger mass function, but also split the major merger sample by en-vironmental density to compare to theP10predictions for dif-ferent environments.
We determine the mass function of major mergers in over-and in underdense regions (Weigel et al. 2016) and use the central/satellite classification byYang et al.(2007) to split the major merger sample into centrals and satellites. Note that this does not imply that we are generating the mass functions of major satellite - satellite or major central - central mergers. Instead, we determine if the galaxies which we are consider-ing in the construction of the major merger mass function are classified as a satellite or as a central (see Section2.3).
mass quenching satellite & merger quenching
mass function shape stays constant while transitioning green valley
all blue,
single all red, double
Mred⇤ =Mblue⇤
↵1,red=↵env
↵2,red=↵mass
satellite & merger quenched galaxies
mass
quenched galaxies
M⇤
env=Mblue⇤
↵env=↵blue
Mmass⇤ =Mblue⇤
↵mass=↵blue+ 1
mass independent environment independent
FIG. 4.— Schematic figure illustrating the phenomenological model byP10. In their modelP10use three different quenching mechanisms to explain the double Schechter shape of the stellar mass function of red galaxies.Mass quenching(bottom row) is a mass dependent, but environment independent process. The cause of mass quenching is most likely an internal process, such as AGN feedback (e.g.Fabian 2012) or secular processes (e.g.Masters et al. 2011). The probability of a galaxy being mass quenched increases as a function of its stellar mass.P10thus propose that when selecting blue galaxies that are in the process of being mass quenched, we will observe a stellar mass function that has the sameM∗as blue galaxies, but a shallower slopeα(M∗mass=Mblue∗ ,αmass=αblue+1). In the
P10modelsatelliteandmerger quenching(top row) are processes that are mass independent, but environment dependent. According toP10these processes are different manifestations of a dark matter halo merger. Galaxies that are being satellite or merger quenched have the shape of the blue, star forming mass function (Menv∗ =Mblue∗ ,αenv=αblue). Leading to the same mass function shapes, these effects can thus be summarized as one environmental quenching process. While
transition the green valley galaxies do not gain significant amounts of mass. The stellar mass functions hence retain their shapes. Mass, merger and satellite quenched galaxies make up the red sequence. The double Schechter shaped red mass function is the combination of the mass and environment quenched single Schechter mass functions (M∗red=Mblue∗ ,α1,red=αenv,α2,red=αmass).
rescale the predicted mass functions to match theΦ∗ of the subsample that we are considering.
First, let us consider the general major merger mass func-tion which is shown in the upper left-hand panel of Fig.5. Ac-cording to theP10model merger quenching is an environment dependent effect. The mass function of merger quenched galaxies should thus have the same shape as the blue mass function, indicated by the blue dotted line in Fig.5. Contrary to the prediction by P10, the observed major merger mass function is however consistent with the mass quenching mass function.
We find a similar inconsistency if we split the major merger sample by overdensity. The observed stellar mass functions for mergers in over- and underdense regions are shown in the upper middle and right-hand panels, respectively. The mass function of mergers in overdense regions neither resembles the mass nor the environment quenching mass function. In underdense regions, mass quenching effects should be domi-nant. Yet the observed merger mass function has anM∗that is too high to be consistent with the environment quenching mass function and is too flat to follow the mass quenching mass function.
The mass function of central major mergers, shown in the bottom right-hand panel, is the only case where our observa-tions match the expectaobserva-tions. As predicted, the mass func-tion of central major mergers is consistent with the mass quenching mass function. The mass function of satellite ma-jor mergers does however also resemble the mass quenching mass function, even though environmental quenching effects should dominate. This is shown in the middle panel at the bottom.
We conclude that our measurement of the major merger mass function is inconsistent with the empirical model by
P10. Besides the major merger mass functions, there are ad-ditional indicators of the P10 model being over simplified with respect to merger quenching. A fundamental assump-tion of the model is the fact that the mass funcassump-tions of red and blue galaxies have the sameM∗. However for our sample
M∗red−Mblue∗ ∼0.2 dex (see Table1,Weigel et al. 2016). Fur-thermore,P10assume a mass independent merger quenching efficiency. Contrary to this assumption, we find a mass depen-dent merger fraction, as we discussed in Section3.2and show in Fig. 3. P10also assume that the merger quenching effi-ciency increases as a function of environmental density. Yet in massive systems such as clusters, galaxies have high rel-ative velocities and the probability of mergers is expected to decrease (Ostriker 1980).
4. MAJOR MERGERS AS A QUENCHING MECHANISM
- MODEL
4.1. Assumptions and expectations
We now use the local major merger and post merger mass functions to investigate the process of major merger quench-ing. To do so we make the following straight forward assump-tions:
1. galaxies that are in the process of being major merger quenched evolve along the following sequence of stages which we refer to as the ‘merger quenching sequence’: major merger, post merger, blue early type, green early type, red early type;
2. the probability of galaxies evolving from the major merger to the red early type stage is mass independent;
10.0
11.0
-7.0
-6.0
-5.0
-4.0
-3.0
-2.0
lo
g
(
φ/
h
3
M
pc
−
3
de
x
−
1
)
major mergers
environment
quenching
prediction
mass quenching
prediction
major mergers
overdense regions
environment quenching
predicted to be dominant
major mergers
underdense regions
mass quenching
predicted to be dominant
10.0
11.0
Stellar Mass log(
M /M
¯)
-7.0
-6.0
-5.0
-4.0
-3.0
-2.0
lo
g
(
φ/
h
3
M
pc
−
3
de
x
−
1
)
satellite major mergers
environment quenching
predicted to be dominant
10.0
11.0
central major mergers
mass quenching
predicted to be dominant
FIG. 5.— Stellar mass functions for major mergers, major mergers in overdense and underdense regions and satellite and central major mergers. An important part of the empiricalP10model is the fact that mass and environment dependent quenching mechanisms can be disentangled by considering over- and underdense regions. Environment quenching is dominant in overdense regions and mostly affects satellites. Mass quenching becomes apparent in underdense regions and primarily quenches centrals. We split the major merger sample by density (Weigel et al. 2016) and into centrals and satellites (Yang et al. 2007) to test if the major merger mass function is consistent with theP10model. From top left to bottom right, we show the stellar mass functions of all major mergers, mergers in overdense and underdense regions and satellite and central major mergers. Overplotted in red and blue are the predictions for mass and environment quenching according to theP10model. To allow for an easier comparison the predicted mass functions are rescaled to have the sameΦ∗as the observed ones. In the P10model merger quenching is an environment dependent, but mass independent process. The observed mass function of all major mergers (top left-hand plot) should thus resemble the predicted environment quenching mass function (blue dotted line). Yet contrary to theP10prediction, the merger mass function shape is consistent with the mass quenching mass function. The shapes of the observed merger mass functions in over- and underdense regions neither match the predicted mass nor environment quenching mass functions. As predicted byP10, the observed mass function of central major mergers is consistent with the predicted mass quenching mass function. For satellite major mergers environmental quenching effects should be dominant. However the slopeαof the observed satellite major merger mass function is too shallow to be consistent with environment quenching. This figure thus illustrates that our observations of the merger quenching process in the local Universe are inconsistent with the empirical model byP10.
thereby retaining its mass distribution.
These assumptions imply that the stellar mass functions of major mergers, post mergers, blue early types, green early types and red early types are similar in shape. They allow us to investigate:
1. if major mergers are likely to lead to quenching,
2. the relative amount of time spent in stages along the merger quenching sequence,
3. and the significance of major merger quenching.
In the following section we motivate our assumptions. We discuss the merger quenching sequence and the order of its stages, the mass dependence of the major merger to red early type transition probability and the possible increase in stellar mass along the sequence. In Section5we apply these assump-tions to our sample and use them to investigate major merger quenching.
4.2. Major merger quenching stages and their order
We focus on mergers between gas-rich galaxies of compa-rable mass (mass ratio 1:3 and greater). According toToomre & Toomre(1972) these major mergers are capable of trans-forming disc galaxies into spheroids or ellipticals which has now also been shown and studied in various simulations (e.g.
Mihos & Hernquist 1996;Springel et al. 2005a; Di Matteo et al. 2005;Hopkins et al. 2006;Croton et al. 2006;Hopkins et al. 2008a,b;Khalatyan et al. 2008;Somerville et al. 2008). Furthermore, previous studies have investigated the evolution of merging galaxies both in terms of colour (e.g.Kaviraj et al. 2011) and SFR (e.g. Springel et al. 2005a; Hopkins et al. 2008b). Based on these studies we assume that galaxies which evolve along the classicalSanders et al.(1988) quenching se-quence are likely to pass through the following stages:
2010b) which contains visually classified merger sys-tems. These systems consist of at least two strongly perturbed, close-by galaxies. Disrupted tidal fields and dynamical friction drive the merging galaxies towards each other, violent relaxation re-arranges the stellar or-bits (Bournaud 2011).
2. post merger stage:After coalescence, only one nucleus remains and the galaxy is likely to have a disturbed morphology, it might for example be exhibiting tidal tails. Gravitational torques cause angular momentum loss and allow the gas to fall towards the center of the newly formed galaxy (Mihos & Hernquist 1996; Hern-quist 1989;Carpineti et al. 2012). The high central gas densities trigger a starburst and an AGN. Due to the large amounts of gas and dust the galaxy is classified as an ultraluminous infrared galaxy (ULIRG;Sanders & Mirabel 1996;Genzel et al. 2001).
3. blue early type stage:The galaxy has now lost its signs of a recent major merger (see discussion below) and appears to have an early type morphology. Kinetic and thermal feedback from the AGN and/or from su-pernovae expels or heats the gas in the galaxy, thereby quenching star formation (Kaviraj et al. 2007). This has been predicted theoretically (Di Matteo et al. 2005;
Springel et al. 2005b; Croton et al. 2006; Khalatyan et al. 2008;Somerville et al. 2008) and confirmed ob-servationally (Schawinski et al. 2006; Tremonti et al. 2007;Schawinski et al. 2007;Wong et al. 2015).
4. green early type stage:As the SFR declines, the galaxy transitions through the green valley. Showing signs of recent star formation, the galaxy is classified as a post-starburst galaxy (PSG/E+A/K+A; Bekki et al. 2001;
Goto 2005; Yamauchi et al. 2008; Wong et al. 2012). This stage can also be accompanied by AGN activity (Yan et al. 2006).
5. red early type stage: Once the remaining gas is con-sumed, the galaxy reddens and reaches the red sequence as a red early type galaxy.
The sequence that we set out above consists of dividing the entire galaxy sample both in terms of morphology and colour. First, we use visual morphologies to select major mergers, post mergers and early types. Second, we use the optical colour as a proxy for SFR to select early types in the blue cloud, green valley and red sequence. This allows us to trace the shut down of star formation in these merger remnants.
Along the sequence galaxies transition from the post-merger to the blue early type stage. We thus seem to assume that the change in morphology precedes the change in colour. This seems to imply that the dynamical or the relaxation time scale of merger remnants is shorter than the duration of their starbursts. Yet it is important to consider the data that we will be applying this model to. Specifically, the selection of early type galaxies has to be taken into account.
In Section5we will apply our assumptions to a sample of galaxies that have been classified by Galaxy Zoo users. Users were asked to classify galaxies according to their SDSS im-ages.Schawinski et al.(2010) use a sample of blue early type galaxies with SDSS classifications (Schawinski et al. 2007) to show that at least 50% of all blue early types show signs of a recent merger in co-added Stripe 82 images. These images
are approximately two magnitudes deeper than regular SDSS images. Similarly, van Dokkum (2005) uses deep imaging (∼28 mag arcsec−2) from the Multi-wavelength Survey by
Yale-Chile (MUSYC; Gawiser et al. 2006) and the NOAO Deep Wide-Field Survey (NDWFS;Jannuzi & Dey 1999) and finds that 53% of the nearby, red galaxies in the sample show signs of tidal interactions. When restricting the sample to bulge-dominated early type galaxies this fraction increases to 71%. We are thus not proposing that merger remnants have lost all signs of recent mergers and are fully relaxed by the time they leave the blue cloud. Instead we assume that the low surface brightness tidal features have faded and are no longer visible in the shallow SDSS images. Missing the signs of morphological disturbance, the still blue merger remnants are classified as early types.
We also note that AGN activity has been found to peak during different stages along the merger quenching sequence (Schawinski et al. 2010;Koss et al. 2010;Ellison et al. 2011;
Carpineti et al. 2012; Kaviraj et al. 2015; Carpineti et al. 2015). As we discussed above the definition of the post merger and blue early type stage depends on the specifics of the sample and the method used to select, for instance, post merger galaxies. It is thus difficult to directly compare pre-vious studies. In the sequence that we set out above, black holes increase their accretion rate during the post merger stage and provide the necessary feedback for a decrease in SFR in the blue early type stage. The result of AGN and star forma-tion feedback becomes apparent during the green early type stage, once the galaxy has significantly decreased its SFR. However, we cannot determine the exact time during the evo-lution at which galaxies have experienced sufficient feedback to quench their star formation.
4.3. Mass dependence of the transition probability
Below we discuss three processes that could cause the prob-ability of a galaxy to transition from a major merger to a red early type stage to be mass dependent. As stated above, we assume that these effects are negligible and do not introduce a significant mass dependence in the space density of galaxies that are being major merger quenched.
1. reforming of a disc: Simulations have shown that, un-like the sequence that we laid out above, a major merger between two spiral galaxies of comparable mass can also lead to the formation of a new spiral galaxy ( Hern-quist & Barnes 1991;Barnes & Hernquist 1996;Barnes 2002;Naab et al. 2006; Robertson & Bullock 2008). In most models the probability of reforming a disc de-pends on the gas fraction within the merging galaxies and the amount of stellar or AGN feedback during the merger. Other parameters such as the mass ratio of the merging galaxies, their orbital parameters and their mass distributions also affect the probability of regrow-ing a disc (see e.g. Hopkins et al. 2009). The high gas fractions that are necessary for a merger remnant to be able to regrow its disc are typically found in galaxies at
streams and efficient gas cooling.
Observationally the regrowing of a disc in a post merger galaxy has been observed in the local Universe (see e.g.
Hau et al. 2008; Kannappan et al. 2009; Salim et al. 2012; Moffett et al. 2012; Ueda et al. 2014; George 2017). Blue early type galaxies with signs of a disc seem to be primarily occur in low mass galaxies (e.g.
<3×10¹⁰M Kannappan et al. 2009). Compared to more massive galaxies, the regrowing of a disc after a major merger event in lower mass galaxies could be promoted by higher gas fractions (Catinella et al. 2010).
The regrowing of a disc after a major merger event is hence theoretically possible and has been observed for a small sample of local galaxies. Yet the significance of this effect on the mass dependence of the merger quenching probability remains unclear. Robust to a mild mass dependence, the mass functions of galaxies along the merger quenching sequence would however only be affected if this is a strongly mass dependent effect. For instance, if 109M galaxies are more than 50% more likely to regrow a disc than M∗ galaxies, the resulting difference in the space densities at these masses would affect theαof the resulting mass func-tion. We make the simplified assumption that such an extreme effect is unlikely and neglect the process of disc reforming on the transition probability.
2. AGN feedback: AGN feedback is necessary to effi-ciently quench a merger remnant (Springel et al. 2005a;
Birnboim et al. 2007; Khalatyan et al. 2008;Hopkins et al. 2008b). Without AGN feedback a merger rem-nant can return to being a star forming late type (Sparre & Springel 2016). Furthermore, AGN feedback has to be introduced to explain the high gas depletion rate and the rapid early type evolution (Schawinski et al. 2014;
Smethurst et al. 2016) from blue to red (Kaviraj et al. 2011). Recent work has shown that observed AGN lu-minosity functions are consistent with a mass indepen-dent AGN fraction and accretion rate distribution (Aird et al. 2012, Weigel et al. 2017 in prep.). We thus as-sume that the probability of a merger remnant being af-fected by sufficient AGN feedback to transition to the red sequence is mass independent.
3. dynamical friction: Chandrasekhar(1943) introduced the concept of dynamical friction being mass depen-dent. More recently,Jiang et al.(2008) (also seeJiang et al. (2010)) have shown that the resulting mass de-pendence of the merger time scale is best expressed asT∝Mprimary/(Msecondary×ln(1+Mprimary/Msecondary)).
Here Mprimary andMsecondary refer to the more massive
and less massive merging partner, respectively. Given our major merger definition this causes up to a factor of 1.5 difference in the merging time scale of merging sys-tems depending on their mass ratio. Jiang et al.(2008) consider the time between the secondary first crossing the dark matter virial radius of the primary and the the beginning of the coalescence as their merging time. We assume that the galaxies in theD10sample, which show clear signs of interaction, are close to coalescence and neglect the mass ratio and thus mass dependence of dy-namical friction.
4. fading of merger features: As we discussed above, we assume that the post merger stage is followed by the blue early type stage, as for most galaxies the signs of a recent merger will have faded enough to no longer be detected in the shallow SDSS images. We assume that there is no mass dependence in the time scale over which these tidal features fade. There might be galaxies for which the signs of a recent merger fade less quickly and which might be classified as post mergers instead of, for instance, green early types. However, if mass independent, this effect does not introduce a bias in the space density of galaxies which we observe along the merger quenching sequence.
4.4. Mass increase along the quenching sequence
During their evolution from blue to red merger quenched galaxies can gain stellar mass through three different chan-nels:
1. through star formation: while transitioning from the blue cloud to the red sequence, a galaxy retains low levels of SFR. However even if a galaxy would keep its pre-quenching SFR, the amount of gained stellar mass would be negligible compared to the galaxy’s already existing stellar mass. For example, a M∗ galaxy of 1010.8M
(Weigel et al. 2016) has a SFR of∼5M/yr (Lilly et al. 2013) if it is on the main sequence. For a constant SFR, this galaxy will increase its stellar mass by a factor of 1.4 within 5 Gyr. So, even if the SFR were to stay constant during the transition from blue to red, the galaxy would only increase its stellar mass by 0.1 dex if the transition takes∼5 Gyr.
2. through a starburst during the ULIRG phase: as we mentioned above, a major merger quenched galaxy is likely to experience a starburst while transitioning from blue to red. Yet similar to the argument in the first point, the galaxy will not gain significant amounts of stellar mass during the starburst phase (see e.g. Genzel et al. 1998;Carpineti et al. 2015).Di Matteo et al.(2008), for instance, find that strong starbursts are rare in the local Universe and that a merger triggered starburst results in a SFR that is enhanced by less than a factor of five. They also find a typical starburst duration of the order of 108yr. For aM∗ galaxy on the main sequence this implies a<0.02 dex increase in stellar mass.
3. through the mass of the merging partner: through merging, a galaxy can increase its stellar mass by 0.3 dex at most. Assume we consider the blue spiral galaxy
M1 in our major merger mass function construction.
The galaxyM1 is merging with,M2, must haveM2≤
M1, otherwise we would have considered M2 when
determining the stellar mass function. M1’s mass
in-creases by 0.3 dex ifM1=M2. Mergers with low mass
ratios are more common than mergers between galax-ies of comparable mass (Kaviraj 2014). The number of galaxies that double their stellar mass, i.e. increase their mass by 0.3 dex, is thus likely to be low.
spend the same amount of time in each stage and if all galax-ies transition from one stage to the next. The mass function of the blue, still star forming galaxies has a different normal-ization since galaxies spend a certain amount of time in this stage before the cessation of their star formation. The same is true for the mass function of the red and dead galaxies since this is the end stage and galaxies will accumulate here. The shape of the red mass function is the same as that of the tran-sitioning objects, if the quenching process we are considering is the only way to build up a red galaxy and there are no other quenching channels. If galaxies spend less time in a certain stage or only a fraction of galaxies has transitioned from the previous stage,Φ∗ of this stage decreases. The shape of the mass function of one of the phases changes if the transition from the previous stage is mass dependent and for example more efficient at higher stellar masses.
5. MAJOR MERGERS AS A QUENCHING MECHANISM
- ANALYSIS
Based on the assumptions that we introduced in the pre-vious section, we now investigate the effect of quenching through major mergers in the local Universe. We intro-duce the stellar mass functions of galaxies along the merger quenching sequence and test if they are similar in shape. We then use these stellar mass functions to estimate the rela-tive amount of time that galaxies spent in stages along the sequence. To determine the significance of major merger quenching we introduce four tests which vary in their level of sophistication and assumptions. First, we compare the shapes of the major merger and the red early type mass functions. Second, we compare the major merger to the mass function of all green galaxies. Third, we estimate the contribution of ma-jor merger quenched galaxies to the green valley flux. Fourth, we simulate the evolution of the red stellar mass function and determine the fraction of galaxies that are likely to have been major merger quenched within the last 5 Gyr. We end this section by summarizing our results regarding the significance of major merger quenching.
5.1. Major merger quenching sequence mass functions
Besides the stellar mass functions of major merger and post mergers, which we introduced in Section3.1, we also deter-mine the mass functions of blue early types, green early types and red early types. Fig.6summarizes the stellar mass func-tions of all five merger quenching sequence stages. For com-parison, we also show the stellar mass function of the entire galaxy sample in grey. In analogy to Fig.2, open (1/Vmax) and
filled (SWML) symbols and solid lines (STY) show the results of different stellar mass function estimators. For 1/Vmax and
SWML we show upper limits in stellar mass bins that do not contain any sources. The best-fitting STY Schechter function parameters and their errors are given in Table1. Fig. 7 sum-marizes and illustrates the major merger quenching sequence. As we have discussed above, based on our assumptions, we expect the stellar mass functions of galaxies along the quench-ing sequence to have similar shapes if none of the transitions is mass dependent. To test if this is the case for the mass functions that we are considering here and to make a possible mass dependence more apparent, we take the ratio between mass functions of consecutive steps along the quenching se-quence. We refer to these ratios as ‘transition curves’ and illustrate them in Fig.8.
From top left to bottom right we show the transition curves for the major merger to post merger, the post merger to blue
early type, the blue early type to green early type and the green early type to red early type stages. For stellar mass functions of similar shapes these transition curves are flat. Their normalization corresponds to the fraction of galaxies transitioning from one phase to the next, if we assume that the galaxies spend the same amount of time in each stage.
To quantify the flatness of the transition curves we compute
χ2
reducedvalues for constant fractions. Theχ 2
reducedvalues are
given within Fig. 8. Note that for the χ2
reduced computation
we use the SWML data points and we do not take upper and lower limits into account. Based on theχ2
reducedvalues, Fig.8
shows that the transition curves of most stages are consistent with being flat, only the evolution from the green to the red early type stage shows a significant mass dependence.
According to the STY method and the likelihood ratio test, the green early type and the red early type mass functions are well described by double Schechter functions. Compared to the green early types, the red early types are however fit by a stronger double Schechter with higher log(Φ∗
2/Φ∗1) andα2
values (see Fig.6and Table1). The red early types thus have a higher number density at high stellar masses which causes the strong mass dependence that we see in the bottom left panel of Fig. 8. We discuss the implications of the green and the red early types having significantly different mass functions in more detail in Section5.3.
We conclude that except for the evolution of green to red early types, the transition curves are consistent with being flat. We thus infer that the galaxies that we find in these different phases today are likely to evolve along a sequence. This se-quence bridges from the blue cloud to the red sese-quence and does not include a significant mass dependence. Hence, ma-jor mergers are likely to lead to quenching for a mama-jority of galaxies that are involved in a gas rich merging event.
Our expectation of similar mass function shapes for galax-ies along the merger quenching sequence is based on the assumption of a mass independent merger-to-red-early-type transition probability. As we argued in Section4.3, we as-sume that the effects of disc reforming, AGN feedback, dy-namical friction and fading of merger features do not intro-duce a significant mass dependence in the probability of a merger remnant reaching the red sequence. Implicitly we also assume that the stellar mass measurements of major mergers and post mergers and their visual classifications are unbiased. The transition curves of galaxies along the merger quenching sequence being flat thus either implies that our assumptions are justified or that two or multiple effects compensate their respective mass dependence.
If there are, for instance, two mass dependent mechanisms which have an opposite effect on the space density of merger quenched galaxies, than they have to both affect the same