© 2019, IRJET | Impact Factor value: 7.211 | ISO 9001:2008 Certified Journal
| Page 1642
Removal of Gaussian Impulsive Noise from Computed Tomography
Sanjay M N
1, Nidhi V Aradhya
2, Thejaswini M B
3, Meghana G R
4, Prof. Harish Kunder
51,2,3,4
Student, Dept of CSE, AIET
5
Associate Professor, Dept of CSE, AIET
---***---Abstract -
Computed tomography images can becorrupted by noises like Gaussian and impulsive noise during which causes reduction of quality. So removing the noise from the image is very important in medical image processing. Mean and median filters which are present now are not very efficient in removing impulse and Gaussian noise. Thus, in this paper, a new filter is proposed which removes mixed noise such as Gaussian and impulse noise. Based on existence of noises in their small neighbourhood, pixels of image are separated into non-corrupted pixels and corrupted pixels. For non-corrupted pixels, greyscale value is taken as output and for corrupted pixels removing noises are done base on their characteristics. The proposed filter eliminates these noises of varying density
1. INTRODUCTION
Noise is a unwanted disturbance that is produced in a CT scan image. Denoising means removal of noise from a image and hence it increases image quality. Different noise has its own attribute and it affects the method of image denoising. There are different types of noises. Some CT scan image contain Gaussian noise or some contain impulsive noise or some may contain its combination.
Gaussian Noise damage CT scan image which complicates further image analysis. It is statistical type of noise. The probability density function is same as normal
distribution which is also called Gaussian distribution. Poor illumination, high temperature, transmission can be the sources of Gaussian noise in CT scan images. This noise is created while film exposure and image development. There is Gaussian random noise, in case of thermal motion, when electrical variation meet Gaussian distribution. The probability density function ‘p’ is given by:
……… (1.1)
Where ‘z’ represents the grey level, ‘μ’ represents the mean value and ‘σ’ represents the standard deviation.
Gaussian noise has random and normal distribution of instantaneous amplitudes over time. Impulsive noise is autonomous and uncorrelated to image pixels. It is randomly dispersed over CT image and it is short duration noise. It is immersed during image acquisition because of switching or atmospheric disturbances or interference of channel while image transmission. Impulsive noise is always independent. With impulsive noise, only certain
pixels of CT image will be affected. There are different types of impulsive noises such as Salt and pepper impulsive noise and Random Valued Noise.
The salt and pepper noise take either salt value or the pepper value whose grey level can be either -225 or -0. It also contains black and white spots. If the total density of image is ‘p’ then the salt and pepper noise density will be ‘p/2.
………(1.2)
Where 𝑦𝑖𝑗 represents the noisy image pixels, 𝑝 is the total noise density of the impulsive noise and 𝑥𝑖𝑗 is the uncorrupted image pixels. At any point of time the image densities of salt and pepper type of impulsive noise are different i.e. p1and p2. Hence the total noise density of the salt and pepper noise is calculated as:
𝑝 = 𝑝1 + 𝑝2 ………….………..……..(1.3)
The random valued impulsive noise can take grey value between 0 and 255. The noise is randomly distributed over the entire image and the probability of its occurrence is same as noise. The random valued impulsive noise can be mathematically represented as follows:
………(1.4)
Where 𝑛𝑖𝑗 is the grey level of the noisy pixel.
© 2019, IRJET | Impact Factor value: 7.211 | ISO 9001:2008 Certified Journal
| Page 1643
Noise in an image may be due to transmission andacquisition or due to some hardware issues. Amount of noise present in an image can be calculated by checking number of pixels corrupted. Noises in CT image can be divided as amplifiers or Gaussian noise, salt and pepper noise, shot noise or Poisson noise and Speckle Noise.
2. LITERATURE SURVEY
Many literature reviews has proposed different procedures for removing noise from the CT scan image. Ehsan Lotfi [1] proposed a novel approach for removing Gaussian noise using adaptive Fuzzy filter and Image histograms. Major drawback of this is it takes longer time for execution.
Gnanambal Ilango et. Al. [2] have proposed a hybrid filtering technique for the removal of Gaussian noise using topological approach. In this, three filters are used. Drawback of this will be it requires longer processing time due to presence of three filters.
Dmitri Van De Ville et. Al [3] has proposed a new fuzzy filter for images affected by additive noise. Drawback of this will be, for low noise levels which contain fine textures, this will not give satisfactory results.
Stephen M. Schmitt et. Al [4] have proposed a method to predict the noise properties of iteratively reconstructed CT image. But the drawback is its noise removal prediction was not satisfying from the edges.
Zhiqian Chang et. Al [5] have proposed Local Linear Minimum Mean Squared Error (LLMMSE) Filter and Point wise Bayesian Restoration for extracting the image details for Model Based Iterative Reconstruction (MBIR) method based images. Drawback of this will be it does not give satisfactory results as image noise reconstruction was done on negative territory.
Xue Ying Cui et. Al. [6] Have proposed learning based artifact removal by fragmenting the image into low frequency and high frequency parts. Based on the dictionary learning, the image is strengthened by removing noise and artifacts. Drawback of this is it will not remove the noise in the tissue structures.
Jun Feng Zhang et. Al. [7] have proposed improved non local means (INLM) method by calculating weight map from the pre-processed one for removing streak artifact and noise. But this is not efficient and simple as neighbour patches can contain other types of noise and the low dose protocol below 50mA has not been tested for succession.
L.L Chen et. Al [8]. Have proposed improved block matching and 3D filtering which is based on the context to reduce noise from low dose CT image. Drawback is it will not preserve minute details such as the tissue and features at the edges.
Changyan Xiao et. Al. [9] have proposed a novel filter for removing pulmonary fissure called as the Derivative of Stick Filter which can be used for denoising and post processing of CT image. Drawback of this is, accessory and planar cutters cannot be removed as their volumes look similar to the lobar fissures.
3. PROPOSED METHODOLOGY
As noise is unavoidable in image, main objective of this paper is to remove noise. Since high dose is not advisable as it is harmful, low dose is recommended. And to remove that noise produced by low dose, noise removal algorithm has been designed. As CT scan image contain both Gaussian and Impulsive noise, removal of both types of noise can be difficult. The algorithm proposed here can remove both Gaussian and impulsive noise spread across various regions of the image. The Hybrid filter proposed can remove mixed noise of Gaussian and impulsive noise. Initially image generated by low dose will contain noise. Then, before removing the noise, parameters like image density should be pre-processed. Based on type of noise, image is categorized into different regions and each region of the image is processed separately. The Gaussian distribution is calculated and using that Gaussian Smoothing is done along with the median filter which considers the Gaussian distribution and the median is calculated and the noise is removed. Then, each region of the image is reconstructed using the pre-processed image details and the final step is to enhance the image quality for further diagnosis and processing.
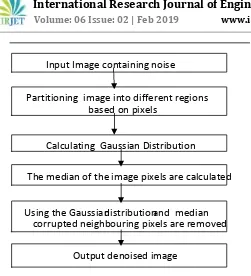
Algorithm1: Hybrid Algorithm for removing Gaussian and Impulsive Noise.
Input: The low dose CT scan image containing noise. Output: The denoised high quality CT scan image. Step 1: The input image is partitioned into different regions based on the image density.
Step 2: The Gaussian distribution is calculated by
………..(3.1)
Step 3: The median of the image pixels are calculated by ……….… (3.2)
Step 4: Using the Gaussian distribution and the median of the pixel, the neighbour pixels are analysed and the noisy and corrupted pixels are removed
© 2019, IRJET | Impact Factor value: 7.211 | ISO 9001:2008 Certified Journal
| Page 1644
Algorithm2: Mixed noise removal by WESNRInput : Dictionary ø, noise image y; Initialize e and W;
Initialize µto 0.
Output : Denoised image x. Loop : Iterate on k=1,2…. K;
1. Compute α(k)
2. Compute x(k) = øa(k) and update the non-local coding
vector µ;
3. Comute the residual e(k) = y-x(k);
4: Calculate the weights W by e(k)
END
Output the denoised image x = øα(k)
Algorithm 2 depicts when dictionary ø is noted for a patch, problem can be solved by iteratively updating W and α which depends on coding residual e. e can be initialized as:
e(0) = y-x(0) ……….……(3.3)
4. RESULT AND DISCUSSION
[image:3.595.24.554.32.797.2]Obtained images were denoised and smoothed. The algorithm removed noise from the CT image. The regions which had noise were smoothed and hence image details were enhanced. The denoised image shows that the edges are being preserved. The Peak Signal to Noise Ratio (PSNR) was improved with proposed algorithm. And Higher this ratio, image will be more denoised, and hence quality of the image will be high. The following images shows the denoising methodology where Image 1(a) contains noise in the image and Image. 1(b) do not contain noise and has been smoothed. Ten CT scan images are considered for denoising and the PSNR values have been provided in the Table 1 and Table 2.
Image 1(a): Original image
Image 1(b): Denoised image
Image 2(a): Original image
Image 2(b): Denoised image
Fig
1:
Proposed Algorithm
Input Image containing noise
Partitioning image into different regions
based on pixels
Calculating Gaussian Distribution
The median of the image pixels are calculated
Using the Gaussian
distribution
and median
corrupted neighbouring pixels are removed
[image:3.595.38.289.51.327.2]
© 2019, IRJET | Impact Factor value: 7.211 | ISO 9001:2008 Certified Journal
| Page 1645
Image 3(a): Original imageImage 3(b): Denoised image
Image 4(a): Original image
Image 4(b): Denoised image
Image 5(a): Original image
Image 5(b): Denoised image
Image 6(a): Original image
Image 6(b): Denoised image
Image 7(a): Original image
Image 7(b): Denoised image
© 2019, IRJET | Impact Factor value: 7.211 | ISO 9001:2008 Certified Journal
| Page 1646
Image 8(a): Denoised imageImage 9(a): Original image
Image 9(b): Denoised image
Image 10(b): Denoised image
[image:5.595.302.565.128.575.2]
Table 1: COMPARISON BETWEEN THE PSNR VALUES OF ORIGINAL IMAGE AND THE DENOISED IMAGE
GRAPH FOR COMPARING PSNR VALUES OF GAUSSIAN FILTER, MEDIAN FILTER AND THE PROPOSED
ALGORITHM
From the graphs shown above, the proposed denoising algorithm has higher PSNR values. Hence, images are more denoised and the quality of the image increases. This shows that the proposed algorithm works well and produces good quality images
Sl.no.
Image for
analysis
PSNR
(Original)
PSNR after
denoising
1
Image 1(a)
21.867
30.609
2
Image 2(a)
21.5
33.16
3
Image 3(a)
21.62
35.44
4
Image 4(a)
21.66
42.044
5
Image 5(a)
21.59
37.62
6
Image 6(a)
20.91
34.63
7
Image 7(a)
20.24
36.036
8
Image 8(a)
15.36
34.448
9
Image 9(a)
21.0619
35.327
10
Image 10(a)
21.353
30.9
© 2019, IRJET | Impact Factor value: 7.211 | ISO 9001:2008 Certified Journal
| Page 1647
4. CONCLUSION
IRJET sample template format ,Conclusion content comes here. Conclusion content comes here Conclusion content comes here Conclusion content comes here Conclusion content comes here Conclusion content comes here Conclusion content comes here Conclusion content comes here Conclusion content comes here Conclusion content comes here Conclusion content comes here Conclusion content comes here Conclusion content comes here . Conclusion content comes here
REFERENCES
[1] Ehsan Lotfi, “An Adaptive Fuzzy Filter for Gaussian Noise Reduction using Image Histogram Estimation”, Advances in Digital Multimedia (ADMM), Vol 1, No. $, Pages 190-193, 2013.
[2] Gnanambal Ilango, R Marudhachalam, “New Hybrid Filtering Technique for Removal of Gaussian Noise from Medical Images”, APRN Journal of Engineering and Applied Sciences, Vol 6, No. 2, February 2011
[3] Dmitri Van De Ville, Mike Nachteguel, Dietrich Van der weken, Etienne E Kerre, Wilfred Phillips, “ Noise Reduction by Fuzzy Image Filtering”, IEEE Transactions on Fuzzy System, Vol 11, No. 4, August 2003
[4] Stephen M.Schmitt, Mitchell M Goodsitt, Jeffrey F Fessler, Fast Variance Prediction for Iteratively Reconstructed CT Image, with Locally Quadratic Regularization, IEEE transactions on medical imaging,
vol. 36, no. 1, January 2017, pages 17-26.
[5] Zhiqian Chang, Ruoqiao Zhang, Jean-Baptist Thibault, Debashish Pal, Lin Fu, Ken Sauer, Charles Bouman, “Modeling and Pre-Treatment of Photon-Starved CT Data for Iterative Reconstruction, IEEE Transactions on Medical Imaging, Vol 36, No. 1, January 2017, pages 277-287.
[6] Xue-Ying Cui, Zhi-Guo Gui, Quan Zhang, Hong
Shangguan, and An-Hong Wang, ‘Learning-Based Artifact Removal via Image Decomposition for Low-Dose CT Image Processing”, IEEE transactions on nuclear science, vol. 63, no. 3, June 2016, pages 1860-1873.