© 2019, IRJET | Impact Factor value: 7.211 | ISO 9001:2008 Certified Journal
| Page 4687
A statistical approach towards energy saving in cloud
computing
Anushree chausalkar
Assistant Professor Computer Science Engineering. , ITMGOI Gwalior, India
---
Abstract : Due to the budget and the environmental issues,
achieving energy efficiency gradually receives a lot of attentions these days. In our previous research, a prediction technique has been developed to improve the monitoring statistics. In this research, by adopting the predictive monitoring information, our new proposal can per-form the optimization to solve the energy issue of cloud computing. Actually, the optimization technique, which is convex optimization, is coupled with the proposed prediction method to produce a near-optimal set of hosting physical machines. After that, a corresponding migrating instruction can be created eventually. Based on this instruction, the cloud orchestrator can suitably relocate virtual machines to a designed subset of infrastructure. Subsequently, the idle physical servers can be turned off in an appropriate manner to save the power as well as maintain the system performance. For the purpose of evaluation, an experiment is conducted based on 29-day period of Google traces. By utilizing this evaluation, the proposed approach shows the potential to significantly reduce the power consumption without affecting the quality of services.
CCS CONCEPTS
• Computing methodologies → Supervised learning by regression; • Computer systems organization → Cloud computing; • Mathematics of computing → Stochastic processes;
KEYWORDS
IaaS, Cloud Computing, Predictive Analysis, Convex Optimization, Energy Efficiency, VMs, Gaussian process regression
1 INTRODUCTION
In recent years, a number of data centre recognized cloud computing as a popular platform to manage most of the operations. Naturally, cloud computing improves utilization and scalability of underlying physical infrastructure. As a substitution for independently allocating the computing
facilities when being requested, cloud computing is able to deliver the ordered resource as a virtual package conveniently via internet connection. Besides, it is worth noting that cloud computing can be used to enhance the utilization of the infrastructure by virtualizing the service composition in a higher level. Hence, the capacity of the physical facilities can be unified to provide better quality of services. Finally, implementing cloud computing can lessen the management cost to consequently save the money.
© 2019, IRJET | Impact Factor value: 7.211 | ISO 9001:2008 Certified Journal
| Page 4688
2 RELATED WORKSEnergy efficiency in cloud computing is mostly related to VM consolidation philosophy. It means that the problem of interest focuses on choosing the suitable placement for VMs with regards to the utilization of PMs [3]. Basically, we can model the VMs and PMs as a regular object-bin problem. Hence, the VM consolidation can be simplified to bin-packing problem, which is NP-hard [1]. Consequently, the heuristics-oriented techniques might be the promising solutions. Whereby, some well-known approaches popularly adopt this methodology, namely best fit decreasing [1] and first fit decreasing [5]. By engaging these techniques, the cloud orchestrator has a tendency to assign VMs to minimize the number of hosting PMs. Due to this attractive feature, the mentioned bin-packing model is widely used to generate the solution to deal with the energy efficiency. However, heuristics approaches have a critical drawback when implementing in action. In order to produce good solution, this family requires the fixed number of objects and bins at the beginning of time. In other words, the quantity of VMs and PMs must be recognized in advance. Apparently, this requirement is unfeasible since it breaks the principles that make cloud computing, which are the elasticity and the multi-tenancy. In addition, the rapid changes in infrastructure’s utilization clearly degrade bin-packing approaches in term of accuracy. Because of that, this issue eventually casts bad effects on system performance.
In order to breakthrough the mentioned obstacle, other approaches utilize the prediction techniques as a preprocessing step to enhance the input data. By predicting the infrastructure’s workload, the cloud orchestrator can produce more reasonable decision to lessen only unexpected effect of utilization fluctuation. There would be a number of research take into account this method to their proposals. The candidates for prediction algorithms are various from hidden Markov model [8] to polynomial fitting [16]. Unfortunately, these authors do not pay enough attention to the designed philosophy of versatile resource provision in cloud computing. Therefore, these techniques, might not provide good prospect of underlying system to the orchestrator. Besides, there is another research trying to utilize the Wiener filter [7] to predict the workload. However, to the best of our knowledge, Wiener filter performs properly only with the stationary signal and noise spectrum. Bringing signal processing technique to the cloud computing domain without a rigorous analysis might not be a good idea. Due to this reason, Wiener filter might be inapplicable for prediction purpose in the domain of interest.
Furthermore, one different kind of approaches that should be included is the modified specific schedulers in [6], [14] and [2]. These schedulers are the efforts to solve other aspects of energy efficiency in network traffic, resource reconfiguration and communication rates. By proposing these schedulers, the authors claim that they can optimize the network throughput as well as balance the resource utilization, eventually save the energy. However, these research do not consider the importance of system performance preservation. Therefore, the referred schedulers are unable to implemented in service providing systems.
By investigating the research area, a conclusion can be made that even though the energy efficiency is a hot topic in computer engineering these days, not enough research has comprehensively been successful in equating the energy savings with an acceptable performance, especially in a predictive and optimized manner. Be-cause of that, we would like to propose a solution which engages our previous prediction method [4] and convex optimization tech-nique to reduce the energy consumption in cloud computing. The rest of the proposal is described in the next sections.
3 PROPOSED ARCHITECTURE 3.1
System description
© 2019, IRJET | Impact Factor value: 7.211 | ISO 9001:2008 Certified Journal
| Page 4689
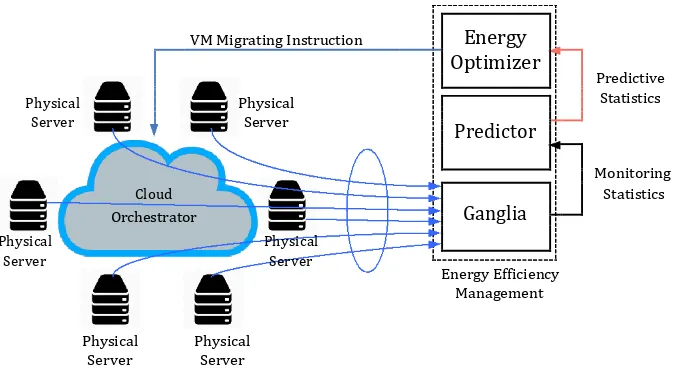
Figure 1. The main target of this architecture is to optimally create VMs consolidation strategy and send it to the orchestrator periodically. Finally, the idle PMs are temporarily deactivated to reduce power consumption. Following is the functionality of each component in the architecture:
• Ganglia: this component collects most of operation statistics for both PMs and VMs. The collected information is actually used as the input for the prediction step in the next stage. Note that Ganglia is known to be trusted platform for years for monitoring purposes. This component is light-weight but powerful and versatile enough to integrate to any solution. • Predictor: this component is the data sink for Ganglia’s
statistics. After receiving the aforementioned data, the enhanced Gaussian process regression is activated to do the prediction step. The output of this step is the predictive monitoring statistics. In other words, the predictor provides the futuristic perspective of the working status of infrastructure. This kind of anticipated system utilization is more valuable for the optimization step than the original data.
• Energyoptimizer: the predictive monitoring statistics,
© 2019, IRJET | Impact Factor value: 7.211 | ISO 9001:2008 Certified Journal
| Page 4690
VM Migrating Instruction Energy
Optimizer
Predictive
Physical
Physical Statistics
Server Server Predictor
Cloud
Monitoring
Ganglia Statistics
Orchestrator
Physical Physical
Server Server
Energy Efficiency
Management
Physical Physical
[image:4.612.121.459.98.289.2]
Server Server
Figure 1: Architecture of energy efficiency management (E2M) system.
VMs. Finally, the complete package of VM consolidation is delivered to the cloud orchestrator for implementation.
3.2 Prediction model
As mentioned above, the migrating instruction would be created in the energy optimizer component. Before the optimization procedure can be issued, it is mandatory to enhance the monitoring data in advance. The reason for the need of this enhancement is twofold. Firstly, it is known to be true that the monitoring statistics is always the delayed information. It means that the data we has received at the time t actually reflects the system status at the time t − τ , in which, τ is the monitoring window that triggers the data collecting process. Any decision making based on this obsolete data might not be reasonable at the time the reaction is executed. Considering this fact, there is obviously a requirement for data prediction. The second reason is that sometimes it is better to apply proactive reaction rather than reactive model. In that case, there would be higher chance for the orchestrator to reduce the violation to quality of services in advance. Regularly, the target of the predictor is to provide the futuristic utilization of resources to the optimizer. In order to do that, the Bayesian learning and the Gaussian process regression are chosen to make the regression. The guidance on how to build this prediction model is provided in detail in our preceding research [4].
4 ENERGY OPTIMIZATION
Coming to this step, we assume that the energy optimizer receives enough information from the predictor, it is right time to conduct the optimization for power consumption. As said previously, a minimum-but-feasible number of PMs is required as the output of this stage. Note that the output is subsequently used to con-struct the instruction for VM migration. Primarily, there are two sub-components in the energy optimizer, namely power manage-ment and cluster optimizer. The power management observes the
resource pool and incorporates the energy decision that has been made from the cluster optimizer. The final decision can be referred to as the instruction for VM migration. This instruction is sent to the cloud orchestrator to actuate.
4.1 Performance modeling
Since CPU is one of the most sensitive parameters, this factor should be
chosen to model the performance. Denote the global utilization as Umfi ∈
R+ and the individual utilization as Imfi ∈ R+ regarding the resource fi (For
instance, fc stands for CPU). The number of active PMs, which is denoted by am at the monitoring window m, are the target to calculate. It is crucial to mention that consolidating the VMs into a number am of PMs might result the infrastructure to its peak performance. Hence, this procedure needs to be controlled. Otherwise, the whole sys-tem might suffer very high latency [15] and violate the quality of services, which is described in the service level agreement (SLA) document. Therefore, the utilization of CPU resource should be formulated as follows:
Im = max{Imfc } = max{
U
fc
m
}. (1)
amCfc
fc fc
Observing (1), Im is known to be a decreasing function of am . In other words, decreasing the number of PMs might cast high latency to entire system. Denote the average latency of task processing in CPUs as lm . This parameter can be computed by engaging the expectation waiting time E(fc ) of the exhausted CPU:
l I = fc
)
= λm 1/µ2, (2)
m ( m ) E(
2(1 −Λ 1µ
m / )
© 2019, IRJET | Impact Factor value: 7.211 | ISO 9001:2008 Certified Journal
| Page 4691
cost Cmp needs to be calculated as follows:
Cmp = wmsp (lm (Im ) − l)+, (3)
in which, wm and sp stand for the weight factor that reflects the
magnitude of violation, and the fine that needs to be paid for the
penalty, respectively. The weight factor wm is also supposed to
extinguish the trend of the average latency increment. In other words, this parameter flexibly allows a controlled number of under-performance PMs as a preventive method for reducing system overhead. Essentially, this weight plays the role of preserving the SLA execution.
4.2 Energy modeling
As we all know that the power consumption in running clusters can be broken down to two periods: the period of processing the assigned tasks and the period of maintaining the idle state. This fact can be modeled by using following equation:
em
=
Pidl e+
Pr unninд . (4)Assume that sm stands for the fine of electricity at monitoring
window m, the power expense, denoted by Cme , is represented as
follows:
Cme (am ) = smamem = smam (Pidl e + Pr unninд ). (5)
In (5), the energy, which is used for processing the tasks, is
un-touchable. As a result, the represented parameter Pr unninд should
not be considered in the optimization procedure. So on, (5) is re-duced to:
Cme (am ) = smam Pidl e . (6)
4.3 Cluster optimizer
The heart of energy optimizer is represented in this section. As a brief recapitulation, our objective is to reduce the power consump-tion but still preserve the quality of services. This objective can be achieved via minimizing the number am of active PMs. Mathe-matically, the variable am needs to be found optimally. Firstly, we model the problem by engaging convex optimization as follows:
0 min (wmsp (lm (Imz ) − l)+ + smam Pidl e ). (7)
≤am ≤Pm
As stated before, the function lm (Im ) is a decreasing function of am . Therefore, the condition of am can be depicted as below:
a
δm .(8)
m ≤ l−1 l
In case a and m( )
+ = 0,
≥ δm lm−1 l lm Iz l) = lm δm am ) − l
m / ( ) ( ( m ) − ( ( / )
then any reduction of a to δm lm−1 l
) can also reduce the burning
m / (
power. Due to this reason, (7) can be re-formulated as shown below:
minδm
(
wmsp(
lm(
Imz) −
l)
++
smam Pidl e)
. (9)0≤am ≤ l−1 l m ( )
The Lagrangian function of this problem can be expressed as below:
L(am , γ ) = wmsp (lm (δm ) − l)++
am
(10)
δm
s
ma
mP
idl e+
γ
(a
m−
l
m−1(l)
)
+
α
(0
−
a
m).
Table 1: Summary of Google Traces’ Characteristics
Time span # of PMs #VM requests # of users
29 days 12583 >25M 925
This function can be solved by applying Karush−Kuhn−Tucker (KKT) conditions to find the near-optimal value am .
5 PERFORMANCE EVALUATION 5.1 Experiment design
The testbed is a cluster of 16 homogeneous servers. For the detail configuration, an Intel Xeon E7-2870 2.4Ghz and 12GB of RAM are geared towards the purposed of hosting upto 8 VMs in each serves. With these equipments, the infrastructure can host up to 128 VMs at maximum to conduct the experiment. For the dataset, we use Google traces as a simulation for the workload. Announced by Google, these traces actually comprise the monitoring data from more than 12,500 machines over a duration of 29 days. However, only a set of 6732 machines is chosen to satisfy the assumption of homogeneous system. In this set, we also extract randomly 2.26 GB from 39 GB of compressed data for the experiment. The chosen dataset consists of many parts. Each part represents a period of 24-hour of traces. For the convenience of presentation, we scale the maximum length of measurement to 60 seconds. This length is also adopted as the monitoring window. Moreover, the summary of Google traces’ characteristics is described in Table 1.
5.2 Implementation
The experiment is conducted under four schemes for comparison as follows:
• The default schemes: all of the PMs are activated all the time.
No power savings is acquired at all.
• The greedy first fit decreasing (FFD) scheme [12]: the VMs are
sorted into queue by descending order in term of internal CPU utilization. This queue is subsequently submit to the first host that matches the resource requirement. Basically, the bin-packing approach is used to relocate VMs.
• The proposed approach (E2M) scheme: the proposed method is
implemented to create near-optimal energy consumption and preserve the quality of services.
• The optimal energy-aware scheme: an optimal solution is
pre-calculated to achieve minimum energy consumption. In this scheme, the quality of services is not taken into ac-count. In order words, the quality of services is sacrificed to significantly save the energy.
5.3
Results© 2019, IRJET | Impact Factor value: 7.211 | ISO 9001:2008 Certified Journal
| Page 4692
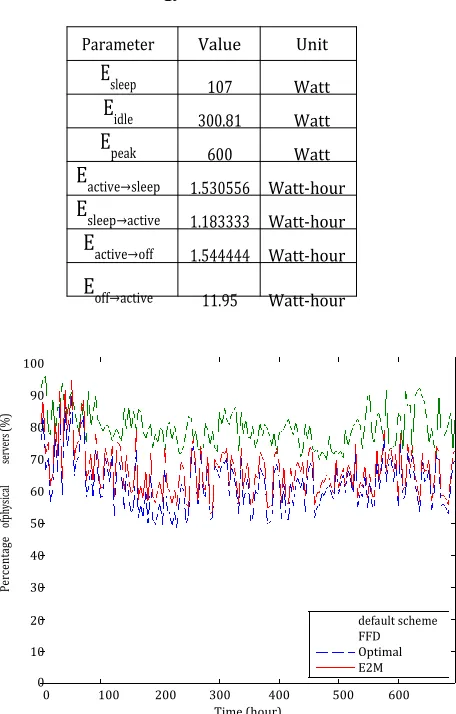
Table 2: Energy Estimation Parameters
Parameter Value Unit
E
sleep 107 WattE
idle 300.81 WattE
peak 600 WattE
active→sleep 1.530556 Watt-hourE
sleep→active 1.183333 Watt-hourE
active→off 1.544444 Watt-hourE
off→active 11.95 Watt-hour100
90
(%
)
80
ser
ve
rs
70
of
ph
ys
ical 60
50
Pe
rc
en
ta
ge
40
30
20
default scheme
FFD
10 Optimal
E2M
0
0 100 200 300 400 500 600
[image:6.612.51.279.88.445.2]Time (hour)
Figure 2: Percentage of active physical servers in Google traces experiment.
FFD scheme, even the power utilization is less than the default scheme, a remarkable amount of power is wasted since many idle PMs are kept alive when the workload fluctuates. The reason for this issue is that, without the capability of prediction, the FFD is unable to appropriately perform the bin-packing algorithm in ma-jority of times. Another reason is the obsolete status information of underlying computing facilities. Oppositely, the proposed ap-proach, namely E2M, can save much better energy by equipping with the prediction on resource utilization and the optimization on the pool of active PMs. There is also another additional aspect of this achievement, which is the gap between E2M and the optimal scheme. Apparently, the optimal scheme has better energy savings regardless the system performance. Because the quality of service is totally not considered in this scheme, this optimal solution brings to the infrastructure too much overhead and tends to frequently violate the SLA.
For more detail on quantitatively measuring the energy savings, our proposal can obtain the reduction of power consumption up to
100
90
(k
W
h)
80
Cons
um
pt
ion
70
Po
w
er
60
50 default schemeFFD
Optimal
E2M
40
0 20 40 60 80 100 120
Sampling time (minute)
Figure 3: Power consumption evaluation of the proposed method in Google traces experiment (lower is better).
100
Power Consumption (%)
90 Latency (second)
80
70
60
50
40
30
20
10
0
default scheme FFD E2M Optimal
Name of approach
Figure 4: Power consumption vs average latency in Google traces experiment.
[image:6.612.329.566.90.274.2] [image:6.612.338.562.353.538.2]© 2019, IRJET | Impact Factor value: 7.211 | ISO 9001:2008 Certified Journal
| Page 4693
6
CONCLUSIONIn this research, a near-optimal energy efficient solution is proposed based on the utilization prediction of infrastructure and the power consumption optimization. By engaging the mentioned techniques, our proposal can create suitable VM migration strategy. Based on this migration scheme, the cloud orchestrator can issue more rea-sonable VMs consolidation and condense near-optimal the pool of active PMs. As a result, a significant reduction in energy con-sumption can be achieved while still preserving the SLA. In future, we plan to integrate the heuristics algorithm to build a knowledge base that might help to reduce the overhead when performing the prediction. This integration might boost up the prediction part to even more quickly create the VM migrating instruction.
(ICEAC), 2011 International Conference on. IEEE, 1–6.
[14] M. Shojafar, N. Cordeschi, and E. Baccarelli. 2016. Energy-efficient Adaptive Resource Management for Real-time Vehicular Cloud Services. IEEE Transactions on Cloud Computing PP, 99 (2016), 1–1. https://doi.org/10.1109/TCC.2016.2551747
[15] Qi Zhang, Mohamed Faten Zhani, Shuo Zhang, Quanyan Zhu, Raouf Boutaba, and Joseph L Hellerstein. 2012. Dynamic energy-aware capacity provisioning for cloud computing environments. In Proceedings of the 9th international conference on Autonomic computing. ACM, 145–154.
[16] Yuanyuan Zhang, Wei Sun, and Yasushi Inoguchi. 2006. CPU load predictions on the computational grid*. In Cluster Computing and the Grid, 2006. CCGRID 06. Sixth IEEE International Symposium on, Vol. 1. IEEE, 321–326.
REFERENCES
[1]Yasuhiro Ajiro and Atsuhiro Tanaka. 2007. Improving packing algorithms for
server consolidation. In Int. CMG Conference. 399–406.
[2] Enzo Baccarelli, Nicola Cordeschi, Alessandro Mei, Massimo Panella, Mohammad Shojafar, and Julinda Stefa. 2016. Energy-efficient dynamic traffic offloading and reconfiguration of networked data centers for big data stream mobile computing: review, challenges, and a case study. IEEE Network 30, 2 (2016), 54–61.
[3] Anton Beloglazov, Jemal Abawajy, and Rajkumar Buyya. 2012. Energy-aware resource
allocation heuristics for efficient management of data centers for cloud computing. Future generation computer systems 28, 5 (2012), 755–768.
[4] Dinh-Mao Bui, Huu-Quoc Nguyen, YongIk Yoon, SungIk Jun, Muhammad Bilal Amin, and Sungyoung Lee. 2015. Gaussian process for predicting CPU utilization and its application to energy efficiency. Applied Intelligence 43, 4 (2015), 874–891.
[5]Edward G Coffman Jr, Michael R Garey, and David S Johnson. 1996.
Approx-imation algorithms for bin packing: a survey. In ApproxApprox-imation algorithms for NP-hard problems. PWS Publishing Co., 46–93.
[6]Nicola Cordeschi, Mohammad Shojafar, and Enzo Baccarelli. 2013. Energy-saving
self-configuring networked data centers. Computer Networks 57, 17 (2013), 3479– 3491.
[7]Mehiar Dabbagh, Bechir Hamdaoui, Mohsen Guizani, and Ammar Rayes. 2015.
Energy-efficient resource allocation and provisioning framework for cloud data centers. IEEE Transactions on Network and Service Management 12, 3 (2015), 377–391.
[8] Christopher Dabrowski and Fern Hunt. 2009. Using markov chain analysis to study dynamic behaviour in large-scale grid systems. In Proceedings of the Seventh Australasian Symposium on Grid Computing and e-Research-Volume 99. Australian Computer Society, Inc., 29–40.
[9]Xiaobo Fan, Wolf-Dietrich Weber, and Luiz Andre Barroso. 2007. Power
provi-sioning for a warehouse-sized computer. In ACM SIGARCH Computer Architecture News, Vol. 35. ACM, 13–23.
[10]Ajay Gulati, Anne Holler, Minwen Ji, Ganesha Shanmuganathan, Carl
Wald-spurger, and Xiaoyun Zhu. 2012. Vmware distributed resource management: Design, implementation, and lessons learned. VMware Technical Journal 1, 1 (2012), 45–64.
[11] David Meisner, Brian T Gold, and Thomas F Wenisch. 2009. PowerNap: eliminat-ing server idle power. In ACM Sigplan Notices, Vol. 44. ACM, 205–216.
[12]Thiago Kenji Okada, Albert De La Fuente Vigliotti, Daniel Macêdo Batista, and Alfredo
Goldman vel Lejbman. 2015. Consolidation of VMs to improve energy efficiency in cloud computing environments. (2015), 150–158.