NUMBER 11 SEPTEMBER 2009
Poverty and
Deprivation in
Ireland in
Comparative
Perspective
CHRISTOPHER T. WHELAN
AND
BERTRAND MAITRE
ESRI
RESEARCH SERIES
NUMBER 11
SEPTEMBER 2009
P
OVERTY AND
D
EPRIVATION IN
I
RELAND IN
C
OMPARATIVE
P
ERSPECTIVE
CHRISTOPHER T.WHELAN AND
BERTRAND MAITRE
This paper is available online at www.esri.ie
The Economic and Social Research Institute (Limited Company No. 18269). Registered Office: Whitaker Square,
Christopher T. Whelan is a Professor and Head of School at the School of Sociology, University College Dublin and is a former Research Professor (ESRI). Bertrand Maître is a Research Officer at the Economic and Social Research Institute.
RESEARCH SERIES
NUMBER 11
SEPTEMBER 2009
P
OVERTY AND
D
EPRIVATION IN
I
RELAND IN
C
OMPARATIVE
P
ERSPECTIVE
CHRISTOPHER T.WHELAN AND
BERTRAND MAITRE
© THE ECONOMIC AND SOCIAL RESEARCH INSTITUTE DUBLIN, 2009
IV
Chapter Page List of Figures vi
List of Tables ix
Executive Summary xi
1. Introduction 1
2. Measuring Material Deprivation in the European Union 5
3. Comparing Irish and European Consistent Poverty Measures 28
4. Comparative Analysis of At Risk of Poverty and Consistent Poverty Rates 35
5. Comparative Analysis of ‘At Risk of Poverty’ and Consistent Poverty Levels
and Patterns 50
6. Conclusion 72
References 78
Page
Figure 2.1: Cross National and Welfare Regime Variation in Reliability
Levels for Consumption Deprivation, EU-SILC 2006 14
Figure 2.2: Cross National and Welfare Regime Variation in Reliability Levels
for Housing Facilities Deprivation, EU-SILC 2006 15
Figure 2.3: Cross National and Welfare Regime Variation in Reliability Levels
for Neighbourhood Environment Deprivation, EU-SILC 2006 16
Figure 2.4: Mean Deprivation Levels for EU Prevalence Weighted for
Consumption Deprivation, EU-SILC 2006 17
Figure 2.5: Mean Deprivation Levels for EU Prevalence Weighted for Household
Facilities Deprivation, EU-SILC 2006 18
Figure 2.6: Mean Deprivation Levels for EU Prevalence Weighted for Neighbourhood
Environment, EU-SILC 2006 19
Figure 2.7: Percentage Experiencing Housing Deterioration with Leaking Roof,
EU-SILC 2006 20
Figure 3.1: Level of Economic Stress by Consistent Poverty Typology, EU-SILC 2006 34
Figure 4.1: HRP Principal Economic Status by Country, EU-SILC 2006 43
Figure 4.2: Lone Parent HRPs by Country, EU-SILC 2006 43
Figure 4.3 : Age Group by Country, EU-SILC 2006 44
Figure 4.4: At Risk of Poverty by Sex of HRP, EU-SILC 2006 46
Figure 4.5: Consistent Poverty (consumption Deprivation 3+) By Sex of
HRP, EU-SILC 2006 46
Figure 4.6: At Risk of Poverty By Lone Parent HRP, EU-SILC 2006 47
Figure 4.7: Consistent Poverty (consumption deprivation 3+) Lone Parent HRP,
EU-SILC 2006 47
Figure 4.8: At Risk of Poverty by Age Group by Country, EU-SILC 2006 48
Figure 4.9 Consistent Poverty (Consumption Deprivation (3+) by Age Group
by Country, EU-SILC 2006 48
Figure 5.1: Odds Ratios for at Risk of Poverty, Country Effects Before and After
Control for HRP Principal Economic Status, EU-SILC 2006 52
Figure 5.2: Odds Ratios for at Risk of Poverty by HRP Principal Economic
Status, EU-SILC 2006 53
Page
Figure 5.3: Cross-national Variation in the Impact of HRP Principal Economic Status on being At Risk of Poverty (odds ratios relative to HRP full-time
employee in Finland), EU-SILC 2006 54
Figure 5.4: Cross-national Variation in the Impact of Principal Economic Status of the HRP by Country (reference category full-time employed in each country),
EU-SILC 2006 55
Figure 5.5: Gross and Net Country Odds Ratios for at Risk of Poverty Controlling for
HRP Lone Parenthood, EU-SILC 2006 56
Figure 5.6: Cross-national Variation in the Impact of HRP Lone Parenthood by Country (odds ratios relative to non lone parent HRP in individual
Countries), EU-SILC 2006 57
Figure 5.7: Cross-national Variation in Impact of Life Cycle for at Risk of Poverty
(odds ratios relative to working age group in Finland), EU-SILC 2006 57
Figure 5.8: Variation in the National Impact of Life Cycle by Country (working age
18-64 in each country as the reference category), EU-SILC 2006 58
Figure 5.9: Cross-national Variation in the Impact of Principal Economic Status of the HRP on Consistent Poverty by Country (odds ratio relative to category
full-time employees in each country), EU-SILC 2006 59
Figure 5.10: Odds Ratios for Consistent Poverty by HRP Principal Economic Status
(reference category HRP full time employee), EU-SILC 2006 60
Figure 5.11: Cross-national Variation in the Impact of HRP Principal Economic Status on Consistent Poverty (odds ratios relative to HRP full-time employee in
Finland), EU-SILC 2006 61
Figure 5.12: Cross-national Variation in the Impact of HRP Principal Economic Status on Consistent Poverty (odds ratios relative to full-time employees
in each country), EU-SILC 2006 62
Figure 5.13: Cross-national Variation in the Impact of Lone Parenthood on Consistent
Poverty (odds ratios relative to non lone parents in Finland), EU-SILC 2006 63
Figure 5.14: Variation in the National Impact of HRP Lone Parenthood on ‘At Risk of Poverty’ by Country (odds ratios relative to working age 18-64 in each
country), EU-SILC 2006 63
Figure 5.15: Cross-national Variation in the Impact of Life Cycle on Consistent Poverty (odds ratios relative to full-time unemployed in Finland, EU-SILC
2006 64
Figure 5.16: Variation in the Impact of Life Cycle on Consistent Poverty by Country (reference category working age individuals 18-64 in each country),
EU-SILC 2006 65
Page
Figure 5.17: Gross and Net Impact of Country Impact on At Risk of Poverty
Controlling for Labour Market Exclusion, EU-SILC 2006 66
Figure 5.18: Cross-national Variation in the Impact of HRP Labour Exclusion on At Risk of Poverty (reference category HRP full-time employees in Finland),
EU-SILC 2006 67
Figure 5.19: Variation in the Relative Impact of HRP Labour Markey Exclusion on At Risk of Poverty by Country (reference category HRP full-time employed in
each country), EU-SILC 2006 67
Figure 5.20: Gross and Net Impact of Country Impact on Consistent Poverty
Controlling for Labour Market Exclusion, EU-SILC 2006 68
Figure 5.21: Cross-national Variation in the Impact of HRP Labour Exclusion on Consistent Poverty (reference category HRP full-time employee in
Finland), EU-SILC 2006 69
Figure 5.22: Variation in the Relative Impact of HRP Labour Markey Exclusion on Consistent Poverty by Country (reference category HRP full-time
employed in each country), EU-SILC 2006 69
IX
LIST OF TABLES
Page
Table 2.1: Confirmatory Factor Analysis for EU-SILC 2006 Deprivation Items:
Standardised Model Results, EU-SILC 2006 12
Table 2.2: Correlations Matrix for EU Prevalence Weighted Deprivation
Dimensions, EU-SILC 2006 16
Table 2.3: Individual Consumption Deprivation Items by Country, EU-SILC 2006 22
Table 2.4: Regression of Deprivation Dimensions on Subjective Economic Stress,
EU-SILC 2006 23
Table 2.5: Multiple Deprivation Patterns by Consumption Deprivation for the EU,
EU-SILC 2006 24
Table 2.6: Multiple Deprivation Patterns by Consumption Deprivation by Country,
EU-SILC 2006 25
Table 3.1: List Irish, EU and Common Deprivation Indicators, EU-SILC 2006 30
Table 3.2: Relationship Between EU and Irish Specific Measures of Consistent
Poverty at 60 Per Cent of Median Income, EU-SILC 2006 31
Table 3.3: Population Percentages Found in Possible Combinations of EU
Common and Irish Specific Indicators of Consistent Poverty, EU-SILC 2006 31
Table 3.4: Labour Force Status, Age Group and Housing Tenure Composition by the EU Common and Irish Specific Consistent poverty Typology,
EU-SILC 2006 33
Table 4.1: National and EU at Risk of Poverty Rates by Country, EU-SILC 2006 38
Table 4.2: Income Poverty – Consumption Deprivation (3+) Consistency Rates,
EU-SILC 2006 39
Table 4.3 National and EU Consistent Poverty Rates by Country, EU-SILC 2006 41
Table 4.4 Relative Rank of Ireland by Type of Poverty Measure, EU-SILC 2006 42
Table 4.5 At Risk of Poverty by HRP Principal Economic Status by Country,
EU-SILC 2006 45
Table 4.6: Consistent Poverty (Consumption Deprivation 3+) by HRP Principal
Economic Status by Country, EU-SILC 2006 45
E
XECUTIVE
S
UMMARY
D
espite a period of sustained economic growth from the mid-1990s until 2007, Irish ‘at risk of poverty’ levels remained stubbornly high, where ‘at risk of poverty’ is defined as falling below 60 per cent of median household income adjusted for household size. In the context of the enlargement of the European Union (EU), Ireland was seen to compare unfavourably not only with its prosperous EU neighbours but also with a number of New Member States.Poverty Rates
and Living
Standards
The fact that the ‘at risk of poverty’ methodology leads to Irish poverty rates being higher than a number of New Member States, despite the fact that Ireland enjoys substantial advantages in terms of GDP per capita, has led to increased reservations about sole reliance on this approach to measuring poverty.
The apparent paradox presented by the results deriving from the ‘at risk of poverty’ methodology has encouraged a number of responses. The first, which has been evolving for some time, involves a shift from a uni-dimensional perspective, focusing solely on relative income, to a multidimensional perspective that incorporates both income and material deprivation. The second involves teasing out the implications of indices constructed at an EU-level. Critics of the ‘at risk of poverty’ measure have focused on the fact that middle income households in poorer European states have incomes that are lower than the relative income poverty threshold in richer countries and that a larger share of the population in a richer country, such as Ireland, is considered poor than in less affluent countries, such as Estonia. Confronted with such outcomes, a number of authors have suggested that the use of a ‘state bounded approach’, i.e., employing measures that are defined entirely in terms of national relativities, can be challenged both on the grounds of differences in absolute deprivation and how people feel about their material living standards.
In this paper we explore both multidimensional and Europe-wide approaches in order to compare the consequence of choice with regard to unidimensionality versus multidimensionality and geographical unit. The recent availability of data from the European Union Statistics on Income and Living Conditions (EU-SILC) instrument allows us to place the Irish situation in a broad comparative context in relation to the implications of opting for a multidimensional versus a undimensional approach and the choice of geographical unit. For some parts of our analysis we take full advantage of the range of data available in the EU-SILC and place the Irish outcomes in the context of findings relating to the other twenty-five countries. For other purposes, we focus on comparisons with six countries specifically chosen for their value in contextualising the Irish outcomes. The UK has been chosen because of the similarities in institutional
arrangements and for obvious historical reasons. The other five countries comprise a set of smaller European countries that span a range of welfare state arrangements, namely, Finland, Austria, Portugal, the Czech Republic and Estonia. The strategy we adopt involves a compromise between taking as wide a comparative perspective as possible and alternatively focusing on key comparisons that we hope will be particularly illuminating in relation to the Irish case.
I
n this paper we compare Irish poverty rates with a range of othercountries using five different definitions of poverty which are described below and summarised in Table 1 below. In terms of national ‘at risk of poverty’ level, Ireland with a rate of 18.5 per cent in the 2006 wave of EU-SILC, ranks joint 17th of the 26 countries for which we have information.1
It has a rate almost twice that for the Czech Republic and one-and-a- half times that of Finland and Austria, marginally higher than the UK and identical to those observed for Portugal and Estonia. However, a compelling case can be made that Ireland is distinctive not so much for its overall level of being ‘at risk of poverty’, but in terms of the comparatively severe consequences for poverty outcomes of factors such as exclusion from the labour market and lone parenthood. Individuals in Ireland in households where the household reference person (HRP) is in employment have an ‘at risk of poverty’ rate that is no higher than their counterparts in countries such as Finland and Austria. In contrast, those in households in Ireland where the HRP is unemployed, ill/disabled or inactive experience at ‘risk of poverty’ levels that are one-and-a-half to twice as high those found in Finland and Austria. Ireland is very similar to the UK in this respect.
[image:15.595.166.526.448.730.2]‘At Risk of
Poverty’:
National
Measures in
Comparative
European
Perspective
Table 1: Poverty Measures, Irish Rates and Rankings
Poverty Concept Measurement Poverty
Rate in Ireland
Irish Ranking
National At Risk of Poverty
Percentage of households below 60 per cent of national median income
18.5 17
EU At Risk of Poverty
Percentage of households below 60 per cent of EU median income
9.9 13
National Consistent Poverty
Percentage below 60 per cent of national median income and above a deprivation threshold that identifies an identical proportion of individuals to that captured by national income measure
8.7 21
EU Consistent Poverty
Percentage below 60 per cent of EU median income and experiencing enforced lack of 3+ of 7 deprivation items
5.1 13
Mixed Consistent Poverty
Percentage below 60 per cent of national median income and experiencing enforced lack of 3+ of 7 deprivation items
7.1 17
Similarly, while between one in four and one in five individuals in households with a lone parent HRP are found to be ‘at risk of poverty’ in Finland and Austria, this rises to almost one in two in Ireland. In relation to the HRP being a lone parent, Ireland shares with Estonia and, to a slightly lesser extent the UK and the Czech Republic, a profile that combines comparatively high overall levels of ‘at risk of poverty’ in European terms with distinctively sharp within-country differentials between individuals in such lone parent households, on the one hand, and all other households, on the other.
Ireland shares with the UK, Portugal, the Czech Republic and Estonia a life cycle pattern whereby ‘at risk of poverty’ rates are significantly higher for children and older people than for working age individuals. The fact that this pattern is not uniform across countries shows that social policy does not simply respond to life cycle inequalities but also shapes such patterns.
Maintaining a strictly national perspective, one can define a consistent poverty measure in which people are defined as poor when they are both below 60 per cent of median equivalent and above a consumption deprivation threshold where the same number of people is found as is located below the 60 per cent income line. Adopting such a dual perspective, leads to Ireland’s ranking deteriorating from 17th to 21st among the twenty-six countries we consider. In every case adopting a consistent poverty approach leads to substantial reductions in poverty levels because of the low degree of overlap between low income and high deprivation. However, the extent of the overlap is even less in other countries than in Ireland. While in Ireland just less than one in two of those below the 60 per cent income line are also found above the corresponding consumption deprivation threshold, the overlap between the income poor and those exposed to high levels of deprivation level is actually higher in the Irish case than that for the remaining twenty-five countries. As a consequence, while the construction of a consistent poverty measure that maintains an entirely national or relative perspective reduces the Irish poverty rate to 8.7 per cent, it also leads to a deterioration rather than an improvement in Ireland’s ranking.
A
consequence of the apparently paradoxical results produced by the national ‘at risk of poverty’ approach has been that a number of commentators have argued in favour of the use of an EU-wide measure instead of or at least together with the national measure. This approach, which takes 60 per cent of median income in the twenty-six EU countries, produces an ‘at risk of poverty’ rate of 9.9 per cent for Ireland. Its ranking improves from 17th to 13th of the 26 countries included in this study. Moreover, the absolute difference between the Irish rate and those in a number of less affluent European countries becomes quite substantial. For example, the European ‘at risk of poverty’ level for Portugal is 46.5 per cent and for Poland it is 73.5.‘At Risk of
Poverty’:
EU-wide
Measures
of individuals. Adopting this measure we estimate that 5.1 per cent of the Irish sample is located above this threshold and Ireland has an identical ranking to that observed for the European ‘at risk of poverty’ measure. This Irish consistent poverty level compares with one of 19.3 per cent in Portugal and 45.9 per cent in Poland.
The European approach clearly produces results in terms of poverty levels that reflect substantial differences in living standards. However, one consequence of this approach is that national differences almost entirely dominate socio-economic influences. For example, those excluded from the labour market in the more affluent countries emerge with significantly lower poverty rates than those active in the labour market in the less affluent countries. This constitutes a significant disadvantage if we wish to understand the processes generating poverty and social exclusion across the European Union. Such an approach is consistent with the twin concerns of the European Commission (2004) that poverty measurement should both acknowledge that what is regarded as minimal acceptable living standards depends largely on the general level of social and economic development, and recognise that the challenge for Europe is to allow the whole population share the benefits of high average prosperity.
T
he Irish consistent poverty measure adopted for the National Action Plan on Social Inclusion (NAPSInc) reporting process combines an income threshold at 60 per cent of equivalised income with being above a deprivation threshold defined in terms of enforced absence of 2 or more of 11 basic deprivation items. It is not possible to apply the NAPSInc measure on a comparative basis across EU countries and we employ it here simply as a reference point for the measures that we do employ. At the European level, our analysis shows that the nearest we could come to such a measure is by adopting a deprivation threshold of 3 or more from a set of 7 consumption deprivation items. The threshold is higher in the latter case, despite the smaller number of items, because the levels of deprivation in relation to the consumption items are substantially higher than in cases of basic items relating to food and clothing. Despite the modest overlap between deprivation items for the two indices, and the application of different thresholds, the NAPSInc measure and the indicator based in the common EU-SILC data set produce almost identical estimates of poverty levels. The respective figures are 6.5 per cent and 7.1 per cent.Combining
National and
European
Perspectives
The measure based on the common EU-SILC data set effectively combines national and European approaches. It adopts a strictly relative or national approach to income. On the other hand, a particular level of consumption deprivation is considered as having identical significance across countries. Using this measure which identifies those who are both below the national relative income poverty line and experiencing enforced deprivation on 3 of the 7 consumption deprivation items, Ireland is ranked 17th of the 26 countries included in the study. Its consistent poverty rate of 7.1 per cent is substantially above those in the set of Scandinavian countries where the highest level of 4.4 is observed for Finland. However, it is significantly lower than in countries such as Portugal and Poland where the levels of consistent poverty are 8.9 and 14.9 per cent respectively.
approach. However, in every case socio-economic variation is much sharper with the consistent poverty indicator than with the ‘at risk of poverty’ measure. For the seven countries on which we have focused, poverty rates with the consistent poverty measure are extremely low for those active in the labour market. In Ireland, where the HRP is in full-time employment, less than 1 per cent of individuals are found below the combined poverty threshold. However, this rises to close to 30 per cent in Ireland where the HRP is unemployed and in the UK and the Czech Republic it exceeds 40 per cent.
Our analysis defines those not in paid work because of illness/disability, inactivity or unemployment as ‘excluded from the labour market’. For those not excluded we find that the overall level of consistent poverty in each country is a great deal lower than the corresponding level ‘at risk of poverty’ but the pattern of differentiation across countries is almost identical. However, for the group excluded from the labour market a somewhat different pattern emerges with by far the highest levels of consistent poverty being observed for Estonia and the Czech Republic, while Ireland and the UK occupy intermediate positions. Nevertheless, if we focus on the effect of labour market exclusion on within-country relativities, Ireland remains at the upper end of the continuum although it is more favourably placed than the Czech Republic and, in particular, than the UK which is characterised by striking levels of disparity. The distinctive position of the UK stems primarily from the particularly strong impact of unemployment and the relatively low levels of income support for the unemployed in that country. The distinctive patterns of cross-national variation for those excluded from the labour market compared to all others for ‘at risk of poverty’ and consistent poverty are graphically illustrated in Figures 5.18 and 5.21 on pages 67 and 69 respectively.
For those who are not in lone parent households, the highest level of 9 per cent is observed in Portugal while for Ireland it is 5 per cent. In contrast, with the exception of Finland where the rate is 8 per cent, for those in lone parent households the ‘at risk of poverty’ rate ranges from 16 per cent in Austria to 35 per cent in Ireland. Ireland displays the highest level of consistent poverty for lone parents followed by Estonia and the Czech Republic. Within country, relativities between those in lone parent households and others are also sharpest in Ireland, followed by the UK and the Czech Republic. In every case socio-economic differentiation proves to be sharper when we focus on consistent poverty. However, while shifting to such a perspective leads to an improvement in Ireland’s relative position in relation to HRP principal economic status (PES) differentials, this is not true when the HRP is a lone parent. Thus, in relation to consistent poverty, Ireland represents the worst case scenario with regard to absolute and relative outcomes for individuals in lone parent households.
D
uring the period of economic boom, ‘at risk of poverty’ rates in Ireland remained comparatively high in European terms. Concerns have been expressed that this outcome is an artefact of the measure of poverty employed and this is reflected in the use at national and EU level of the terminology of ‘at risk of poverty’. A case can clearly be made for combining income and deprivation information to produce a consistent poverty indicator. However, applying a consistent poverty measure, while lowering poverty levels, produces no improvement in Ireland’s relativePoverty in
European position. Rather then being an exception in relation to the proportion of households below the income line who are not deprived, Ireland is actually at the lower end of the continuum.
Shifting to European indicators, whether in terms of ‘at risk of poverty’ or consistent poverty, produces a slight improvement in Ireland’s ranking and confers a substantial advantage on it in terms of absolute poverty rates where comparison with Southern European countries or new member states are involved. Such indicators, however, are characterised by significant disadvantages in terms of understanding of patterns of socio-economic differentiation in relation to poverty.
An approach that combines a national or relative approach in relation to income and an ‘absolute’ or EU approach to deprivation leads in every case to a substantial reduction in poverty rates. However, Ireland’s ranking remains unchanged in comparison with the ‘at risk of poverty’ indicator.
1.
I
NTRODUCTION
I
n this introduction we seek to provide a brief account of the manner in which apparently paradoxical results relating to poverty levels in EU countries have provoked various answers. Such responses have involved varying the geographical unit on which poverty and social exclusion is based and the development of indicators that reflect an appreciation that poverty and social exclusion involve more than low income. We will then outline the steps that we will take in developing a comprehensive analysis that incorporates these broader perspectives.At the beginning of the 1990s, Irish living standards in terms of GNP per head were at two-thirds of the European average but by the end of the decade most of that gap had been closed. The most striking development in the period was an increase in the numbers employed of over 40 per cent. Unemployment fell from 16 per cent to less than 4 per cent.1 The period 1994-2000 saw an expansion of the Irish economy that led Blanchard (2002, p. 61) to conclude: “I do not know the rules by which miracles are officially defined, but this seems to come close”. Yet Irish poverty rates, as captured by the primary EU indicator of ‘at risk of poverty’ remained stubbornly high leaving Ireland in a position that compared unfavourably not only with its prosperous western European neighbours but also with a number of the New Member States (NMS).
In this publication we seek to put Irish poverty rates in a broader comparative European perspective. We pursue this agenda in a context where the ‘at risk of poverty’ indicator, based on the proportion falling below 60 per cent of adjusted equivalent income remains the key EU poverty indicator. However, increasingly concern has been expressed regarding this approach as it leads to countries, such as Ireland, exhibiting higher poverty rates than a number of New Member States. This remains true, despite the fact that Ireland enjoys substantial advantages in terms of GDP per capita and other indicators of material living conditions, may reflect the limitations of ‘at risk of poverty’ measures in capturing rapid changes in living standards.
The apparent paradoxes presented by the results deriving from the ‘at risk of poverty’ approach have encouraged a number of responses. The first, which has been evolving for some time, involves a shift from a uni-dimensional perspective focusing solely on relative income to a multidimensional perspective that incorporates both income and indicators of material deprivation. This approach builds on pioneering work by Townsend (1979) and Mack and Lansley (1985). It has been applied by
1 For further discussion of the Irish experience of economic growth see Honohan and
ESRI researchers at both national and European levels (Nolan and Whelan, 1996; and Maître, Nolan and Whelan, 2006). It has also underpinned the development of the Irish consistent poverty measure where those defined as poor have incomes below 60 per cent of median income adjusted for family size (Callan, Nolan and Whelan, 1993; and Whelan, 2007).
Interest in the use of material deprivation indicators has intensified at the European level. A recent OECD report Society at a Glance considered the relationship between ‘at risk of poverty’ in terms of income, and material deprivation at a national level. When considering all countries for which information is available the OECD reports that the index of deprivation it employs is only weakly correlated with the prevalence of ‘at risk of poverty’ while it is more strongly correlated with GDP. However, the reverse is also the case (i.e. a stronger correlation with relative income poverty and a weaker one with average per capita income) when excluding OECD countries with GDP per capita below €25,000. This suggests that material deprivation provides information about both absolute living standards and the lower end of the income distribution of each country.
The OECD analysis is based on aggregate correlations across countries and involves limited standardisation of items across countries. However, in the Irish case, on the basis of analysis of micro data, we have known for some time that income indicators and ‘deprivation informed’ measures such as consistent poverty provide different estimates of levels of poverty and identify rather different groups of people as being in poverty. More recently Eurostat (2006) has compared income poverty and deprivation approaches across the fourteen countries in the first wave of EU-SILC. We know from a substantial body of literature that the discrepancy between income and deprivation approaches is observed across a wide range of countries. Nevertheless, it is still true that among countries with the highest national income poverty rates, the deprivation level is also relatively high. The exception, however, is Ireland where the deprivation rates, using a number of thresholds, are significantly lower than might be expected on the basis of its ‘at risk of poverty’ rate.
These results have stimulated interest not only in comparing the consequences of opting for unidimensional or multidimensional approaches but also in teasing out the implications of constructing indices at a national or EU-level. This second broad approach, starts from the observation that middle income households in poorer European states have incomes that are lower than the relative income poverty threshold in richer countries, and the associated paradox that a larger share of the population in a country such as Ireland is considered poor than in Poland. In this context, Fahey (2007, pp. 36-37) suggests that the “state bounded approach”, which defines income poverty entirely in terms of national relativities, can be challenged on two grounds. The first involves a consideration of cross-national differences in absolute deprivation and the second involves an assessment of how people feel about their material living standards. Recent efforts at comparing ‘at risk of poverty’ outcomes at both national and EU levels include Brandolini (2007).
comparative context in relation to the implications of opting for a multidimensional or a undimensional approach to poverty measurement and the choice of geographical unit whether national or European. For some parts of our analysis we take full advantage of the range of data available in the EU-SILC and will place the Irish outcomes in the context of findings from the remaining twenty-five countries. For other purposes, we will focus on six countries specifically chosen to contextualising the Irish outcomes. The UK has been chosen because of the similarities in institutional arrangements and for obvious historical reasons. The remaining countries comprise a set of five smaller European countries that span a range of welfare regime arrangements namely Finland, Austria, Cyprus, the Czech Republic and Estonia. A coherent case can be made, as has been done by Callan et al. (2008), for comparing Irish poverty outcomes and institutional arrangements with the ‘best practice’ countries, such as those operating under Scandinavian welfare state arrangements. However, a compelling argument can also be made for taking a broader comparative perspective and focusing on a sample of countries whose performance Ireland might reasonably be expected to emulate. It also constitutes an advantage where we wish to consider the consequences of choosing between income and deprivation and national and European approaches. The strategy we adopt involves a compromise between taking as wide a comparative perspective as possible and alternatively focusing on key comparisons that we hope will be illuminating in relation to the Irish case.
Our focus in this paper is on poverty and deprivation outcomes and the manner in which socio-economic factors contribute to such outcomes. Given the scale of the comparative analyses reported here, it will be beyond the scope of this publication to explore in detail the manner in which institutional mechanisms and policies mediate such relationships. However, we shall seek to relate our findings to the earlier analysis by Callan et al.
(2008) which was aimed specifically at evaluating effective policies. We will endeavour to provide part of the platform required for future exercises of this kind.
In Chapter 2, using the data from EU-SILC 2006 covering twenty-six European countries, we address the challenges involved in measuring deprivation at the European level. We distinguish a number of dimensions of deprivation and assess the degree to which they can be reliably measured across the range of countries covered in the EU-SILC data set. We then proceed to document cross-national differences in deprivation levels. In particular, we focus on a consumption deprivation index that we employ subsequently as one component of a consistent poverty measure. This consumption deprivation index is shown to have a number of features that make it the most plausible candidate to serve as the deprivation component of a consistent poverty measure that comes closest to that currently employed in Ireland but that permits European comparisons.
In Chapter 3 we construct such a European-wide consistent poverty index and compare both levels of consistent poverty and the socio-economic composition of the poor using this measure and the Irish consistent poverty measure.
set. For the seven countries on which we have decided to focus, we then proceed to consider cross-national variation in key socio-economic attributes. Our analysis is then extended to take into account the impact of such variation and the differential consequences of such attributes for cross-country differences in the levels of ‘at risk of poverty’ and consistent poverty.
In Chapter 5 we go beyond the relatively descriptive analysis in the earlier chapters in order to develop an analytic strategy that enables us to provide a more systematic treatment of the manner in which the distribution and consequences of socio-economic characteristics shape patterns of cross-country variation in relation to ‘at risk of poverty’ and ‘consistent poverty’.
2.
M
EASURING
M
ATERIAL
D
EPRIVATION IN THE
E
UROPEAN
U
NION
I
n this chapter we use new data from EU-SILC for twenty-six European countries to examine the structure and distribution of material deprivation in the enlarged EU. We identify three distinct dimensions of material deprivation relating to consumption, household facilities and neighbourhood environment, and construct indices of these dimensions for each country and the EU as a whole. The extent of variation across countries and welfare regimes is shown to depend on the dimension on which one focuses, as does the strength of the association with household income and subjective economic stress. The index of consumption deprivation is shown to have by far the highest correlation with income. It constitutes a highly reliable measure in itself, and allows segments of the population to be identified that are sharply differentiated in terms of their multidimensional deprivation profiles.2.1
Introduction
constructed that are satisfactory at both national and European levels, and can serve as additions to the existing portfolio of social indicators. We also address the question of how analysis of the deprivation indicators currently included in EU-SILC can inform future developments in this area particularly through the special module on deprivation being developed by Eurostat which will be part of the 2009 wave of EU-SILC.
The current interest in indicators of material deprivation is related to increasing dissatisfaction, in an EU context and within many countries, with the common approach of focusing on those falling below relative income poverty lines. It has long been argued that poverty is about ‘more than just money’, and recent years have seen an increasing emphasis on multidimensionality – although often on a rather ad hoc basis.2 Such
approaches have attempted to make use of not only income measures, but in varying combinations, indicators of consumption, housing, health and neighbourhood environment.
Following Townsend (1979), the European Union has conceived poverty as involving exclusion from the minimally acceptable way of life of the Member state in which one lives as a consequence of inadequate resources (Atkinson et al., 2002). Those below relative income thresholds, falling more than a certain ‘distance’ below the average, could indeed be excluded as a consequence from the minimally acceptable way of life. However, in practice low income turns out to be quite unreliable in identifying households experiencing distinctive levels of deprivation (Ringen, 1988). Recognition of this fact contributed to the labelling of those below relative income thresholds in the current EU indicators as being ‘at risk of poverty’, whereas previously they had been simply termed “poor”.
The various factors contributing to the weakness of the measured relationship between income and deprivation are becoming better understood. They include the fact that current income is an imperfect indicator of long-term or ‘permanent’ income, that needs to differ across households in a manner that is difficult to capture in ‘equivalence scales’, and that not only income but support from family, friends and neighbours, non-cash income from public provision of services, and geographical
location all affect living standards.3 The growing literature on
multidimensional analysis of social exclusion shows that different methods lead to different conclusions about not only levels of poverty or exclusion, but also the groups or types of household that are identified as excluded.4
Rather than serving as a counsel of despair, though, the lesson can be drawn that direct measures of material deprivation, seen as a complement
2 Alternative conceptual and empirical rationales for adopting such an approach are
discussed in Nolan and Whelan (2007).
3 Extending to observation period from one to five years, while providing improved
measures of both income and deprivation, does not resolve the problem of limited overlap. See Whelan et al. (2001, 2004).
4 See Mack and Lansley (1985); Gordon et al. (2000), Bradshaw and Finch (2003); Hallerod
rather than an alternative to income measurement, have a valuable role to play in understanding poverty and framing and monitoring policy.5
T
he current set of common EU-indicators of poverty and socialexclusion used in the context of the Open Method of Coordination (OMC) relies heavily on measures of relative income poverty. The emphasis on a purely relative perspective, taking conditions in one’s own country as the benchmark, has been justified by the European Commission in the following terms:
2.2
Measurement
of Deprivation
in the
European
Union
An absolute notion is considered less relevant for the EU for two basic reasons.First the challenge for Europe is to make the whole population share the benefits of high average prosperity and not to reach basic standards of living as in developed parts of the world. Secondly, what is regarded as minimal acceptable living standards depends largely on the general level of social and economic development, which tends to vary considerably across countries
(European Commission, 2004).
Nevertheless, as Guio (2005) observes, particular concern has been expressed about the ability of the current portfolio of indicators to satisfactorily reflect the situation of the New Member States and facilitate meaningful comparison between them and the ‘old’ Member States. As Fahey (2007) notes, relative poverty thresholds in the more affluent member states are above average income in the poorest member states, and the ‘poor’ in some countries have higher standards of living than the well-off in others. The problems are reflected in the strikingly different pictures provided by comparisons involving on the one hand ‘at risk of poverty’ indicators and, for example, average GDP.
One response to such concerns has been to explore the income poverty patterns that would result from adopting either sub-national or EU-level thresholds.6 An alternative approach has focused on the development and
use of material deprivation indicators. The EU is committed to developing such indicators to form part of its portfolio for the purposes of the social inclusion process, and to facilitate this a special module relating to material deprivation is to be included in the 2009 round of EU-SILC.7 However, in
the meantime significant progress can be made by analysing the indicators already included in the core EU-SILC each year, and that is what we undertake here.
The deprivation items that have been included in the ECHP and EU-SILC have largely related to the enforced lack of items depicting material living conditions, such as capacity to afford basic requirements, possession of consumer durables, household conditions and quality of neighbourhood environment. Guio (2005) stresses that such indicators do not provide a comprehensive coverage of social exclusion because they ignore access to the labour market, education, health and social participation. They are
5 Boarini and d’Ercole (2006, p. 12) suggest that this dual approach is consistent with Sen’s
(2000) argument that a comprehensive approach should encompass a focus on individuals’ command over resources – capabilities – and the resulting outcomes – functionings.
simply intended to offer synthetic information on material living conditions. However, this is not necessarily a disadvantage. All-embracing definitions of social exclusions that conflate disparate dimensions often obscure rather than clarify the underlying processes of exclusion.8
Here we report the findings of an analysis of material deprivation using EU-SILC 2006. The data available for analysis covers twenty-six countries, twenty-four EU member states plus Norway and Iceland. The analysis will be conducted at the household level. Taking into account previous literature in the area of material deprivation, our objectives are as follows:
• To propose and test a dimensional structure for the analysis of material derivation using EU-SILC.
• To consider the levels of reliability associated with the dimensions proposed at national, welfare regime and EU levels.
• To examine the extent to which deprivation dimensions are
independent or correlated.
• To assess the adequacy of measurement relating to the dimensions we identify and the possible need to develop additional dimensions.
• To document national and welfare regime variation in relation to deprivation dimensions and certain single indicators that we identify as of particular interest.
• To ask to what extent the particular form of deprivation that we label ‘consumption deprivation’ also captures exposure to deprivation more broadly.
• To consider the relationship between different forms of
deprivation, household income and subjective economic stress.
E
U-SILC is now the reference source for statistics on income and living conditions, and common indicators for social inclusion in the EU. It was launched in 2004 in thirteen Member States (Belgium, Denmark, Spain, Greece, Spain, France, Ireland, Italy, Luxembourg, Austria, Portugal, Finland and Sweden) and in Norway and Iceland. It was only in 2005 that the EU-SILC reached its full scale with twenty-five Member States plus Norway and Iceland. In this publication we make use of two surveys, the Eurostat EU-SILC for 2006 and the Irish EU-SILC for 2006. The Eurostat EU-SILC 2006 is used for international comparative perspective across Chapters 2, 4 and 5 while the Irish EU-SILC 2006 survey is used in Chapter 3 in an Irish context only.2.3
Data Sets
The Eurostat User Database EU-SILC 2006 covers twenty-six countries, twenty-four EU members states (Malta not being in the survey) as well as Norway and Iceland. The household survey consists of 202,978 households which is a total of 536,993 individuals. The sample sizes across countries range from 8,598 individuals in Iceland to 54,512 in Italy.
The Irish EU-SILC 2006 is the survey that is used to construct the Irish component of the Eurostat data set for EU-SILC and it is a much broader survey than the Eurostat EU-SILC. The sample size of the Irish SILC is of 5,836 households and 14,634 individuals.
8 Previous research suggests rather weak associations between the measures developed and
T
he income measure we employ throughout this publication is the annual total household disposable income adjusted for household size using the OECD modified equivalence scale for where we wish to make cross-country international comparison and the national equivalence scale where, as for example in Chapter 3, we wish to compare outcomes employing the procedures used by Eurostat to those applied by the CSO for national calculations using the Irish data set.9 The income reference period is thetwelve months prior to date of interview.
2.4
Income
Measurement
The specifically Irish data-set as constructed by the CSO and the EU-wide data-set as constructed by Eurostat use different definitions and measures of income. Three important differences must be kept in mind.
• The first relates to the fact that the EU definition of gross income does not include income from private pensions (pensions organised independently from an employer) while they are included in the national definition of income for Ireland.
• Second, in the EU definition of income all contributions to pension plans (expect those as defined earlier) are deducted from gross income when calculating disposable income. In the Irish national calculation of disposable income no such deductions from gross income are made.
• Finally, in the EU definition of income, employers’ social insurance contributions are not included while in the Irish national calculation they are included and deducted from gross income in the calculation of net income.
The most dramatic consequence of implanting these different procedures relates to the very different estimates they lead to in relation to ‘at risk of poverty’ levels for older people. This measure involves a different data count of the number of individuals that fall below 60 per cent of median equivalised income. For Ireland the ‘at risk of poverty’ rate for the population aged over 65 years is 27 per cent using the Eurostat EU-SILC 2006 while it is 14 per cent using the national Irish EU-SILC. The difference is accounted for by the different equivalence scale employed as well as the different definitions of income applied. In Ireland the national scale gives a weight of 1 to the first adult in the household then a weight of 0.66 to any subsequent adult and every child (aged 14+) is given a weight of 0.33 while the Modified OECD scale (used by Eurostat) attributes weights of 1, 0.5 and 0.3 respectively. The national scale thus produces a greater number of equivalent adults than the Modified OECD one. Scales giving a greater weight to each additional household member reduce the poverty rate of individuals in small household size (like elderly households) while increase the poverty rate of larger household (for example, households with children).
The other major factor affecting the poverty rate of the elderly is the different method of calculating the gross income mainly for two important components. The first difference relates to the fact that Eurostat does not include in gross income, pensions from individual private plans
9 The OECD modified scale gives a weight of 1 to the first adult (aged 14+), then 0.5 to
(independent of their current or former employers or government). Second, Eurostat deducts from gross income all contributions to pension plans (with the exception of the above) when calculating net income while in the Irish calculation no such deduction is applied. Of course, the Eurostat definitions have been applied consistently across countries so Ireland will not be the only country affected in this manner.
T
he EU-SILC data set contains a considerably narrower range ofdeprivation items than the ECHP. Given the available indicators we have focused on a sub-set of items covering, as will be seen, objective information relating to consumption, household facilities and neighbourhood environment. We excluded a number of other items relating to housing deterioration because the fact that in the more affluent countries deprivation levels were zero or close to zero creates difficulties to which we refer below. We also omitted indicators relating to health because particular difficulties arise in comparing the specific items available across the range of countries included in EU-SILC.
2.5
Deprivation
Items
Our analysis focuses on 17 deprivation items:
C
ONSUMPTIOND
EPRIVATION• Afford to pay unexpected required expenses.
• Week’s holiday away from home.
• Meals with meat, chicken, fish (or vegetarian)
• Can afford a PC?
• Arrears relating to mortgage payments, rent, utility bills, hire purchase.
• Inability to keep home adequately warm.
• Respondent for household can afford to have a car.
H
OUSEHOLDF
ACILITIES• Bath or shower in dwelling.
• Indoor toilet.
• Can afford a telephone?
• Can afford a colour TV?
• Can afford a washing machine?
N
EIGHBOURHOODE
NVIRONMENT• Pollution, grime or other environmental problems in the area
caused by traffic or industry.
• Noise from neighbours or noise from the street.
• Crime, violence or vandalism in the area.
• Rooms too dark, light problems.
• Leaking roof, damp walls/ceilings/floors/foundations, rot in
E
xploratory factor analysis led us to hypothesise that the underlying structure of deprivation could be best conceptualised in terms of three distinct but correlated dimensions:2.6
Analysing the
Structure of
Multiple
Deprivation
• Consumption deprivation comprising seven items ranging from ones that deal with current requirements such as food and heat to more general consumption items such as being able to afford a holiday, a car or a PC, as well as avoiding arrears on regular bills such as rent or utilities.
• Household facilities comprising five items that relate to permanent household facilities such as bath or shower and indoor toilet, and also includes being able to afford a telephone, a colour TV and a washing machine.
• Neighbourhood environment comprising three items relating to noise, pollution, crime and violence.
This preliminary analysis also suggested that the items relating to ‘insufficient light’ and ‘leaking roof’ do not seem to be associated with any distinct cluster of items; we, therefore, do not include either in the dimensions to be analysed (though we do employ the “leaking roof” item on its own to capture poor housing quality at a later stage in the analysis).
Table 2.1 reports the results of a confirmatory factor analysis for dichotomous items with these three factors.10 A confirmatory factory
analysis involves a prior specification of a factor structure or underlying dimensionality. In this case we have specified which items constitute elements of, for example, the consumption deprivation dimension and of that dimension only.
The factor loadings indicate which items best measure the underlying construct or in words discriminate most sharply between those who score high or low on the index. The items that most clearly define the distinctive nature of the consumption dimension are the holidays, inability to cope with unexpected expenses, and meal with meat, fish or chicken items with loadings on the first dimension ranging from 0.8-0.9. These provide a sense of the extent to which items correlate with the underlying dimension that we are attempting to capture. The loading falls to 0.7 for inability to keep the home warm and a PC, and the lowest value of about 0.6 is observed for arrears. On the household facilities dimension the bath or shower and indoor toilet items occupy the most prominent position, with loadings of close to 1, while for telephone, washing machine and TV the coefficients are about 0.8. Finally, on the neighbourhood environment dimension both noise and pollution load at a level close to 0.8 while the crime, violence or vandalism coefficient is somewhat lower at below 0.6.
Before going on to employ this structure, it is important to note that alternative formulations seeking to distinguish “basic” from “secondary” deprivation, a distinct dimension relating to poor quality housing, and somewhat different groupings of items have been employed in recent work for Eurostat (notably Guio and Macquet, 2007) and in earlier analyses of deprivation in the pre-enlargement EU based on the ECHP (e.g. Whelan et
al., 2001). However, the deprivation items currently included in EU-SILC are more limited than was the case with the ECHP and in our judgement it is necessary to operate with a more limited set of dimensions. The inclusion in the 2009 round of EU-SILC of a special module on material deprivation with a broader range of items will allow these issues to be pursued more satisfactorily. In the meantime, the structure outlined here can serve to demonstrate what can be learned about patterns of deprivation across the enlarged EU.
Table 2.1: Confirmatory Factor Analysis for EU-SILC 2006 Deprivation Items: Standardised Model Results
Consumption Housing
Facilities
Neighbourhood Environment
Week’s holiday away from home 0.889
Afford to pay unexpected required
expenses 0.824
Meals with meat, chicken, fish (or vegetarian)
0.786
Respondent for household can
afford to have a car 0.711
Inability to keep home adequately
warm 0.680
Afford a PC? 0.702
Arrears relating to mortgage payments, rent, utility bills, hire
purchase 0.565
Bath or shower in dwelling 0.981
Indoor toilet 0.969
Can afford a telephone? 0.840
Can afford a washing machine? 0.786
Can afford a colour TV? 0.757
Noise from neighbours or noise
from the street 0.797
Pollution, grime or other
environmental problems in the area caused by traffic or industry
0.817
Crime, violence or vandalism in
the area 0.560
In order to demonstrate the appropriateness of undertaking cross-national analysis involving these dimensions of deprivation, the next set of Figures sets out the value of Cronbach’s alpha reliability index11 across all
twenty-six countries on which the data were available, for the twenty-four EU Member States taken as a whole, for each individual country, and for five welfare regime clusters. A welfare regime can be understood as a particular constellation of social, political and economic arrangements which tend to nurture a particular welfare system, which in turn supports a particular pattern of stratification, and thus feeds back into its own stability. The central element of the approach employed by Esping-Andersen (1990) is the commodification-decommodification thesis. Decommodification
11 alpha=[Np/[1 + p(N-1)] where N is equal to the number of items and p is equal to the
arises when a resource or service is provided as a matter of right and is detached from reliance on the market.
Developing this thesis leads to distinguishing the following set of welfare regimes:
• The Social Democratic regime assigns the welfare state a substantial redistributive role, seeking to guarantee adequate economic resources independently of market or familial reliance. We have included Sweden, Denmark, Iceland, Finland, Norway and Netherlands in this cluster. 12
• The Corporatist regime involves less emphasis on redistribution and views welfare primarily as a mediator of group-based mutual aid and risk pooling, with rights to benefits depending on being already inserted in the labour market. This cluster includes Germany, Austria, Belgium, France and Luxembourg.
• The liberal regime acknowledges the primacy of the market and
confines the state to a residual welfare role, social benefits typically being subject to a means test and targeted on those failing in the market. Benefits are generally of a flat rate with maintenance of a relationship with pre-contingency earnings being dependent on a ‘second tier’ of employer arrangements. The UK and Ireland constitute this group.
• The Southern European regime with family support systems
playing a crucial role and the benefit system being uneven and minimalist in nature. This group comprises Cyprus, Greece, Italy, Portugal and Spain.
• The Post-communist group: while Alber et al. (2007) and Juhász (2006) note the difficulties in categorising the welfare regimes of these countries and the extent of variation across them, low levels of spending on social protection and weakness of social rights are
common.13 The Czech Republic, Estonia, Hungary, Latvia,
Lithuania, Poland, Slovenia and Slovakia are included in this cluster.
The welfare regime analysis presented in this publication is primarily of a descriptive nature and is used primarily as an aid to communicating information relating to the patterning of cross-national variation.
Each individual item can be thought of as tapping both the underlying dimension that we are trying to measure and a number of extraneous influences including measurement error. The Chronbach alpha reliability coefficients provide an indication of the extent to which the individual items can be seen to tap the same underlying dimension. The square root of Chronbach’s Alpha can be interpreted as the correlation between the current deprivation index and the theoretically perfect deprivation index made up of the infinite number of items that could be used to measure deprivation. In other words an alpha of 0.7 indicates a correlation of 0.84
between the measure based on the available items and the perfect
12 The proper allocation of the Netherlands is a matter for debate. We follow Aiginger and
Guger (2006) and Muffels and Fouarge (2004) in locating it in the social democratic cluster.
13 A number of authors including Bukodi and Róbert (2007) have distinguished Estonia,
measures. In Figure 2.1 focusing first on the consumption deprivation dimension, we find that at overall and EU-level the alpha value is 0.72. Relatively little variation is observed across welfare regimes, where alpha ranges from 0.67 to 0.73. Across countries, the lowest value of 0.51 is observed for Iceland and the highest of 0.74 for Belgium. The consumption deprivation dimension thus appears to be a reliable measure both within and between countries.
Figure 2.1: Cross National and Welfare Regime Variation in Reliability Levels for Consumption Deprivation, EU-SILC 2006
0 0.1 0.2 0.3 0.4
Social Democratic Iceland Denmark Sw eden Netherlands Finland Norw ay Liberal UK Ireland Corporatist Luxembourg Germany Austria France Belgium Southern Spain Portugal Cyprus Greece Italy Post-communist Estonia Slovenia Slovakia Lithuania Hungary Czech Republic Poland Latvia Total EU
0.5 0.6 0.7 0.8
of the household facilities items so low in more affluent countries/clusters that there is little variation.
Figure 2.2: Cross National and Welfare Regime Variation in Reliability Levels for Housing Facilities Deprivation, EU-SILC 2006
0 0.1 0.2 0.3
Social Democratic Netherlands Denmark Sw eden Iceland Norw ay Finland Liberal UK Ireland Corporatist Germany Austria France Belgium Luxembourg Southern Spain Greece Italy Cyprus Portugal Post-communist Czech Republic Estonia Slovakia Poland Latvia Slovenia Lithuania Hungary Total EU
0.4 0.5 0.6 0.7 0.8
Figure 2.3: Cross National and Welfare Regime Variation in Reliability Levels for Neighbourhood Environment Deprivation, EU-SILC 2006
0 0.1 0.2 0.3
Social Democratic Iceland Sw eden Netherlands Denmark Finland Norw ay Liberal UK Ireland Corporatist Austria Belgium France Germany Luxembourg Southern European Spain Portugal Cyprus Italy Greece Post-communist Estonia Slovenia Hungary Lithuania Latvia Poland Czech Republic Slovakia Total EU
0.4 0.5 0.6 0.7
Table 2.2 shows the correlations between the deprivation dimensions. The highest correlation is between the consumption and household facilities dimensions, at about 0.30; consumption and neighbourhood environment are only weakly correlated at about 0.1, while there is essentially no association between household facilities and neighbourhood environment. The table also shows the correlation between each dimension and the level of household income, “equivalised” to adjust for differences in household size and also adjusted to take account of differences in purchasing power across countries. Consumption deprivation is seen to be strongly associated with income with a correlation of -0.534, whereas this declines to -0.299 for household facilities and to -0.009 for neighbourhood environment.
Table 2.2: Correlations Matrix for EU Prevalence Weighted Deprivation Dimensions, EU-SILC 2006
Consumption Household
Facilities
Neighbourhood Environment
Log of PPS Equivalent Income
Consumption
Household Facilities 0.307
Neighbourhood
Environment 0.097 0.001
Log of PPS Equivalent
W
e now look at the variation across countries and clusters in deprivation on the three dimensions. The deprivation variables for this purpose are constructed by weighting each individual item by the proportion of households possessing that item across all the countries. Enforced lack of an item that is widely available/possessed across the EU is thus given more weight than deprivation of a less-widely available one – deprivation of an item such as a PC will be counted equally across the member states irrespective of their average living standards, from Estonia at one end of the average income scale to Luxembourg at the other. Scores are standardised to range between 0 and 1 by dividing the sum of the weighted deficits on all items by the sum of EU possession levels.2.7
Cross-National
Variation in
Levels of
Deprivation
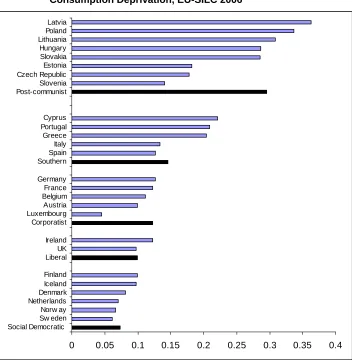
[image:36.595.171.523.400.764.2]Focusing first on consumption deprivation in Figure 2.4, we see that the mean score varies from 0.092 for the Social Democratic regime, 0.108 for the Liberal countries, 0.135 for the Corporatist group, 0.153 for the Southern European countries, and it then more than doubles to 0.333 for the Post-communist cluster. Within cluster, variation is relatively slight and consistent with expectations. Sweden displays the lowest level of 0.061 in the Social Democratic group and Finland the highest at 0.099. Luxembourg is an exceptional case in the Corporatist cluster with a value of 0.045. For the remaining countries the range runs from 0.099 for Austria to 0.127 for Germany. Italy and Spain display the lowest values in the Southern
Figure 2.4: Mean Deprivation Levels for EU Prevalence Weighted for Consumption Deprivation, EU-SILC 2006
0 0.05 0.1 0.15 0.2 0.25 0.3 0.35 0.4
European cluster with respective values of 0.127 and 0.134 while the remaining values are all in excess of 0.200. Within the Liberal cluster the Irish value of 0.123 is slightly higher than that of 0.097 observed for the UK. Slovenia, the Czech Republic and Estonia have the lowest values in the Post-communist group ranging between 0.141 and 0.178 respectively. For the remaining countries the range runs from 0.285 in Slovakia to 0.363 in Latvia. Cross country variation accounts for about 17 per cent of the variance.
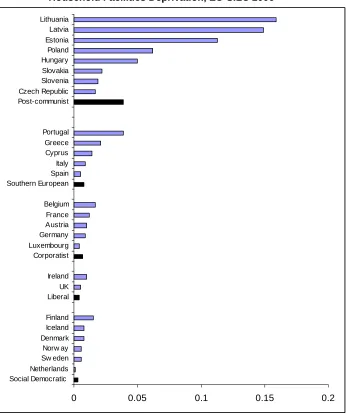
[image:37.595.172.518.315.730.2]In the case of household facilities, cross-country variance accounts for 10 per cent of the total variance. In Figure 2.5 we see that the major contrast is now between the Post-communist cluster – with mean deprivation level of 0.058 – and all the other countries, where it is 0.011 or below. The highest levels within the Post-communist cluster are found for Estonia, Latvia and Lithuania, and within the Southern European group for Greece and Portugal. The Irish value of 0.010 is again slightly higher than that of 0.005 observed for the UK.
Figure 2.5: Mean Deprivation Levels for EU Prevalence Weighted for Household Facilities Deprivation, EU-SILC 2006
0 0.05 0.1 0.15 0.2
Turning to neighbourhood environment in Figure 2.6, there is substantially less variation across countries, accounting for only 2 per cent of total variance. The lowest mean level of 0.158 is observed for the Social Democratic regime, for the Liberal group the mean is 0.217, for the Corporatist group 0.193 and for the Southern European group 0.203 and for the Communist cluster 0.169. The full range of national variation runs from 0.084 in Iceland to 0.224 in Latvia. In this case the Irish value of 0.132 is lower than that of 0.211 observed for the UK.
Figure 2.6: Mean Deprivation Levels for EU Prevalence Weighted for Neighbourhood Environment, EU-SILC 2006
0 0.05 0.1 0.15
Social Democratic Iceland Norw ay Sw eden Denmark Finland Netherlands Liberal Ireland UK Corporatist Austria France Luxembourg Belgium Germany Southern Greece Portugal Italy Spain Cyprus Post-communist Hungary Lithuania Poland Slovenia Slovakia Czech Republic Estonia Latvia
0.2 0.25 0.3
Figure 2.7: Percentages Experiencing Housing Deterioration with Leaking Roof, EU-SILC 2006
0 5 10 15 20
Social Democratic Finland Sw eden Norw ay Denmark Iceland Netherlands Liberal UK Ireland Corporatist Austria France Belgium Luxembourg Germany Southern Spain Portugal Greece Italy Cyprus Post-communist Slovakia Czech Republic Slovenia Estonia Hungary Lithuania Latvia Poland
25 30 35 40 45
A further sharp increase to 33.7 per cent is then observed for the Post-communist countries. Within this group Slovakia has an extremely low value of 6.6 per cent. Slovenia and the Czech Republic have below average levels of just above 20 per cent. For Estonia it rises to 24 per cent and the remaining countries are found in the range running from 27 per cent in Hungary to 41 per cent in Poland. This suggests that a set of items designed to capture housing deterioration – rather than the single item currently available – would highlight the particularly disadvantaged situation of the Southern European countries and, most particularly, the Post-communist group.