A COMPILATION OF CURRENT AND TEMPERATURE DATA FROM MOORED INSTRUMENTS DURING INDEX 1979,
RRS DISCOVERY
D.R. OUADFASEL
DATA REPORT 19 1980
INSTITUTE OF aCEAIMOQRAPHIC SCIENCES
%
\
zINSTITUTE OF OCEANOGRAPHIC SCIENCES
Worm ley, Godalming, Surrey, GU8 SUB.
(0428 - 79 - 4141)
(Director: Dr. A.S. Laughton)
Bidston Observatory, Birkenhead,
Merseyside, L43 7RA. (051 - 653 - 8633)
Crossway, Taunton,
Somerset, TA1 2DW. (0823 - 86211)
(Assistant Director: Dr. D.E. Cartwright) (Assistant Director: M.J. Tucker)
On citing this report in a bibliography the reference should be followed by the words UNPUBLISHED MANUSCRIPT.
A COMPILATIOJ OF CURRENT AND TEMPERATURE DATA FROM MOORED INSTRUMENTS DURING INDEX 1979,
R.R.S DISCOVERY
D.R. QUADFASEL
Data Report: 19
1980
1
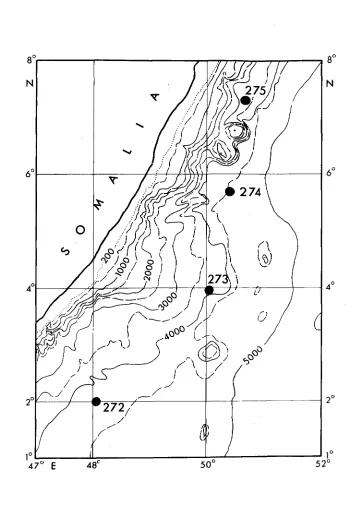
As part of the Global Weather Experiment (FGGE) a multiship oceanographic survey
of the western Indian Ocean was carried out between March and September 1979. The
general aim of this experiment and some preliminary results have been described by
Swallow (1980). The British contribution to INDEX was a two month cruise of RRS
Discovery between 10 May and 6 July 1979 (I.O.S. cruise report, No. 83, 1979) .
Besides the ship-board measurements an array of four current meter systems was
moored off the Somali coast in water depths between 3300 and 4500 m for just over
one month. The self-recording instruments were deployed at nominal depths of 200,
500, 700 and 2000 m which were chosen in relation to the levels of the westward
equatorial jets (Luyten and Swallow, 1976). The observed mean depths of
instru-ments were however some 100-200 m greater than intended. In this report
oceano-graphic data obtained with the moored instruments are presented in a oceano-graphical form.
Basic statistics are also given. Some preliminary results on the kinematics of the
Somali Current system based on these observations have been published by Schott and
Quadfasel (1980).
The four moorings (272-275 in Fig. 1) contained four Aanderaa RCM-4 current
meters each, except for 275 (only 3 c.m.). The moorings were taut wire systems
with a steel sphere 10 m above the top instrument as the only buoyancy. Only 275
had additional back-up buoyancy above the acoustic release system.
The accuracy of the Aanderaa current meters as specified by the manufacturer are
+ 2% for the speed value, _+ 2 degrees for direction, H- 0.1°C for temperature and
2 dbar for pressure.
Most of the instruments deployed had a 100% data return, the amount of spiky
values which had to be replaced by linear interpolation between neighbouring values
was less than 1%. Only on three current meters severe problems occured reducing
the quality of data substantially:
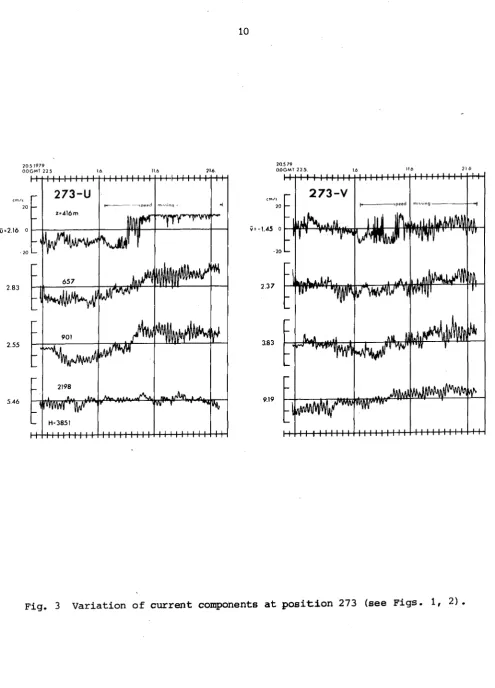
(a) Mooring 273 (417 m) ;
The rotor was lost after 11 days of recording on 2 June. For the
analysis and plots of this record an artificial constant speed of
15 cm/s was used during the second half of the record to show at
least the directional signal.
(b) Mooring 2 73 (2198 m) :
The compass of this instrument was cut short for altogether 25% of
the recording time. Single gaps were up to 5 hours long and occured
more frequently at the end of the recording time. These gaps were
linearly interpolated between neighbouring values. For analysis of
used, however, in the long periodic fluctuations (>2d) the errors
are negligible.
(c) Mooring 275 (2142 m):
The magnetic tape was not decodable due to a slipping capstan in
the recording unit. The record is completely lost.
No attempt has been made to correct the recorded current speeds and directions
for horizontal mooring motion. Some statistical information about the records is
given in Table 1, the data are also presented graphically in different ways, using
the following abbreviations:
U - East component of current, cm/s
V - North " " " cm/s
T - Temperature °C
P - Pressure dbar
1. U,V,T,P as time series.
All time series are based on 1 hourly mean values. They are presented
as deviations from the overall mean which is indicated on the left of
the zero-line in each case.
2. U,V combined to progressive vector diagrams.
The plots are based on 1 hourly mean values, tickmarks are every day.
3. U,V combined for stickplots.
The time series of 1 hourly mean values was low pass filtered and
every sixth value is presented. Filter type: Lanczos taper, half
power frequency 30 h. No. of weights: 30, Amplitude reduction at
24.8 h: 0.26, at 12.4 h: 0.01.
4. The statistics given in Table 1 are based on 1 hourly mean values.
ACKNOWLEDGEMENTS
The help of Mr I. Waddington and captain and crew of RRS Discovery during
deploy-ment and retrieval of the moorings is highly appreciated.
REFERENCES
I.O.S. Cruise Report No. 83, 1979. Physical oceanographic studies in the western
equatorial Indian Ocean: a contribution to the FGGE oceanographic programme.
Luyten, J.R. and J.C. Swallow, 1976. Equatorial undercurrents. Deep-Sea Res. 23,
999-1001.
Schott, F. and D.R. Quadfasel, 1980. Development of the subsurface currents of
3
Swallow, J.C., 1980. Response of the western Equatorial Indian Ocean to the
monsoon winds: observations during the Global Weather Experiment,Science,
Table la
MOORING NO.: 272 BOTTOM D E P T H : 2*21 5 m
POSITION: jg) = 2°00.2'N ^ = 2i8°02.7'E
START: 17.05. 1979, 16.00 G M T STOP: 1 9 . 0 6 . 1979, O7.OO GMT = 10 m i n
D E P T H
(m)
PAR M E A N V A R I A N C E STD
DEV. M I N M A X
VECTOR M E A N
DIR
M E A N INSTR
3 0 5 u . 8 9 2 6 . 6 9 5 . 1 7 - 1 4 . 7 5 11 . 9 3 2 . 2 2 1 5 6 . 3 A-VTP
V = 2 .02+ 2 5 . 9 6 5 . 0 9 - 1 2 * . 2 6 1 2 . 0 4
T 11 . 7 7 . 0 2 . 1 2 , 11 .2*3 1 2 . 2 3
P 3 0 5 . 1 9 . 6 3 . 1 3 0 0 . 1 3 1 4 . 3
6 0 7 u 9 . 2 6 62*. 8 5 8 . 0 5 - 1 7 . 2 3 3 0 . 5 0 1 2 . 6 5 4 7 . 0 A - V T V 8 . 6 2 3 2 . 0 5 5 . 6 6 - 2 . 6 5 2 4 . 4 1
T 8 . 8 9 . 0 2 . 1 3 8 . 6 6 9 . 5 0
8 5 9 U - . 3 9 1 5 . 9 0 3 . 9 9 - 1 3 . 9 5 1 0 . 0 7 1 . 9 5 3 4 8 . 4 A-VT
V 1 . 9 1 3 1 . 9 4 5 . 6 5 - 9 . 2 7 1 7 . 8 7
T 7 . 5 9 . 0 2 . 1 2 7 . 2 2 * 8 . 1 0
2 1 6 6 U - 2 . 8 1 1 7 . 6 7 24.20 - 1 2 . 1 5 7 . 4 7 3 . 7 7 2 2 8 . 3 A - V T
V - 2 . 5 1 1 2 . 4 7 3 . 5 3 -10.74 9 . 2 2
Table lb.
MOORING NO.: 273 BOTTOM D E P T H ; 3851 m
POSITION: 0 = 3°57.2'N ?V = 5 0 * 0 3 . 3 E
START: 21.05.1979, 13 . 0 0 G M T STOP: 22.06.1979, 12.00 GMT A t = 10 m i n
REMARKS; TOP I N S T R . ROTOR L O S T O N 2 J U N E
DEEP INSTR„ PARTLY COMPASS SHORT C U T
DEPTH (m)
PAR M E A N V A R I A N C E STD
DEV„ M I N M A X
VECTOR M E A N
DIR
M E A N INSTR
U 2 . 1 6 128.91 1 1 . 3 5 - 1 8 . 9 6 1 4 . 9 9 2 . 6 0 1 2 3 . 9 A - V T P V - 1 . 4 5 3 8 . 7 3 6 . 2 2 - 1 4 . 9 6 1 2 . 8 7
T 10.52 .18 .43 9 . 6 5 1 1 .82
P 4 1 6 . 0 2 5 3 5 , 5 5 0 . 4 3 7 6 . 2 5 6 6 . 9
U * - 7 . 8 9 1 2 . 9 1 3 . 5 9 - 1 8. 9 6 . 7 5 7 . 9 1 2 6 7 . 0
V * -.41 1 9 . 7 8 4 . 4 5 - 1 2 . 5 9 1 2 . 8 5
6 5 7 U 2 . 8 3 1 0 3 . 7 8 1 0 . 1 9 - 1 6 . 4 9 2 3 . 5 4 3 . 6 9 50. 1 A - V T V 2 . 3 7 3 0 . 9 3 5 . 5 6 - 1 2 . 6 1 1 7. 0 2
T 9 . 3 9 . 0 5 . 2 1 8.54 9 . 8 1
9 0 1 U 2 . 5 5 1 0 2 . 5 3 1 0 . 1 3 - 1 7 . 2 7 2 3 . 3 5 4 . 5 9 3 3 . 7 A - V T V 3 . 8 3 4 7 . 7 2 6 . 9 1 - 1 1 . 7 5 2 6 . 8 2
T 8 . 2 0 . 2 5 . 4 9 6 . 6 1 9 . 0 9
2 1 9 8 U 5 . 4 6 8 . 7 3 2 . 9 5 - 4 . 2 1 1 3 . 5 9 1 0 . 6 9 3 0 . 7 A - V T
V 9 . 1 9 3 9 . 6 7 6 . 3 0 - 7 . 2 0 21 .97
T 2 . 2 2 . 0 0 4 . 0 6 2 . 0 7 2 . 3 2
Table 1c.
MOORING NO. : 27k BOTTOM DEPTH: h5k'2. m
POSITION: 0 = 5''^0.7'N 50" 23. 8'E
START: 2 5 . 0 5 . 1 9 7 9 04.00 G M T STOP: 2 5 . 0 6 . 1 9 7 9 09.00 GMT /v t = 10 m i n
STD '
M I N M A X V E C T O R DIR INSTR
DEPTH (m)
PAR M E A N V A R I A N C E
DEV. M I N M A X M E A N M E A N INSTR
DEPTH (m)
3 5 7 U 1 . 1 8 5 8 . 0 5 7 . 6 2 - 1 3 . 5 2 21 . 2 5
1 . 2 9 6 6 . 3 A - V T P
V . 5 2 3 5 4 . 5 8 1 8 . 8 3 - 2 5 . 0 9 41 . 8 5 1 . 2 9 6 6 . 3
T 1 1 . 5 7 . 4 9 . 7 0 9 . 8 7 1 2 . 9 9
P 3 5 6 . 6 1 8 2 2 . 3 4 2 . 7 3 0 0 . 9 4 6 8 . 8
651 U 6 . 0 0 1 6 9 . 5 5 1 3 . 0 2 - 1 8 . 4 5 3 2 . 9 2
7.45 1 2 6 . 2 A - V T
V - 4 . 4 0 4 4 8 . 2 4 2 1 . 1 7 - 3 3 . 0 1 4 0 . 1 3 7.45
T 9 . 7 5 . 2 4 . 4 9 8 . 5 0 1 0 . 9 5
9 0 9 U - 2 . ] 2 1 7 2 . 4 5 1 3 . 1 3 - 2 6 , 6 8 2 8 . 7 7
2 . 3 4 2 7 8 . 2 A - V T
V .33 1 9 2 . 9 9 1 3 . 8 9 - 3 2 . 9 1 3 0 . 2 6 2 . 3 4 2 7 8 . 2
T 8 . 0 4 . 4 2 . 6 5 6 . 5 5 9.45
2204 U - 4 . 3 2 3 2 . 8 0 5 . 7 3 - 1 3 . 8 8 7 . 8 6
4 . 46 255.4 A - V T
V - 1 . 1 2 2 7 . 0 2 5 . 2 0 -12.53 10.44 4 . 46 255.4
T a b l e Id.
M O O R I N G NO.: 275 BOTTOM DEPTH 3335 m
POSITION; 0 = 7°17.8'N X = 50''39.22'E
START; 28.05.1979, 06.00 GMT STOP: 28.06.1978 13.00 GMT At = 10 m i n
REMARKS: T A P E OF D E E P INSTR. N O T D E C O D A B L E
D E P T H (m)
PAR M E A N V A R I A N C E STD
DEV. M I N M A X
VECTOR M E A N
DIR
M E A N INSTR
2 6 7
8 2 0
U V T P U V T
- 1 . 0 6 5 . 6 9 1 3 . 2 9 2 6 7 . 4
- 4 . 6 7 - . 1 2
9 . 1 7
7 9 . 8 0 2 0 8 . 8 9
.57
1 4 9 5 . 6 2 3 0 . 3 7
8 5 . 9 0 . 2 2
8 . 9 3 1 4 . 4 5 . 7 5 3 8 . 7 1 5 . 1 8
9 . 2 7
.47
- 2 1 . 8 2 - 1 6 . 4 9 1 1 . 2 3 2 4 1 . 6 - 3 5 . 0 0 - 2 4 . 7 9 7 . 6 6
2 0 . 3 3 5 0 . 5 2 1 5 . 0 5 4 0 9. 5
4 6 , 0 1
18.45
1 0 . 1 3
5 . 7 9
4 . 6 7
3 4 9 . 5
2 6 8 . ^
A-VTP
47° E
[image:11.599.119.473.118.638.2]1 6 5 1 9 7 9 O D O M T 2 2 5 .
1 6 3 1 9 7 9 O D G M T 2 2 6
U=0.89 0
9.26
-0.39
- 2 8 1
1 1 1 1 1 1 1 1 1 1 1 1 1 1 1
2 7 2 - U
z=305m
1 1 1 1 1 1 1 1 1 1 1 1 1 M 1 1
L R.I • HJII
n (fMliyifMMMIflllll
607
ffTiur' " V f F V ^ '
iMiA 1 Uklnii f
859
- f\|WvyM\/i
2166
1 1 1 1 1 1 H=4215
1 1 1 1 1 1 1 1 1 1 11 1 11 1 1 1 1 1 1 1 1 1 1 1
v = - 2 I W 0
&62
1.91
- 2 51
M 1 1 1 1
Vll,
M M 1 1 1 1 1 2 7 2 - V
111111111
A l & i l W W
1 1 1 1 1 1 1 1
W L i W - V \ ,
- » A A
'flKMrfVW;
111111 111111111 1 1 1 1 1 1 1 1 1 11111111
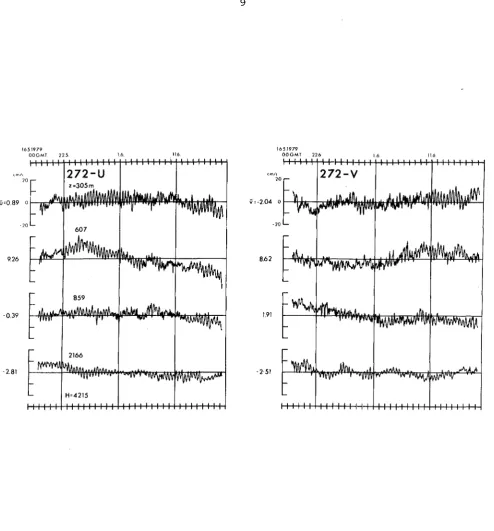
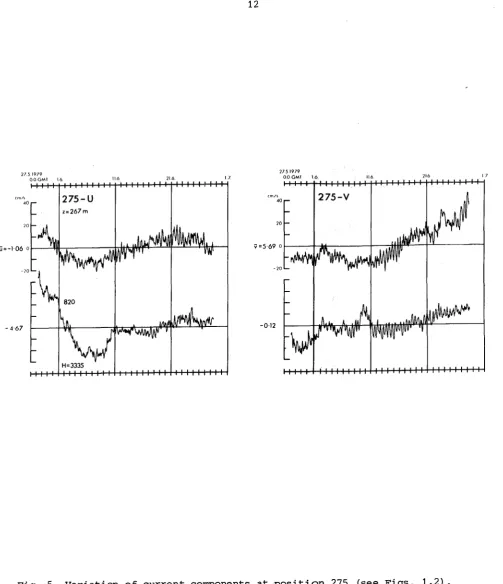
Fig. 2 Variation of east - (u) and north - (v) component of current from
their mean value at position 272 (see Fig. 1). H = bottom depth
[image:12.598.34.529.58.590.2]10
u - 2 . t 6 0
2 83
2.55
5.46
H - 1 1 11 1 11 1 1 •
P 2 7 3 - U
z»416m
1 1 1 1 1 1 1 1 1
iir
I 1 1 1 M 1 M H
-657
vJ1
l l l l f i i W
901 j A w
-2198
k yV| _ \ f W V
H=3851
H - 111111111 111111111 111111111 h
H
-v = -l,45 0
2.37
3.83
9.19
1 1 1 1 1 1 1 1 1 1 1 1
2 7 3 - V
1 1 1 1 1 1 1 1 1
111
1 1 1 1 1 1 1 1 1 H
-i. 1 lAt
' " 'II'
i
p ( f | i i'
I
H - 1 1 1 1 1 1 1 1 1 111111111 • 111111111 1 11
[image:13.602.47.543.31.720.2]11
0 = 1.18 0 •
6.00
-2.32
-4.32
H 1 1 1 1 1 1 -H 1 1 1 1 1 1 1
2 7 4 - U
z=357m
/ V
ft 1 1 1 1 1 1 1• ' 1 1 1 1 1 1
K ii/
/f Tf
V t
651 mf
,, ,rV
f w
V
uAu;
y
"
909 y
wii l y
f\i/r
2204 J
1-1 1 1 1 1 1 1 HM542
1 1 1 1 1 1 1 1 1 1 M l
1 1 1 1 1 1 1 1 1 1111 n
v-0.52 0
-4.40
0.33
-1.12
I l i u m 1 1 1 1 1 1 1 1 H
2 7 4 - V
11111IIII
y
11 II 1 1i /
'/IIP
V
1
111II1II 111111II1
'y
• 1111111II 1II11 1
[image:14.606.43.541.76.570.2]12
2 7 . 5 1 9 7 9
00 GM! (6. 116 216
1 I t I I I I I I I I I I I I I I I I I I I I I I I I I I I I I I I I
u = -106 0
- 4 67
I I I I I
2 7 5 - U
z= 267 m
820
H=3335
I I I I I I I - l - f I I I I I I I I I I I I I I I I I I
2 7 5 1 9 7 9
00 GMT 16
V" 5 69 0
- 0 1 2
M i l l - 1 1 1 1 1 I I 1 H
2 7 5 - V
-11 I I 1 1 1 1 1 1 1 1 1 1 ! 1 1 1
y
- r M llAi'in. "ii ilJl
' V
M i l l
p \ l w
I I 1 I I I I I I
llffllf r ^
1 1 1 1 1 1 I I I - 1 I I I I 1 1 I I
[image:15.599.41.545.59.644.2]13
16 5 1 9 7 9 0 0 G M T 22 5 - 1 0 0
- 5 0
p=305.1 0
T=11.77 0
8.89
759
2.53
111111 1 1 1 1 1 1 1 1 1
272-?
1 1 1 1 1 1 1 1 1 1 1 1 1 1 1 1 1
— 2 7 2 - T z»305m
607
859 iWyvvv"
2166
1 1 1 1 1 1 H=42t5
1 1 1 1 1 1 1 1 1 1 1 1 1 1 1 1 1 1 1 1 1 1 1 1 1 1
Fig. 6 Variation of pressure (p) and temperature (T) from their nrean
value at position 272 (see Fig. 1). H = bottom depth, z =
instrument depth, p = mean value of p, T = mean value of T.
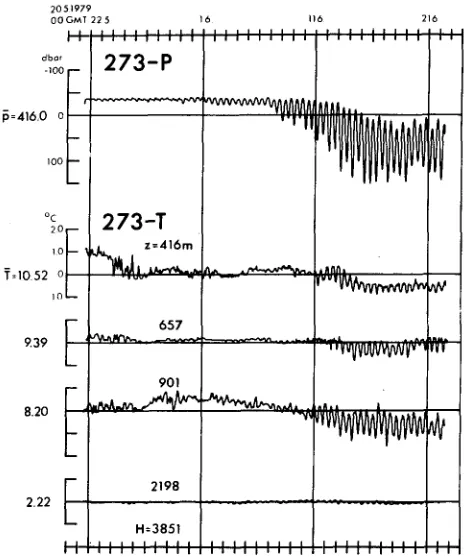
2051979
O O C M T 2 2 )
p = 416,0 0
T . 1 0 5 2 0
9.39
8.20
222
H- 1 1 1 1 1 1 1 1 1
272-?
1 1 1 1 1 1 1 1 1
-VWVWVAM/VVIAIIM/I
1 1 M 1 M 1 1
-H-- \
272-1
z = 416m
''I'll
(
-657
''^^•^'Wvvvv/vvv^
rtt
901
"•iVvvpvvifWr^ wv
2198
H-H=385t
1 1 1 1 1 1 1 1 1 1 1 1 1 1 1 1 1 1 111111111
[image:16.600.137.425.65.288.2] [image:16.600.135.369.375.654.2]14
0 0 G M T 1 6
8.04
2.44
M M 1 1 M 11111 1111
274-P
1 1 1 1 1 1 1 1 1 1 1 1 1 1
1-274-T z = 357m
i i n
JIAttM
651
' IV
il U/tltfl
909
1. A
2204
1111111 1 H M 5 4 2
1 1 1 1 1 1 1 1 1 1 1 1 1 1 1 1 1 1 1 1 1 1 M 1
Fig. 8 Variation of pressure and temperature at position 274 (see Figs. 1,5)
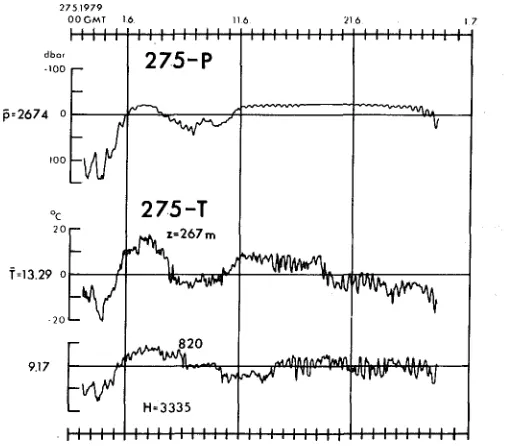
2 7 5 1 9 7 9
00 GMT 16
p=2674 0
T'13.29 0
9.17
M i l l 1 1 1 1 1 1 1 1 1
275-P
I I 1 1 1 1 1 1 1 1 I I 1 1 1 1 1 1
V
- /
275-Ttv
J
-\A/
1 I I I I
I r
H=3335
1 1 I I 1 1 1 1 1 ^ . y x / T n t l "
1 M 1 1 1 I I 1 1 1 1 1 1 1 1 I I
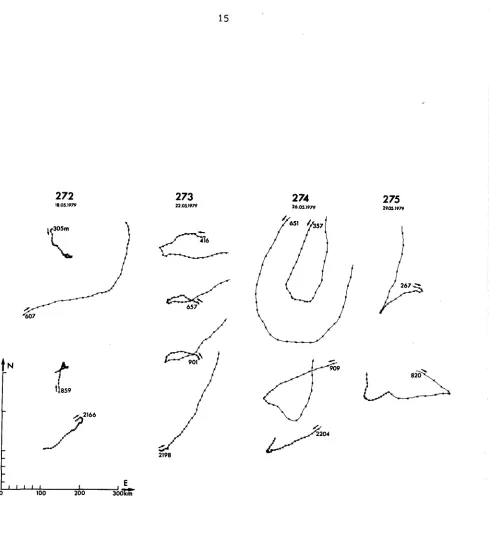
[image:17.598.108.472.58.372.2] [image:17.598.128.382.432.655.2]15
272
>8.05.1979
305 m
'N
2166
273
22.05.1979 274 26.05.1979
416
901
909
2198
275
29.05.1979
2198
I I I I I
300km
100 200
274 and 275 Station No. Fig. 10 Progressive Vector diagrams for positions 272, 273,
(see Fig. 1). Tickmarks are every day 0000 GtfT.
and date of first tickmark are given on top of each column.
[image:18.599.73.562.42.584.2]16
1 1 1 1 1 1 272
z= 305m
1 1 1 1 1 M 1 1 M M M 1 1 1 M 1 1 M M 1
607
'dWiuikk
859 l i i i i
2166 H=42I5
1 1 1 M 1 1 1 1 1 1 1 M 1 1 1 1 1 1 1 1 1 M 1 1 1 6 . 5 1 9 7 9 2 2 . 5 .
O O G M T 0 ( m / \ 5 0 1 I I I I I
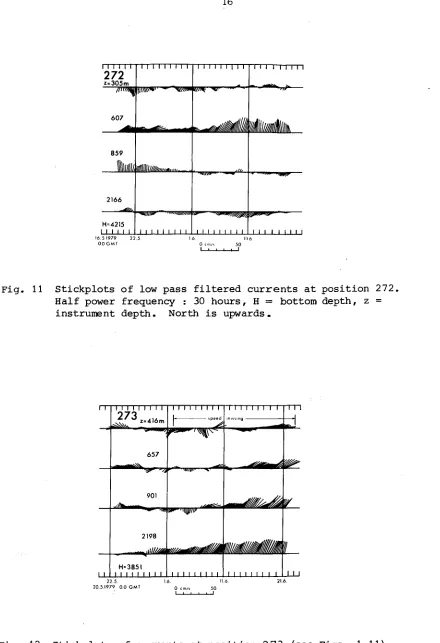
Fig. 11 Stickplots of low pass filtered currents at position 272, Half power frequency : 30 hours, H = bottom depth, z = instrument depth. North is upwards.
I I I I I I I I I
z=416m
I I I I I I I I I
I
-I -I -I -I -I -I -I I I
m i s s i n g
T n
\r-657
901
H " 3 8 5 1
I I I M I I I 2 2 . 5 .
2 0 . 5 1 9 7 9 0 . 0 G M T
[image:19.597.80.520.57.700.2]17
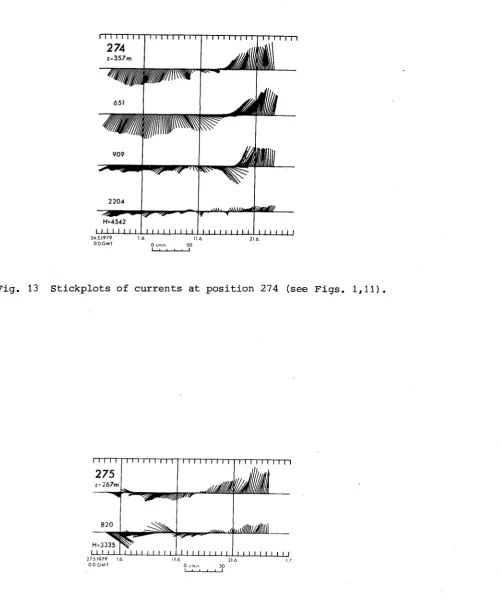
274
z=357m
2204
mumA'mm.
H=4542
I I I I I I I I I I I I I I I I I
2 4 . 3 . 1 9 7 9 1 . 6
OX) GMT 0 cm/» 5 0
Fig. 13 Stickplots of currents at position 274 (see Figs. 1,11)
I I I I I
275
z" 267m
M I I I I i I I I I I I I I I I M I I M I I I I I I I
H.3J35
Ml M I I I I I I I I I M ( I t t I I I t 1 I >
\\\llllml/A
' ' ' M i I I I I 2 7 5 1 9 7 9 1.6.
0 0 G M T 0 c m / s 5 0
[image:20.598.56.559.73.683.2]