A Novel Self Adaptive Modification Approach Based on
Bat Algorithm for Optimal Management of Renewable MG
Aliasghar Baziar*, Abdollah Kavoosi-Fard, Jafar Zare
Department of Electrical Engineering, Sarvestan Branch, Islamic Azad University, Sarvestan, Iran. Email: *[email protected], [email protected], [email protected]
Received October 13th, 2012; revised January 18th, 2013; accepted January 25th, 2013
ABSTRACT
In the new competitive electricity market, the accurate operation management of Micro-Grid (MG) with various types of renewable power sources (RES) can be an effective approach to supply the electrical consumers more reliably and economically. In this regard, this paper proposes a novel solution methodology based on bat algorithm to solve the op- timal energy management of MG including several RESs with the back-up of Fuel Cell (FC), Wind Turbine (WT), Photovoltaics (PV), Micro Turbine (MT) as well as storage devices to meet the energy mismatch. The problem is for- mulated as a nonlinear constraint optimization problem to minimize the total cost of the grid and RESs, simultaneously. In addition, the problem considers the interactive effects of MG and utility in a 24-hour time interval which would in- crease the complexity of the problem from the optimization point of view more severely. The proposed optimization technique is consisted of a self adaptive modification method compromised of two modification methods based on bat algorithm to explore the total search space globally. The superiority of the proposed method over the other well-known algorithms is demonstrated through a typical renewable MG as the test system.
Keywords: Renewable Micro-Grid (MG); Renewable Power Sources (RESs); Self Adaptive Modified Bat Algorithm
(SAMBA); Nonlinear Constraint Optimization
1. Introduction
In recent years, high utilization of renewable power sources (RESs) in the form of distributed generations (DGs) has experienced rapid growth especially in the voltage level of distribution networks. Some of the main benefits of using RESs can be named as lower cost, cleaner power generation mechanism, more reliability, better power quality, high flexibility, etc. [1]. However, from the operation management point of view, the high penetration of renewable DGs can bring some unwanted challenges which a significant part is covered in the form of Micro-Grid (MG) problem. MG problem is defined as the aggregation of DGs, electrical loads and generation interconnected among themselves and with the distribu- tion network as well [2]. In the area of MG operation ma- nagement, the solution techniques are experiencing con- tinuous changing so that to keep these networks at the optimal operating point and control with different targets. In this regard, in recent years, several researches have been implemented to investigate the MG problem under different loading with different targets.
In [3], the author studied the recent progresses in the
eration management problem properly. Especially, con- sidering different types of RESs such as Photovoltaics (PV), Fuel Cells (FCs), Wind Turbines (WTs), Micro Turbines (MTs), etc. as well as the storage devices can in- crease this complexity more than before. In addition, since most of the MGs are in alternation with the above network, the problem should be studies in the grid-con- nected mode which can result in a competitive electrical market. This situation dictates the necessary of new re- searches to find more reliable and powerful solution methodologies to handle the renewable MG appropri- ately.
According to the above discussion, this paper proposes a new solution methodology based on bat algorithm to investigate the optimal management of MG from the energy cost point of view. The bat algorithm is a popula- tion based metaheuristic optimization algorithm which was first inspired from the behavior of the bat animals to find food. The existence of some especial characteristics such as simple concept, easy implementation, the ability to both local and global, etc. makes the BA as suitable optimization tool. The MG investigated is consisted of several RESs with the back-up of FC, WT, PV, MT as well as storage devices to preserve the required energy mismatch. In this regard, the problem is formulated in a 24-hour time interval (next day) considering the inter- active effect of the utility and MG on each other at each hour during the day. In order to see the constructive role of storage devices on the renewable MG operating mode, Nickel-Metal-Hydride Battery (NiMH-Battery) is also considered in the problem. In order to escape from pre- mature convergence as well as the existing local optimal solution in the problem, a new self adaptive modification approach is proposed sufficiently. The proposed self adaptive modification technique is consisted of two sub- modification method which each of them can be chosen by each bat according to its positive influence. In order to see the superiority of the proposed method over the other well-known methods in the area, a typical renewable MG is considered as the test system.
2. Problem Formulation
In this section, the objective function and the relevant constraints are discussed sufficiently.
2.1. Objective Function
The operation management problem of a typical MG is defined as the problem of allocating optimal power gene- ration set points as well as suitable ON or OFF states of RESs/DGs in the situation that the operating cost of the MG inside the grid are minimized while satisfying seve- ral equality and inequality constraints [12]. The total en- ergy cost is consisted of the fuel cost for DGs, the start
up and shut down cost and the cost of power exchange between the utility and the MG. The cost objective func- tion tries the adjust the optimal power output of the RESs and the utility (as the upper network) as well as the ON/OFF statuses of all DGs. Therefore, the mathematic- cal formulation of the cost objective function is as fol- lows:
1 1 1 1 Min Cost 1 1 g T t t N Ti Gi Gi Gi i i
t i Ns
j sj sj sj j j
j
Grid Grid
f X
u t p t B t S u t u t
u t p t B t S u t u t
p t B t
(1)where BGi(t) is the ith DG bid at time t; X is the state
va-riables vector; BSj(t) is the jth storage device bid at time t;
SSj(t) is the Start-up/Shut down cost of jth storage device
at time t; SGi(t) is the Start-up/Shut down cost of ith DG at
time t; pgrid(t)is the Active power bought (sold) from (to)
the utility at time t; Bgrid(t)is the utility bid at time t; Ui(t)
is the State of the ith unit denoting ON/OFF statuses; N g
is the number of generating units; Ns is the Number of
storage devices; T is the Number of time intervals; PG,i(t)
is the active power production of ith power unit at time t.
In the above equation, X is the control vector which in- cludes the output power generation of all units and their relevant ON/OFF statues as follows:
1 2
,1 ,2 ,
,1 ,2 ,
, , , ,
, , , ,
1 2
, ; 1
, ; [ , , , ]
, , ,
1 , 2 , , ; 1, 2, ,
1 , 2 , , ; 1, 2, , 1
, , , , 1
g
s
g g nT g s
g G s G G G G N
s s s s N
s j s j s j s j s
G i G i G i G i g
g n k k
X P U n N N
P P P P P P P
P P P P
P P P P T j N
P P P P T i N
U u u u u u
,
2 , ,
; 1, ,k k
u u T
k n (2) where Pg is the vector including the power generation of
all units; Ug is the vector including ON/OFF statuses of
all units; n is the number of the state variables. Also, uk(t)
= 0 & uk(t) = 1 show the OFF & ON status of kth power
unit at time t, respectively.
2.2. Problem Constraints
tion constraints which are described bellow.
2.2.1. DG and Storage Devices Generation
Each power unit can generate in the range of its nominal power generation maximum and minimum capacity as follows:
,min ,max ,min ,maxgrid,min Grid grid,max
Gi Gi Gi
sj sj sj
P t P t P t
P t P t P t
P t P t P
t
1
(3)
where PG,i,min(t)is the minimum active power production
of ith power unit at t; P
G,i,max(t) is the maximum active
power production of ith power unit at t ; P
s,j,min(t) is the
minimum active power production of jth storage device at
t; Ps,j,max(t) is the maximum active power production of jth
storage device; PGrid,min(t) is the minimum active power
production of the grid at t; PGrid,max(t) is the maximum
active power production of the grid at t.
2.2.2. Load and Power Balance
The total amount of power produced by the power units and storage devices should supply all electrical loads as follows:
,
Grid
,
1
, 1
L
g Ns N
s j L l
j l
N G i i
P t P t P t P t
(4)where PL,l(t) is the amount of lth load value at time t and
NL is the number of loads.
2.2.3. Battery Charging/Discharging Limits
Battery as the storage device is able to supply loads at each hour. However, the amount of power which is pro- duced by the battery at each hour is limited to the amount of energy which is stored in it in the last hours. This li-mitation is preserved at each time interval as follows:
dischargecharge charge
discharge 1
ess ess
P t
W t W t P t
(5)
,min ,max charge charge,max discharge discharge,maxess ess ess
W W t W
P t P
P t P
(6)
where Wess(t) is the amount of stored energy inside the
battery at time t; Wess,max is the maximum stored energy
inside the battery; Wess,minis the minimum stored energy
inside the battery; Pcharge is the permitted rate of charge
during a finite time period (∆t); Pdischarge is the permitted
rate of discharge during a finite time period (∆t); ηcharge is
the battery efficiency during charge period; ηcharge is the
battery efficiency during charge period; ηdischarge is the
battery efficiency during discharge period; Pcharge,max is
the maximum permitted rate of charge during a finite each time period (∆t); Pdischarge,max is the is the minimum
permitted rate of charge during a finite each time period (∆t).
3. Self Adaptive Modified Bat Algorithm
(SAMBA)
In this section, the original bat algorithm as well as the proposed self adaptive modification method is described completely.
3.1. Bat Algorithm
Bat Algorithm (BA) is a metaheuristic population based optimization algorithm which was first inspired from the search of bats to find their food [13]. Bats send some signals to the environment and ten listen to its echo which is called echolocation process. BA is mainly con- structed by the use of 4 main ideas [13]: 1) the difference between the prey and food is distinguished through the use of echolocation process; 2) Each bat in the position
Xi flies with the velocity of Vi producing a especial pulse
with the frequency and loudness of fi and Ai respectively;
3) the loudness of Ai changes in different ways such as
reducing from a large value to a low value; and 4) the frequency fi and rate ri of each pulse is regulated auto-
matically. Initially, all bats fly randomly in the search space producing random pulses. After each fly, the posi- tion of each bat is updated as follows:
new old
Bat
new old new
Bat
min max min
1 B
best ; 1, ,
; 1, ,
; 1, ,
i i i i
i i i
i i i i at
f G X i N
X X i N
f f f f i N
V V
V (7)
where Gbest is the best bat from the objective function point of view; NBat is the number of bats in the population;
max min
i i
f f are the maximum/minimum frequency values of the ith bat and φ
1 is a random value in the range [0,1].
In order to reach a better random walking, another ran- dom fly is also simulated. In this regard, a random num- ber β is generated randomly. In each iteration, if the ran- dom value β is larger than ri then a new solution around
Xi is generated as follows:
new old old
mean; 1, , Bat
i i
X X A i N (8) where ε is a random value in the range of [−1,1] and
is the mean value of the loudness of all bats. If the random value β is less than ri then a new position
is generated randomly. The new position is ac-cepted if the bellow equation is satisfied:
old mean A new i X new i X
Ai
&f X
i f G
best
(9)follows:
new old
1 0 1 exp
i i
Iter
i i
A A
r r Iter
(10)
where α and γ are constant values and Iter is the number of the iteration during the optimization process.
3.2. Self Adaptive Modification Method
In this part, a new self adaptive modification method is proposed to improve the total ability of the BA suffi- ciently. The main idea behind the proposed modification is to escape from local optima as well as avoiding pre- mature convergence. The proposed self adaptive modifi- cation method is consisted of two sub-modification me- thods which each of them can be chosen during the opti- mization process according to its fitness. The proposed two sub-modification methods are as follows:
3.2.1. Sub-Modification Method 1
This modification approach will update the value of α
during the optimization adaptively.
1 old1 2 Iter
new Iter
(11) The above equation is obtained by several running of the BA experimentally.
3.2.2. Sub-Modification Method 2
This modification approach will increase the variety of the bat population. The satisfying performance of this modification method in the optimization applications is demonstrated in several studies [14-17]:
old
, 1 2
new
1 2
new new new new
,1 ,2 ,
1 2
; best ;
, , ,
best best , best , , best
i j i
j
i i i i n
n
x X
g
X x x x
G g g g
(12)
where n is the length of the control vector and φ2 is a
random value in the range [0,1]. At the beginning, the probability of each sub-modification method is supposed to be equal (Probω = 0.5 & ω = 1, 2). Each of the
sub-modification methods can be a suitable modification method during the optimization process. Each bat would choose the ωth modification method as the proper modi-
fication method with the use of roulette wheel mecha- nism (RWM). After each iteration, the population is sorted and the probability of each sub-modification me- thod is updated as follows:
2
1
; 1, ,
Prob SR SR
2 (13) where SR߱ is the successful rate of ωth modificationmethod in producing more optimal bats in the population. Each bat is supposed to be more optimal if it
reaches less objective function than
new i
X
old i
X . After updat- ing the probability of each modification method, a ran- dom value φ3 is generated in the range [0,1]. The process
of choosing ωth modification method to produce the next
bat generation is by the use of roulette RWM. It is evi- dent that the modification method with larger probability
Prob߱ has more chance to be chosen for the next iteration.
The process of choosing each modification method is shown in Figure 1.
4. Application of SAMBA to Solve MG
Energy Management Problem
The following steps are required to apply the proposed SAMBA to solve the MG problem:
Step 1: Defining the input data.
Step 2: Converting the constrained problem to an un-
constrained problem using penalty factors.
Step 3: Generate of the initial population and velocity.
Step 4: Evaluate the objective function values for the population.
Step 5: Find the best particle Gbest and store it.
Step 6: Improve the position of bats as in the original BA.
Step 7: Apply the proposed self adaptive modification method as explained in section 3 to each of the bats.
Step 8: Update the bat population and the best bat
Gbest.
Step 9: Check the termination criterion. If the termi- nation criterion is satisfied finish the algorithm, else re- turn to Step 6.
5. Simulation Results
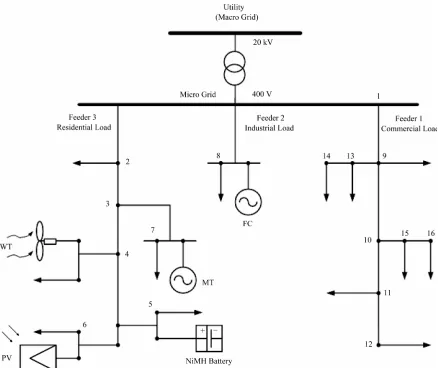
In this section, the proposed method is applied on a typi- cal grid-connected MG including several types of RESs such as FC, PV, WT and MT as well as NiMH-Battery as the storage device. The single line diagram of the test system is shown in Figure 2. As it can be seen from
Figure 2, the MG test system supplies three types of
loads of 1) Residential loads; 2) Industrial loads; and 3) Commercial loads. It is supposed that there is no thermal load in the MG. Also, it is supposed that all the active power produced by the PV and WT power sources are
Begin:
For i=1:NBat where NBat is size of bat population
If 1 ≤ 1 1 Iter Prb
Select modification method 1 for the bat solution i ElseIf 1
1 Iter Prb < rand
i ≤ 1 1 2 1 Ite Iter Prb r Prb
Select modification method 2 for the bat solution i End If
End For i End
Figure 1. Pseudo code for choosing ωth modification method
Figure 2. Single line diagram of the MG test system.
bought by the MG. The analysis is in a 24-hour time in-terval. All the power units are working at unit power factor. The forecast values of the hourly load consump- tion and WT and PV power production as well as the utility power production bid can be found in [12]. The bid data of the power units are shown in Table 1. The initial charge of the NiMH-Battery is zero. Therefore, the NiMH-Battery has to first be charged to be able to dis- charge at later hours. All the RESs can change between ON/OFF modes according to the economical benefits of the MG central controller. In order to have more reliable analysis, the effect of forecast error of load value, the PV and WT output generation and the cost coefficient are modeled through the probabilistic load flow as in [18,19] published by the author. The simulation results are im- plemented for the test system and the cost value is shown in Table 2. In order to reach better understanding of the powerful ability of the proposed method, some of the other well-known methods in the area are also shown in
Table 2.
Table 2 shows the optimal value of cost function
evaluated by different values for 25 trails. As it can be seen from Table 2, the proposed method has reached to much more optimal value for the cost function than the other methods. In fact, the proposed algorithm has reached to a new optimal value by escaping from the local optimal solutions. Columns 2-5 show the worst, the best, the standard deviation and the CPU time, respectively. Here, again the superiority of the proposed method over the other algorithms is evident. From the standard devia- tion point of view, the high stability of the proposed SAMBA can be deduced. Also, by comparing the CPU time, it is deduced that the convergence ability of the proposed method is better than that of the others. The corresponding optimal operating points of the RESs, the utility and the NiMH-Battery for all hours are shown in
Table 1. The limitations and bids of RESs & the utility.
Type Min Power (kW) Max Power (kW) Bid (€ct/kWh) Start-up/Shut-down Cost (€ct)
MT 6 30 0.457 0.96
PAFC 3 30 0.294 1.65
PV 0 25 2.584 0
WT 0 15 1.073 0
Bat −30 30 0.38 0
[image:6.595.65.539.230.316.2]Utility −30 30 - -
Table 2. The simulation results for cost function for 25 trails.
Method Best solution (€ct) Worst solution (€ct) Average (€ct) Standard deviation (€ct) Mean CPU time (Sec)
GA [20] 335.0707 345.4849 337.9392 20.9302 17.451
PSO [21] 329.4922 341.9583 332.5222 15.2483 16.263
FSAPSO [12] 328.6594 336.5502 332.0251 12.8409 15.685
BA 320.4921 334.1290 323.8321 8.3952 15.448
SAMBA 301.3944 302.9368 301.5782 0.8538 10.963
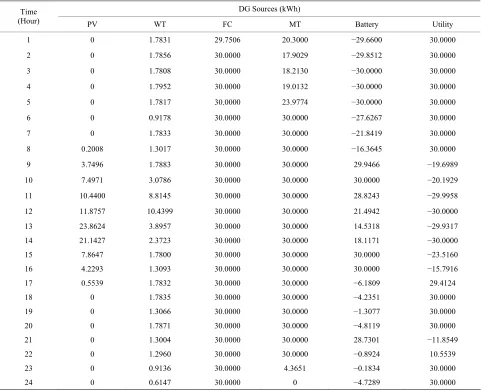
Table 3. Output power of RESs evaluated by the proposed method.
DG Sources (kWh) Time
(Hour) PV WT FC MT Battery Utility
1 0 1.7831 29.7506 20.3000 −29.6600 30.0000
2 0 1.7856 30.0000 17.9029 −29.8512 30.0000
3 0 1.7808 30.0000 18.2130 −30.0000 30.0000
4 0 1.7952 30.0000 19.0132 −30.0000 30.0000
5 0 1.7817 30.0000 23.9774 −30.0000 30.0000
6 0 0.9178 30.0000 30.0000 −27.6267 30.0000
7 0 1.7833 30.0000 30.0000 −21.8419 30.0000
8 0.2008 1.3017 30.0000 30.0000 −16.3645 30.0000
9 3.7496 1.7883 30.0000 30.0000 29.9466 −19.6989
10 7.4971 3.0786 30.0000 30.0000 30.0000 −20.1929
11 10.4400 8.8145 30.0000 30.0000 28.8243 −29.9958
12 11.8757 10.4399 30.0000 30.0000 21.4942 −30.0000
13 23.8624 3.8957 30.0000 30.0000 14.5318 −29.9317
14 21.1427 2.3723 30.0000 30.0000 18.1171 −30.0000
15 7.8647 1.7800 30.0000 30.0000 30.0000 −23.5160
16 4.2293 1.3093 30.0000 30.0000 30.0000 −15.7916
17 0.5539 1.7832 30.0000 30.0000 −6.1809 29.4124
18 0 1.7835 30.0000 30.0000 −4.2351 30.0000
19 0 1.3066 30.0000 30.0000 −1.3077 30.0000
20 0 1.7871 30.0000 30.0000 −4.8119 30.0000
21 0 1.3004 30.0000 30.0000 28.7301 −11.8549
22 0 1.2960 30.0000 30.0000 −0.8924 10.5539
23 0 0.9136 30.0000 4.3651 −0.1834 30.0000
[image:6.595.58.539.342.732.2]load. In the case of MT, as it can be seen, it is ON in all hours except at hour 24. In fact, at hour 24, the algorithm has deduced to turn the MT off to reduce the total cost. Similar analysis can be made for the other RESs at dif- ferent hours. According to the results of Tables 2 and 3, the superiority of the proposed method is evident
6. Conclusions
This paper proposes a new method based on BA to solve the nonlinear MG energy management problem properly. In this regard, a new self adaptive modification method based on BA was proposed to empower the BA to escape from the promising local optima as well as the premature convergence. The proposed algorithm is consisted of 2 sub-modification methods which each of them can be selected according to its usefulness during the optimi- zation process. The investigated problem covers the re- newable MG with the back-up of FC, WT, PV and MT as well as the NiMH-Battery as the storage device. The si-mulation results showed the feasibility and superiority of the proposed method over the other well-known me- thods in the area. Also, the positive role of NiMH-Bat- tery to reduce the total cost of the MG was shown. Ac- cording to the simulation results, the proposed method has suitable ability from both convergence speed and global searching ability points of view.
Although this work has investigated the MG operation management problem from the Energy reduction point of view, the other aspects of the problem such as amount of pollution and reliability analysis can be considered in the future works. Also, a complete comparison between the stochastic frameworks to capture more the uncertainty effects can be considered in future works too.
7. Acknowledgements
The authors wish to acknowledge Prof. Taher Niknam for his useful and constructive comments to empower the paper containing structure. In addition, they wish to thank the Islamic Azad University, Sarvestan Branch for supporting helps to yield the opportunity of having such a research in the MG area.
REFERENCES
[1] T. Niknam and A. Kavousifard, “Impact of Thermal Re- covery and Hydrogen Production of Fuel Cell Power Plants on Distribution Feeder Reconfiguration,” IET Ge- neration, Transmission & Distribution, Vol. 6, No. 9, 2012, pp. 831-843. doi:10.1049/iet-gtd.2011.0775
[2] O. Hafez and K. Bhattacharya, “Optimal Planning and De- sign of a Renewable Energy Based Supply System 435 for Microgrids,” Renewable Energy, Vol. 45, 2012, pp. 7- 15. doi:10.1016/j.renene.2012.01.087
[3] M. Pipattanasomporn, H. Feroze and S. Rahman, “Secur-
ing Critical Loads in a PV-Based Microgrid with a Multi- Agent System,” Renewable Energy, Vol. 39, No. 1, 2012, pp. 166-174. doi:10.1016/j.renene.2011.07.049
[4] H. Morais, P. Kádár, P. Faria, Z. A. Vale and H. M. Khodr, “Optimal Scheduling of a Renewable Micro-Grid in an Isolated Load Area Using Mixed-Integer Linear Program- ming,” Renewable Energy, Vol. 35, No. 1, 2010, pp. 151- 156. doi:10.1016/j.renene.2009.02.031
[5] A. G. Tsikalakis and N. D. Hatziargyriou, “Centralized Control for Optimizing Microgrids Operation,” IEEE Transactions on Energy Conversion, Vol. 23, No. 1, 2008, pp. 241-248. doi:10.1109/TEC.2007.914686
[6] H. M. Khodr, N. El Halabi and M. García-Gracia, “Intel- ligent Renewable Microgrid Scheduling Controlled by a Virtual Power Producer: A Laboratory Experience,” Re- newable Energy, Vol. 48, 2012, pp. 269-275.
doi:10.1016/j.renene.2012.05.008
[7] O. Hafez and K. Bhattacharya, “Optimal Planning and Design of a Renewable Energy Based Supply System for Microgrids,” Renewable Energy, Vol. 45, 2012, pp. 7-15. doi:10.1016/j.renene.2012.01.087
[8] R. Chedid and S. Raiman, “Unit Sizing and Control of Hybrid Wind Solar Power Systems,” IEEE Transactions on Energy Conversion, Vol. 12, No. 1, 1997, pp. 79-85. doi:10.1109/60.577284
[9] S. Chakraborty, M. D. Weiss and M. G. Simoes, “Distrib- uted Intelligent Energy Management System for a Single- Phase High Frequency AC Microgrid,” IEEE Transac- tions on Industrial Electronics, Vol. 54, No. 1, 2007, pp. 97-109. doi:10.1109/TIE.2006.888766
[10]A. Dukpa, I. Dugga, B. Venkatesh and L. Chang, “Opti- mal Participation and Risk Mitigation of Wind Generators in an Electricity Market,” IET Renewable Power Genera- tion, Vol. 4, No. 2, 2010, pp. 165-175.
doi:10.1049/iet-rpg.2009.0016
[11]C. Chen, S. Duan, T. Cai, B. Liu and G. Hu, “Smart En- ergy Management System for Optimal Microgrid Eco- nomic Operation,” IET Renewable Power Generation, Vol. 5, No. 3, 2011, pp. 258-267.
doi:10.1049/iet-rpg.2010.0052
[12]A. A. Moghaddam, A. Seifi, T. Niknam and M. R. A. Pah- lavani, “Multi-Objective Operation Management of a Re- newable MG (Micro-Grid) with Back-Up Micro-Turbine/ Fuel Cell/Battery Hybrid Power Source,” Energy, Vol. 36, No. 11, 2011, pp. 6490-6507.
doi:10.1016/j.energy.2011.09.017
[13]G. Komarasamy and A. Wahi, “An Optimized K-Means Clustering Technique Using Bat Algorithm,” European Journal of Scientific Research, Vol. 84, No. 2, 2012, pp. 263-273.
[14]T. Niknam, A. K. Fard and A. Seifi, “Distribution Feeder Reconfiguration Considering Fuel Cell/Wind/Photovol- taic Power Plants,” Renewable Energy, Vol. 37, No. 1, 2011, pp. 213-225. doi:10.1016/j.renene.2011.06.017 [15]T. Niknam, A. Kavousifard, S. Tabatabaei and J. Aghae,
doi:10.1016/j.jpowsour.2011.05.081
[16]T. Niknam, A. Kavousifard and J. Aghaei, “Scenario- Based Multiobjective Distribution Feeder Reconfigura- tion Considering Wind Power Using Adaptive Modified Particle Swarm Optimization,” IET Renewable Power Generation, Vol. 6, No. 4, 2012, pp. 236-247.
doi:10.1049/iet-rpg.2011.0256
[17]A. Kavousi-Fard and M. R. Akbari-Zadeh, “Reliability Enhancement Using Optimal Feeder Reconfiguration,”
Neurocomputing, 2012, in Press. doi:10.1016/j.neucom.2012.08.033
[18]A. Kavousifard and H. Samet, “Consideration Effect of Uncertainty in Power System Reliability Indices Using Radial Basis Function Network and Fuzzy Logic The- ory,” Neurocomputing, Vol. 74, No. 17, 2011, pp. 3420-
3427. doi:10.1016/j.neucom.2011.05.017
[19]A. R. Malekpour, T. Niknam, A. Pahwa and A. K. Fard, “Multi-Objective Stochastic Distribution Feeder Recon- figuration in Systems With Wind Power Generators and Fuel Cells Using the Point Estimate Method,” IEEE Tran- sactions on Power Systems, Vol. 99, 2012, pp. 1-10. doi:10.1109/TPWRS.2012.2218261
[20]S. H. Ling, “Hybrid Particle Swarm Optimization with Wavelet Mutation and Its Industrial Applications,” IEEE Transactions on Systems, Man, and Cybernetics, Part B, Vol. 38, No. 3, 2008, pp. 743-763.