Munich Personal RePEc Archive
National or international public funding?
Subsidies or loans? Evaluating the
innovation impact of RD support
programmes
Huergo, Elena and Moreno, Lourdes
Universidad Complutense de Madrid, GRIPICO
7 March 2014
National or international public funding? Subsidies or loans? Evaluating the innovation impact of R&D support programmes
Elena Huergo
GRIPICO-Universidad Complutense de Madrid*
Lourdes Moreno
GRIPICO-Universidad Complutense de Madrid*
March 2014
Abstract
The objective of this study is to compare the effect of different types of public support for R&D projects on firms’ technological capabilities. We distinguish be-tween low-interest loans and subsidies and bebe-tween national and European sup-port. Using data on 2,319 Spanish firms during the period 2002-2005, we estimate a multivariate probit to analyse the determinants of firms’ participation in public R&D programmes and, later, the impact of this participation on firms’ technologi-cal capabilities using different indicators. The results provide evidence of the ef-fectiveness of all treatments for improving firms’ innovative performance. Specif-ically, although the three kinds of public aid stimulate the intensity of R&D in-vestment, the highest impact corresponds to soft credits. In addition, national sub-sidies have a higher impact on internal R&D intensity than EU grants, but the op-posite relation is found as regards total R&D intensity. With respect to innovation outputs, apart from the indirect effect of public support by stimulating R&D in-tensity, we also find evidence of a direct effect of participation in the CDTI credit system and in the European subsidy programme on the probability of obtaining product innovations and applying for patents.
Keywords: Soft credits, R&D subsidies, impact assessment
J.E.L. Classification: H81, L2, O3, L52
This research has been partially funded by the Seventh Framework Programme (Ref.: 290597) and by a research grant from the Spanish Ministry of Science and Innovation (Ref.: ECO2010-19847). The authors thank the CDTI for the transfer of the data to carry out this research.
1. INTRODUCTION
There is a great deal of empirical evidence of the impact of public aid on private R&D, with a
wide variety of countries analysed and methodologies employed to take into account that
pub-lic support can be endogenous (Wallsten, 2000; Busom, 2000; Lach, 2002; Duguet, 2004;
González, Jaumandreu and Pazó, 2005; González and Pazó, 2008; Czarnitzki and Licht, 2006;
OECD, 2006; Clausen, 2008; Takalo, Tanayama and Toivanen, 2013). Most papers consider
only one programme in their analyses and this fact makes it difficult to accurately compare
the impacts among funding systems, which can differ in their objectives, the national or
su-pranational character of the supporting entity and the funding scheme (Blanes and Busom,
2004). In this sense, it seems reasonable that their evaluation also provides different results.
Two exceptions are the papers by García and Mohnen (2010) and Czarnitzki and Lopes-
Bento (2011). In both cases, the empirical analysis is based on microdata from the
Communi-ty Innovation Survey (CIS). The first one compares the impact of public support from the
central government and the European Union (EU) on the innovation of Austrian firms, using
the third wave of the CIS, which covers the years 1998-2000. To measure the effectiveness of
these programmes, the authors propose a structural model of the endogeneity of innovation
and of public support for it. The estimation of this model by the method of asymptotic least
squares suggests that receiving central government support increases the intensity of R&D by
2.3 percentage points and yields a 2.5 percentage point increase in the share of sales of new to
firm products. However, EU support is never significant once national support is taken into
account.
The study by Czarnitzki and Lopes-Bento (2011) also offers a comparison of the impact of
national and European funding on innovation intensity and performance. The empirical
analy-sis is based on the German part of the CIS for seven waves but, as the data can only be used
as pooled cross-sections, to face the endogeneity problem, they apply a variant of a
non-parametric matching estimator. In terms of innovation input, their results provide evidence
that getting funding from both sources displays the highest impact, while EU subsidies have
higher effects when the firm receives funding from only one source. As for innovation
per-formance, funding from both sources again yields higher sales of market novelties and patent
applications, but in this case the impact of national funding is superior when only one type of
The objective of this paper is to compare the effect of participation within different public
funding programmes on the technological performance of Spanish firms. This will allow us to
analyse the relative relevance of two features of public programmes: the national or
suprana-tional character of the financing agency, which is usually associated with the nasuprana-tional or
in-ternational character of the R&D project, and the magnitude of reimbursement implied in
de-sign of the public support. Specifically, we consider public programmes based on low-interest
loans versus national and European innovation subsidies.
For this purpose, we integrate two data sets. The first one is provided by the Centre for the
Development for Industrial Technology (CDTI). This public organism grants financial help of
its own to companies and facilitates access to third-party funds for the execution of both
na-tional and internana-tional research and development projects. The second database is provided
by the National Institute of Statistics (INE) and corresponds to a sample of innovative firms
from the Spanish Technological Innovation Survey (the Spanish version of the CIS). Overall,
we compile a homogeneous sample that consists of an unbalanced panel of 7,007 observations
and 2,319 firms for the period 2002 to 2005. Specifically, 1,850 of them have received some
type of public support for their R&D projects during the period.
The factors taken into account to apply for a low-interest loan from the CDTI or for a national
or European subsidy can differ. However, some of them may be the same as those that affect
the firm’s R&D decision. This fact can generate a bias in the impact of these funding
instru-ments on the innovative performance of firms if the CDTI or other public domestic and
for-eign organisms award firms with a better technological profile.
To deal with this selection problem, in this paper we follow a two-stage procedure. Firstly, we
estimate a multivariate probit model to study the determinants of each of the three schemes of
public support. Then, in a second stage, we analyse how this participation affects the
techno-logical capability of the firms. Specifically, we consider R&D intensity to be technotechno-logical
input, and product and process innovations and patent applications to be technological
out-puts. We use Heckman’s treatment effect model to face selectivity and endogeneity problems.
Our results confirm that the three instruments are effective in enhancing firms’ R&D
intensi-ties. However, the highest impacts correspond to soft credits. As for innovation outputs, there
is an indirect effect of public support by stimulating R&D intensity that has a positive impact
of a direct effect of participation in the CDTI credit system and in the European subsidy
pro-gramme on the probability of obtaining product innovations and applying for patents.
Howev-er, this direct effect is not present in the case of process innovations.
The rest of the paper is organised as follows. In Section 2, we highlight how some
characteris-tics of support programmes can justify their different impact on firms’ innovation. In Section
3, we describe the empirical model and the data. Section 4 shows the estimates and discusses
the results. Finally, we present key conclusions in Section 5.
2. THE LINK BETWEEN INNOVATION IMPACT AND PROGRAMME
FEATURES
Assessing the impact of public support of firms’ R&D projects on innovation inputs or
out-puts requires a clear understanding of the design of public programmes. Although the general
design of an R&D programme is likely to have an impact on innovation, it is difficult to
clear-ly associate certain design features of R&D programmes with (not directclear-ly intended)
innova-tion (European Commission, 2009).
In this paper, we investigate the role of two specific dimensions of supporting schemes: the
national versus supranational level of the programme and the reimbursable character of the
aid. As for the first aspect, why should we expect a different impact of R&D subsidies
de-pending on the government level of the supporting organism? There are at least three reasons.
First of all, the design of R&D programmes can differ between public agencies of different
levels of governance, especially when they have specific objectives. These aims can consist of
stimulating specific groups such as R&D champions (picking-the-winners strategy), SMEs
with major financial constraints to undertake R&D projects, or companies in sectors with
large knowledge externalities. In the case of national agencies, the objective could also be the
technological updating of firms in traditional or declining sectors (see Blanes and Busom,
2004), whereby the agencies try to increase the probability of survival and avoid employment
losses. And depending on the final objective, selected projects can be more or less
market-oriented or focused on core technologies of participants. For instance, the Framework
research institutes in consortia and the relevance of pre-competitive research, while the
Eure-ka Programme is more market-oriented (Benfratello and Sembenelli (2002).
Alternatively, as Busom and Fernández-Ribas (2007) point out, programmes implemented by
different jurisdictions could be complementary if the agencies coordinate efficiently to take
into account the nature and extent of spillovers and other relevant market failures. In fact,
most supra-national policies are justified by the existence of cross-border spillovers and
econ-omies of scale. In this line, Busom and Fernández-Ribas (2007) test whether the Spanish
gov-ernment and the European Commission have different selection criteria for awarding R&D
subsidies to firms. They conclude that the determinants of firm participation in each
pro-gramme are different, suggesting that these propro-grammes do not systematically overlap
ex-post, as intended ex-ante by policy makers.
A second argument is related to the different costs of application in each programme
(Czarnitzki and Lopes-Bento, 2011). These application costs are mainly related to
bureaucrat-ic and administrative requirements that are enlarged when the procedure of granting implies a
negotiation phase. Firms usually perceive this negotiation phase as resource-consuming,
de-laying the timing of the R&D project (Barajas and Huergo, 2010).
In addition, application costs increase with coordination costs in the case of programmes that
imply the existence of self-organised consortia, as often happens in supra-national R&D
pro-grammes. The organisation of the network of partners, the formulation of the proposal and the
daily monitoring of the project usually entail higher overhead costs in time and human
re-sources than in the case of individual R&D projects.
And a third reason for having different impacts among programmes has to do with the size of
expected knowledge spillovers. These spillovers refer both to the company's ability to capture
information flows from the public pool of knowledge (incoming spillovers) and to the ability
to control information flows out of the firm (outgoing spillovers) to appropriate the returns
from innovation.
The measurement of these spillovers is especially complex in cooperative R&D agreements.
In fact, as Cassiman and Veugelers (2002) find out, there is a significant relation between
external information flows and the decision to cooperate in R&D, and the level of knowledge
inflows and outflows is not exogenous to the firm. This element is especially important for
Research Joint Ventures (RJVs) that involve partners from different countries. In this case, the
technological capabilities of subsidised firms can be affected not only by public aid but also
by spillovers of cooperation among partners. However, most papers that study the impact of
public programmes that support RJVs consider R&D collaboration and R&D public support
to be an integrated treatment (Benfratello and Sembenelli, 2002; Bayona-Sáez and
García-Marco, 2010; Kaiser and Kuhn, 2012; Barajas, Huergo and Moreno, forthcoming). An
excep-tion is the paper by Czarnitzki, Ebersberger and Fier (2007), who interpret RJVs and subsidies
as heterogeneous treatments for a sample of German and Finnish firms. Although they find
that the combination of both treatments has a positive impact on the firm’s R&D expenditures
or the number of patents, when cooperation and public support are separately analysed,
subsi-dies for individual research do not significantly affect R&D or patenting by German firms.
The reimbursable character of public support is a second dimension that could affect our
analysis when comparing the effect of subsidies and loans. In this sense, as perceived by
pro-gramme managers, the existence of private co-funding is highly relevant for innovation
im-pact (European Commission, 2009). Preferential (below market) or low-interest loans in fact
imply a hidden subsidy in terms of interest savings. However, they are fully compatible with
fiscal incentives, while subsidies in many cases imply that firms cannot benefit from tax cuts
that are related to R&D investments. The loans also self-enforce more discipline on the
recip-ients, as they assume the commitment to pay back the principal. The monitoring of the project
development by the agency is consequently also higher. In addition, the percentage of the
firm’s budget that is allocated to the project is higher than usual, and it may be easier to obtain
private financing outside the company (Huergo and Trenado, 2010).
3.
THE EMPIRICAL MODEL AND THE DATAFollowing the literature on impact assessment of R&D policies, the implicit question to
an-swer is what the behaviour of a supported firm would have been if it had not received this
public aid. The problem is that each firm can only be observed either in the status of receiving
the support or not. Therefore, to measure the effect of public aid on technological capability,
we have to take into account that participation within a funding programme agency probably
depends on the same firm characteristics that determine innovative performance. That is, it is
Econometric literature has developed several methods in order to solve these difficulties
(Heckman, 1979; Cerulli and Potì, 2012; Aerts, Czarnitzki and Fier, 2006; Guo and Fraser,
2010). In this paper, we follow Heckman’s treatment effect model. Initially, a selection
equa-tion for the participaequa-tion status is estimated for each of the three programmes considered in
our analysis: the CDTI programme of low-interest credits, the Spanish programme of R&D
subsidies and the Framework Programme of the European Commission.1Then, we analyse the
impact of this participation on some variables that measure technological inputs or outputs.
Specifically, our first equation is devoted to the participation of firm i (i1N) in public
funding programme m (m1, 2, 3) during year t(t1T)and is formalised in terms of a
multivariate model given by:
*
1 if 0
0 otherwise
mit mit m mit
mit
y x u
y [1]
, where ymit* is a latent dependent variable, xmit is the set of explanatory variables that can
dif-fer across equations, m is the vector of coefficients and umit are the error terms distributed as
multivariate normal, each with a mean of zero, and variance–covariance matrix V, where V
has a value of 1 on the leading diagonal and correlations ρjk = ρkj as off-diagonal elements:
1 12 13
2 12 23
3 13 23
0 1
0 , 1
0 1 it it M it u u N u
In the second step, we analyse how the participation of the firm in these programmes affects
its technological profile, distinguishing between innovation inputs and outputs.
Initially, we deal with R&D intensity as a measure of technological inputs. Following the
ap-proach of Griffith et al. (2006), we believe that, to some extent, all firms make some
innova-tive effort. However, below a certain threshold, the firm is not capable of picking up explicit
information about this effort and will not report on it. Thus, we estimate a selection model for
the observed R&D intensity. In particular, we think that we can measure R&D effort idit* by
1
the intensity of R&D expenditure idit only if the firm makes and reports that expenditure. To
represent this decision to perform and report R&D expenditures, we assume the following
selection equation:
3 *
1 1 1 1
1 if ´ 0
0 otherwise
it mit m it it
m it
r p z
r , [2]
where rit is a binary variable that takes the value 1 when the firm invests in (and reports)
R&D, and 0 otherwise. If the latent variable *
it
r is bigger than a constant threshold (which can
be zero), we then observe that the firm engages in (and reports) R&D activities. In this
equa-tion, pmitdenotes the predicted value for the probability of participating within a public
fund-ing programme,m is the parameter that reflects the impact of the different public aid
pro-grammes, z1it is a vector of observable explanatory variables, and1it is an idiosyncratic error.
Conditional on the performance (and reporting) of R&D activities, we can observe the
quanti-ty of resources allocated to this purpose; that is,
3 *
2 2 2 1
´ if 1
0 if 0
it mit m it it it
m it
it
id p z r
id
r
, [3]
where z2it is a vector of determinants of the innovative effort, which can differ from those
determinants that explain the decision to perform and report R&D expenditures, and 2it is
the error term.
Therefore, we estimate a Heckman model, assuming that the error terms 1i and 2i follow a
bivariate normal distribution with a mean equal to 0, variances 12 1 and 22, and correlation
coefficient 12. This structure allows us to analyse whether the impact of public aid differs
across programmes, not only in the decision to undertake innovation activities but also in
R&D intensity.
After this, we focus on technological outputs that we measure through binary variables for the
generation of process and product innovations and for patent application. We formalise the
3
3 3 3 1
´
it mit m it it
m
w p z , [4]
where z3it is a vector of determinants of the technological outputs, which can differ
depend-ing on the dependent variable considered, and 3it is the error term. In some specifications,
we include the latent R&D effort, idit*, as an element of vector z3it, assuming that the more
firms spend on R&D activities, the more likely it is that they will obtain technological
out-puts. In this case, public support can affect innovation outputs directly (throughm) or
indi-rectly by increasing R&D intensity. Given that our measures of technological outputs are
bi-nary variables, this equation is estimated as a Probit model.
Notice that, in equations [2] to [4], to deal with the selection (and endogeneity) problem, the
predicted probability of participation in each public programme is considered instead of the
observed participation status.
3.1. The database
As we mentioned in the introduction, two data sources are used in this paper. The first one is
the CDTI database of low-interest loans for R&D projects. During the period 2002-2005, the
CDTI financed three types of projects through soft loans: Technological Development
Pro-jects (TDP), Technological Innovation ProPro-jects (TIP) and Joint Industrial Research ProPro-jects
(JIRP). Specifically, we consider 1,787 projects which were granted a low-interest loan by the
CDTI during this period. These data are especially suitable for our analysis as most of the
direct R&D support from the Spanish central government is channelled through the CDTI,
and the CDTI’s main instrument during this period consists of loans at a preferential interest
rate.
This information has been completed with a database that was provided by the National
Insti-tute of Statistics (INE) and corresponds to a sample of innovative firms from the Spanish
Technological Innovation Survey. In this survey, we find complementary information about
sources of public financial support for innovation activities from the different levels of
gov-ernment. Unfortunately, we do not have access to information related to R&D tax credits.
one of the most generous among OECD countries in terms of the tax subsidy rate (OECD,
2012).2
For the estimations we have eliminated 42 observations with a ratio of R&D expenditures
over sales bigger than 10 (more that 1000%); these relate mainly to new firms which have
initiated their technological activities but have not yet begun to sell their products or services.
The final sample consists of an unbalanced panel with 2,319 firms (7,007 observations).
As can be seen in Table 1, around half of the observations correspond to firms that do not
obtain any type of public funding that specific year, while less than 5% of firms are supported
[image:11.595.84.513.335.482.2]through the three schemes in the period.
Table 1: Distribution of the sample by type of public funding. 2002-2005
Yearly observations Firms
(in period 2002-2005)
No public funding 3,675 (52.4%) 469 (20.2%)
Only CDTI loan 1,108 (15.8%) 635 (27.4%)
Only national subsidy 1,014 (14.5%) 209 (9.0%)
Only European subsidy 268 (3.8%) 139 (6.0%)
CDTI loan & national subsidy 587 (8.4%) 624(26.9%)
CDTI loan & European subsidy 32 (0.5%) 25(1.1%)
National & European subsidies 263 (3.8%) 104 (4.5%) CDTI loan & national & European subsidies 60 (0.9%) 114 (4.9%)
7,007 2,319
Notes: In column 1, firms are classified according to the year that they are supported or not. In column 2, firms are classified considering the whole period.
The selection of explanatory variables in the model is based on previous empirical literature
and is also determined by the availability of information in our databases. As for firms’
partic-ipation in public R&D programmes (equation [1]), most papers include measures of the firm’s
technological profile, as the chance to apply increases when the propensity to perform R&D
projects is higher.3 The available information allows us to consider several variables. The first
one is internal R&D intensity, which we compute as the ratio of internal R&D expenditures
2
A nice exercise associating the use of R&D subsidies and tax incentives by Spanish firms with financing con-straints can be found in Busom, Corchuelo and Martínez-Ros (forthcoming). They conclude that direct funding and tax credits are not perfect substitutes in terms of their ability to reach firms experiencing barriers associated to market failures.
3
over total employment. We also define total R&D intensity as total (internal plus external)
R&D expenditures per employee and the percentage of R&D employment (over total
em-ployment), as a proxy of skilled labour. In our sample, the means of these variables are greater
in firms that have been awarded a European subsidy than in firms with a national subsidy, and
superior in these nationally-subsidized firms than in firms with a CDTI loan (see Table 2).
In addition, we introduce an indicator reflecting whether the firm has technological
coopera-tive agreements. We can distinguish between the kinds of partners, which can be clients,
pro-viders, competitors, consultants and laboratories, other firms of the group, universities, public
research centres (PRCs) and technological centres. As can be seen in Table 2, the sample
mean of these indicators is higher for participants in public R&D programmes than for
non-awarded firms.
We also consider the generation of process and product innovations and the application for
patents as proxies of technological outputs that can reflect the firm’s innovative intensity and
technological and commercial success. Again, the sample mean of these variables is higher
for participants in national R&D programmes than in non-supported firms. However,
alt-hough companies with European funding present a higher probability of applying for patents,
they do not show any significant differences in declaring product or process innovations with
respect to non-public funded firms.
Regarding the sectorial dimension, while firms financed with national and European subsides
are relatively more present in high and medium-tech service sectors4, the proportion of firms
supported by the CDTI seems to be higher among manufacturing firms.
In addition to the variables that reflect technological features, we also consider in our
specifi-cation other firms’ characteristics that can affect their participation in public R&D
pro-grammes. In this sense, the firm’s size is a usual determinant in most papers which deal with
the impact of public funding. However, its effect on participation is not clear. SMEs are
usu-ally more affected by innovation-related market failures, so their benefits from public aid
could be higher. However, large firms usually have more resources with which to undertake
R&D projects and apply for the aid. In addition, public agencies can be too risk-averse to
fi-nance R&D of small firms.
4
Table 2: Means of main variables by type of public funding
All firms
Non-supported firms
(1)
Supported firms Difference of means testa) CDTI
loan (2)
National subsidy (3)
European
subsidy (4) (1) vs (2) (1) vs (3) (1) vs (4)
Technological characteristics
- Internal R&D intensity (K€ per employee) 10.6 5.5 12.8 16.3 26.4 0.000 0.000 0.000
- Internal R&D performer (0/1) 0.785 0.649 0.879 1.000 1.000 0.000 0.000 0.000
- Patent application (0/1) 0.249 0.210 0.284 0.336 0.316 0.000 0.000 0.000
- Percentage of R&D employees (%) 58.7 47.4 66.4 74.8 80.7 0.000 0.000 0.000
- Process Innovation (0/1) 0.541 0.518 0.575 0.614 0.490 0.000 0.000 0.209
- Product Innovation (0/1) 0.632 0.585 0.674 0.756 0.613 0.000 0.000 0.197
- R&D performer (Internal or external) (0/1) 0.814 0.693 0.901 1.000 1.000 0.000 0.000 0.000
- Technological cooperation (0/1) 0.468 0.382 0.494 0.654 0.657 0.000 0.000 0.000
- Total R&D intensity (K€ per employee) 12.2 7.0 15.2 19.7 29.3 0.000 0.000 0.000
- High and medium-tech manuf. sector (0/1) 0.361 0.350 0.412 0.376 0.268 0.000 0.058 0.000
- High and medium-tech service sector (0/1) 0.126 0.099 0.103 0.187 0.255 0.352 0.000 0.000
Other firm characteristics
- Belonging to a group (0/1) 0.428 0.418 0.467 0.468 0.440 0.001 0.000 0.307
- Export intensity (Export over sales) 0.232 0.223 0.263 0.257 0.216 0.000 0.000 0.537
- Exporter (0/1) 0.687 0.700 0.714 0.709 0.581 0.646 0.467 0.000
- Foreign capital (0/1) 0.106 0.109 0.113 0.098 0.085 0.710 0.187 0.071
- Public firm (0/1) 0.015 0.014 0.008 0.018 0.040 0.059 0.350 0.000
- Size (Number of employees) 313.3 299.1 268.0 365.3 581.5 0.153 0.025 0.000
- Start-up (0/1) 0.047 0.033 0.060 0.059 0.030 0.000 0.000 0.701
Number of observations 7,007 3,675 1,764 1,924 623
Statistics in Table 2 show that firms awarded by the CDTI are smaller than companies
fi-nanced through other public schemes, although the difference is not statistically significant
with respect to non-awarded firms. However, firms supported by national or European
subsi-dies are bigger than non-participants in public systems. Most observations of the sample refer
to firms which have between 10 and 50 employees (33%), but more than 25% correspond to
large firms, with more than 200 workers.
A second dimension frequently considered in the literature is the age of the firm. Again, its
expected effect on participation is ambiguous. More experienced firms (older firms) are more
likely to use public aid. However, young firms tend to be more financially constrained and, as
a consequence, they could apply for and receive public aid more frequently. The information
in our databases allows us to know whether the firm was born during the last three years. If
this is the case, we consider the firm to be a start-up. Table 2 shows that the percentage of
start-ups is higher among firms supported by national agencies, especially by the CDTI.
Nev-ertheless, there are no significant differences in the percentage of firms supported by the EU
and non-participants: about 3% in both cases.
Another aspect that should be taken into account is the firm’s competitive position in the
ref-erence market, which could be captured by its market share, the evolution of sales or the
ex-porting activity. The key question here is what to expect. Will firms with more market power
participate more in public programmes? Regarding international competition, the expected
answer for exporters would be affirmative, for at least two reasons. Their position in
interna-tional markets could be a signal of their ability to transform innovations into successful
prod-ucts (Czarnitzki and Licht, 2006). Also, they could be facing lower application costs as they
are more experienced in dealing with bureaucracy compared to non-exporters (Takalo,
Ta-nayama and Toivanen, 2013). However, in our sample, the presence of firms with foreign
activity is clearly smaller among EU-funded companies (see Table 2), while in terms of
ex-port intensity, participants supex-ported by the soft loan system or national subsidies do not
pre-sent differences in their foreign activity with respect to non-participants.
Finally, additional control variables are introduced. Time dummy variables are included,
al-lowing for business cycle effects or changes in national and European agencies’ budgets. As
an indicator of the ease of access to external capital markets, possibly meaning better
capital among shareholders is incorporated. As can be seen in Table 2, there are no significant
differences between non-funded firms and domestic supported ones.
For the same reason, an indicator of business group membership for each firm is considered.
Agencies might be less willing to finance firms which belong to a group because it is
ex-pected that these firms benefit from the group in terms of having fewer financial restrictions.
And a dummy variable that represents the presence of public capital is incorporated. Notice
that a higher proportion of public firms are supported by the European agency.
With respect to the decision to engage in R&D investment and the determinants of the
intensi-ty of the R&D (equations [2] and [3]), the theoretical literature suggests including variables
related basically to technological environment, market conditions, financial constraints,
ap-propriability of technological returns and size (reflecting R&D economies of scale) as
deter-minants (see, for example, Arvanitis and Hollenstein, 1994; Klepper, 1996).
To capture environmental and demand conditions, we have considered one indicator of the
firm’s export character, the export intensity and time dummies. We expect that firms
operat-ing in competitive international markets have more incentives to innovate and therefore to
invest in R&D.
As for financial restrictions, the high level of risk of R&D projects and the existence of
in-formation asymmetries between firms and suppliers of external finance increase the firms’
dependence on internal funds (Hall, 2002). Therefore, firms with liquidity constraints are
ex-pected to have more difficulties undertaking R&D projects. The evidence about the impact of
financial restrictions on investment effort is mixed. Previous studies for the Spanish economy
point out that, since 2000, the investment effort has been superior in firms that won public
support than in those which applied for it without success, and greater in the latter than in
firms that did not apply for it. Unfortunately, we do not have information about firms’
finan-cial conditions in our database.5 However, given the aim of this paper, special attention is
devoted to a firm’s participation in the CDTI low-interest loan programme and national and
5
European innovation subsidies schemes. These public aid instruments could increase the
chances of performing R&D, as tools that reduce a firm’s financial constraints.
To indicate appropriability conditions, we use the proportion of R&D employees in the firm
as a measure of human capital. We think that those firms with more qualified personnel are
more capable of assimilating new knowledge, whether it is developed internally or externally.
Piva and Vivarelli (2009) provide evidence that supports this hypothesis for a panel of Italian
firms. As expected, and as can be seen in Table 2, supported firms present a higher percentage
of R&D employment than non-financed firms. In addition, following previous papers for the
Spanish economy, we introduce industry dummies that can also approximate sectorial
technological opportunities and appropriability conditions (Beneito, 2003; Ortega-Argilés,
Moreno and Suriñach-Caralt, 2005). Specifically, we included the dummies for firms that
belong to high and medium-tech sectors defined previously.
Along with the above variables, the specification includes indicators to capture differences in
the firms’ investment behaviour in terms of the time of permanence in the market. In
particular, an indicator of newly born firms (start-ups) is included. Empirical evidence
suggests that start-ups are usually among the most innovative firms; their survival probability
as well as their growth rate depends strongly on their innovative behaviour (Audretsch, 1995;
Huergo and Jaumandreu, 2004). Finally, as in equation [1], we include as control variables
some factors related to firms’ organisational aspects: belonging to a group, foreign capital,
public capital and technological cooperation.
With respect to the technological output equation [4], we try two different specifications. In
the first, we consider almost the same explanatory variables as in the technological input
equation [3]. In the second, besides the variables that reflect participation in public
pro-grammes and time, size and sectorial dummies, only the prediction of the R&D intensity is
added as an explanatory variable. This allows us to discuss the existence of direct and indirect
effects of public funding.
4. RESULTS
In this section, we present the results of the estimation of equations [1] - [4] depicted in
analyse how participation in these programmes affects the technological performance of the
firms, distinguishing between innovation inputs and outputs.
4.1. The determinants of participation in public R&D programmes
Table 3 shows the estimation of the determinants of firms’ participation in public aid
pro-grammes. Considering that we have information about three systems of public aid, we use a
multivariate probit model (seemingly unrelated probit model).6 Some of the explanatory
vari-ables are included with one lag in the estimates to prevent endogeneity problems.
As expected, the correlation coefficients ρ21and ρ32 are significantly different from zero and
positive. In accordance with Busom and Fernández-Ribas (2007) and Czarnitzki and Lopes-
Bento (2011), national support and European funding are positively linked to each other. The
same happens with soft loans and national subsidies, indicating the presence of common
un-observed factors that affect the probability of participating in both programmes. A positive
shock in the probability of getting a national subsidy would also translate into a positive
shock on the likelihood of being awarded an EU grant and a CDTI loan. However, ρ31 is
non-significant, implying that there are no common unobserved factors affecting the probabilities
of participating in the national soft loan system and the scheme of European subsidies.
As for the explanatory variables, most of them are statistically significant and their
coeffi-cients have the same sign in all columns. However, the joint chi-square test clearly rejects the
equality of coefficients across equations (p-value=0.000).
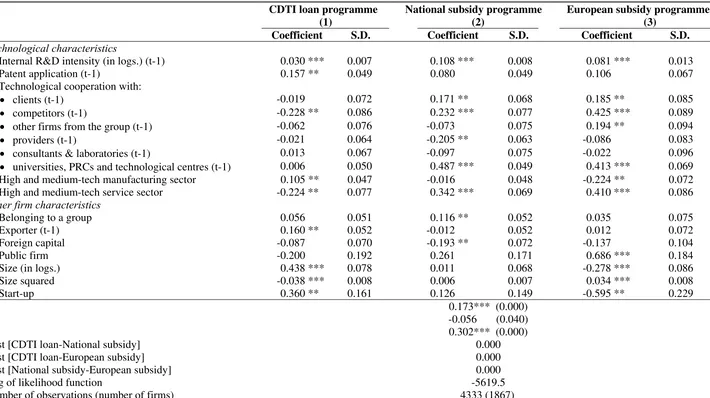
The first fact that can be highlighted from Table 3 is the positive effect of having a higher
technological profile on the probability of participation in all public aid programmes. The
internal R&D intensity of the previous year has a statistically positive impact for all kinds of
funding. Looking at the magnitude of the coefficients, the participation in subsidy
pro-grammes reacts more sensitively to prior innovation experience than in the CDTI loan system.
6
Table 3: Participation in public R&D programmes. Multivariate Probit model
CDTI loan programme National subsidy programme European subsidy programme
(1) (2) (3)
Coefficient S.D. Coefficient S.D. Coefficient S.D.
Technological characteristics
- Internal R&D intensity (in logs.) (t-1) 0.030 *** 0.007 0.108 *** 0.008 0.081 *** 0.013
- Patent application (t-1) 0.157 ** 0.049 0.080 0.049 0.106 0.067
- Technological cooperation with:
clients (t-1) -0.019 0.072 0.171 ** 0.068 0.185 ** 0.085
competitors (t-1) -0.228 ** 0.086 0.232 *** 0.077 0.425 *** 0.089
other firms from the group (t-1) -0.062 0.076 -0.073 0.075 0.194 ** 0.094
providers (t-1) -0.021 0.064 -0.205 ** 0.063 -0.086 0.083
consultants & laboratories (t-1) 0.013 0.067 -0.097 0.075 -0.022 0.096
universities, PRCs and technological centres (t-1) 0.006 0.050 0.487 *** 0.049 0.413 *** 0.069
- High and medium-tech manufacturing sector 0.105 ** 0.047 -0.016 0.048 -0.224 ** 0.072
- High and medium-tech service sector -0.224 ** 0.077 0.342 *** 0.069 0.410 *** 0.086
Other firm characteristics
- Belonging to a group 0.056 0.051 0.116 ** 0.052 0.035 0.075
- Exporter (t-1) 0.160 ** 0.052 -0.012 0.052 0.012 0.072
- Foreign capital -0.087 0.070 -0.193 ** 0.072 -0.137 0.104
- Public firm -0.200 0.192 0.261 0.171 0.686 *** 0.184
- Size (in logs.) 0.438 *** 0.078 0.011 0.068 -0.278 *** 0.086
- Size squared -0.038 *** 0.008 0.006 0.007 0.034 *** 0.008
- Start-up 0.360 ** 0.161 0.126 0.149 -0.595 ** 0.229
ρ21 0.173*** (0.000)
ρ31 -0.056 (0.040)
ρ32 0.302*** (0.000)
Test [CDTI loan-National subsidy] 0.000
Test [CDTI loan-European subsidy] 0.000
Test [National subsidy-European subsidy] 0.000
Log of likelihood function -5619.5
Number of observations (number of firms) 4333 (1867)
In addition, having technological agreements in general increases the probability of obtaining
European funding. This result is coherent with the objectives of the Framework Programme,
which promotes cooperation between firms of different countries. The European agency is
especially sensitive to cooperation with competitors and with universities, PRCs and other
technological centres. A similar effect is obtained for participation in the national funding
programme with the exception of the cooperation with providers. Our results are in
accord-ance with García and Mohnen (2010), who find that Austrian firms which cooperated in
inno-vation were more likely to get help from both national and EU sources during the period
1998-2000. A similar result is obtained by Hottenrott and Lopes-Bento (forthcoming) for
Belgian firms but only for small and medium firms which cooperate with foreign firms.
How-ever, technological cooperation does not seem to increase the propensity to participate in the
soft loan programme. Only cooperation with competitors has a significant but negative
im-pact.
Being a patent applicant in the previous year only positively affects the chance of
participa-tion in the soft loan system.7 It seems that the CDTI is especially sensitive to the previous
technological success of candidate firms in order to award a loan. These results are in
accord-ance with the evidence provided by Huergo, Trenado and Ubierna (2013) for the same loan
system.
Regarding belonging to a high or medium-tech sector, the results confirm what we observed
in the descriptives. In fact, high and medium-tech service firms have a higher probability of
participating in subsidy programmes, while the low-interest loans by CDTI favour firms
which operate in high or medium-tech manufacturing sectors.
As for the rest of the firms’ characteristics, being an exporter in the previous year increases
the probability of participating in the CDTI low-interest loan system but does not affect
par-ticipation in national and European subsidy systems. The presence of foreign capital has a
negative effect for obtaining national funding. This result suggests that the national
govern-ment is more reluctant to finance firms that belong to foreign groups than to domestic ones.
García and Mohnen (2010) and Czarnitzki and Lopes-Bento (2011) also find a negative effect
of this variable on European funding, but in our sample, we do not find this result. Group
membership does not have a significant effect on low interest loans or European subsidies.
7
Another interesting result in Table 3 is the existence of a non-linear effect of size on the
prob-ability of participating in low-interest loan and European funding systems, but in a different
way. As firms are larger, they have a higher probability of being awarded by the CDTI, but
the increase in size affects the probability of obtaining financing marginally less. This result,
which is in accordance with Huergo, Trenado and Ubierna (2013), suggests that applying for
CDTI loans has some costs in terms of time and searching for information, so larger firms
have a higher probability of participating, although as a certain amount of resources is
ob-tained, the size effect is smaller. However, in line with Czarnitzki and Lopes-Bento (2011),
the estimated curve describes a U-shaped relationship between the European subsidy receipt
and firm size. Unexpectedly, size does not appear to be significant for national subsidies.
Finally, being a start-up positively and negatively affects the chance of participation in soft
loan and European subsidy programmes, respectively. Although more experienced firms are
more likely to know and use public aid programmes, younger firms are usually more
finan-cially constrained, having more incentives to apply for and receive them. It seems that the first
effect exceeds the second one in the case of European public aid. The opposite happens with
low-interest loan systems.
4.2. R&D intensity
Table 4 shows the results of the estimation associated with equations [2] and [3] explained in
Section 3. Specifically, we present the marginal effects of the Generalized Tobit model where
the participation and the intensity equations are estimated consistently by maximum
likeli-hood.8
In order to analyse whether the determinants of internal R&D expenditures differ from the
determinants of total R&D expenditures, we present the results of the Heckman model for
both internal and total R&D intensity. Notice that the correlation term rho is significant in
both estimations, pointing out the necessity of estimating a selection model for the observed
intensity. Initially, we tried the same set of explanatory variables for both equations
1 2
(zit z it), but ended up including only those variables that turn out to be statistically
signif-icant in each specification.
8
Table 4: R&D intensity (in logarithms). Generalized Tobit model
Internal R&D Total R&D
Propensity to engage in internal R&D (0/1)
Internal R&D intensity
Propensity to engage in R&D (0/1)
Total R&D intensity
(1) (2) (3) (4)
dy/dx S.D. dy/dx S.D. dy/dx S.D. dy/dx S.D.
Participation in CDTI loan programmea) 0.808 *** 0.127 2.941 *** 0.405 0.807 *** 0.127 2.825 *** 0.411
Participation in national subsidy programmea) 0.759 *** 0.097 2.608 *** 0.271 0.752 *** 0.097 2.483 *** 0.276
Participation in European subsidy programmea) 0.067 0.184 2.456 *** 0.449 0.075 0.184 2.723 *** 0.457
Technological characteristics
- Percentage of R&D employees (t-1) 0.001 *** 0.000 0.001 *** 0.000
- Technological cooperation -0.107 ** 0.037 -0.037 0.037
- Technological cooperation (t-1) 0.040 *** 0.012 0.040 *** 0.012
- High and medium-tech manufacturing sectors 0.366 *** 0.042 0.369 *** 0.042
- High and medium-tech service sectors 0.532 *** 0.067 0.491 *** 0.068
Other firm characteristics
- Belonging to a group -0.037 *** 0.011 0.099 ** 0.041 -0.137 ** 0.011 0.134 *** 0.041
- Exporter (t-1) 0.044 *** 0.015 0.045 ** 0.015
- Export intensity (t-1) 0.295 *** 0.089 0.309 *** 0.090
- Foreign capital 0.057 *** 0.012 0.221 *** 0.058 0.056 ** 0.012 0.232 *** 0.058
- Public firm -0.475 ** 0.154 -0.564 ** 0.157
- Size (in logs.) 0.001 0.004 -0.600 *** 0.017 0.001 0.004 -0.600 *** 0.016
- Start-up 0.302 ** 0.130 0.314 ** 0.132
Selection term, rho 0.389 *** 0.054 0.414 *** 0.053
Log of Likelihood Function -6,385.0 -6,436.1
Number of observations (number of firms) 4,326 (1867) 4,326 (1867)
[image:21.842.67.801.98.455.2]Although it is possible to assume that most variables are exogenous, the indicators for being
an exporter, technological cooperation and the percentage of R&D employees are again
intro-duced with a lag in the decision equation. For the same reason, export intensity is also
includ-ed with a lag in the R&D intensity equation.
With respect to the decision to engage in R&D, the estimations in columns (1) and (3) show
that being awarded a soft credit or a national subsidy clearly increases the probability of
con-ducting R&D activities. Participation in the soft loan and national subsidy funding systems
raises the probability of self-financing internal R&D activities 81.8 and 76.0 percentage
points, respectively. The impact is quite similar when we consider total R&D expenditures.
However, participation in European subsidy programmes does not seem to affect the decision
to undertake technological activities.
Table 4 also shows that most explanatory variables increase the probability of carrying out
R&D expenditures. Firms which operate in international markets (exporters and firms with
foreign capital) present a higher probability of engaging in R&D activities. Specifically, firms
involved in exporting activities during the last year are 4.4 percentage points more likely to
self-finance internal R&D activities, stressing the complementarity between
internationalisa-tion and R&D investment strategies.
In addition, the coefficient for the percentage of R&D employment confirms the relevance of
having qualified workers to more easily assimilate new knowledge. This result is in line with
Huergo and Moreno (2011), who, with another Spanish database, also find a positive impact
of human capital approximated by the proportion of engineers and graduates on firms’
innova-tion behaviour.
A positive sign is also obtained for technological cooperation, which can also be considered a
proxy of the firm’s technological capability. Unexpectedly, we do not find any significant
effect of the firm’s size on the decision to carry out R&D. The only variable which has a
neg-ative impact on the probability is belonging to a group.
With respect to magnitude of R&D expenditures, as can be seen in columns (2) and (4), once
the firm has decided to invest, the three kinds of public aid stimulate the intensity of R&D
investment, although the highest impact corresponds to soft loans. The effects are quite
simi-lar when we consider total R&D expenditures. Our results are in line with García and Mohnen
R&D expenditures over sales. However, our coefficients are larger. This difference can be
explained by the fact that in our sample there is a relevant percentage of start-ups that present
very high R&D intensities.
Export intensity, belonging to a group, being partly owned by foreign capital and being a
start-up also increase the intensity of R&D investment. These results are in accordance with
Ortega-Argilés, Moreno and Suriñach-Caralt (2005), Griffith et al. (2006) and Hall, Lotti and
Mairesse (2009). As expected, firms operating in high and medium-tech sectors also present
greater R&D activity. The only variables with a negative impact on R&D intensity are the
firm’s size and being a public firm.
4.3. The production of technological outputs
Tables 5 and 6 show the results of the estimation of equation [4] for three alternative
measures of innovation outputs: product innovation, process innovation and patent
applica-tion. Given the binary character of our innovation outputs, the equation is estimated as a
pro-bit model. As we have explained in Section 3, we consider two alternative specifications to
analyse the impact of public support on the probability of obtaining technological results.9
In the first one (columns (1) and (3) of Table 5 and column (1) of Table 6), we consider the
same control variables as in the previous equation to be explanatory variables and we do not
take into account that the technological effort of the firm can increase its chance of obtaining
a process or product innovation. In the second one (columns (2) and (4) of Table 5 and
col-umn (2) of Table 6), R&D intensity is included as an explanatory variable. Notice that the
innovation effort is presumably endogenous for achieving innovation outputs – that is, there
can be unobservable (to the econometrician) firm characteristics that incentivise firms to
in-vest more in R&D and, at the same time, make them more productive in the use of this effort.
This could generate spurious correlation and upward bias in the coefficient of R&D intensity.
To face this problem, we interpret the R&D intensity equation [3] as an instrumental variables
equation, and use the predicted R&D intensity obtained from this equation instead of the
ob-served intensity as an explanatory variable in equation [4].
9
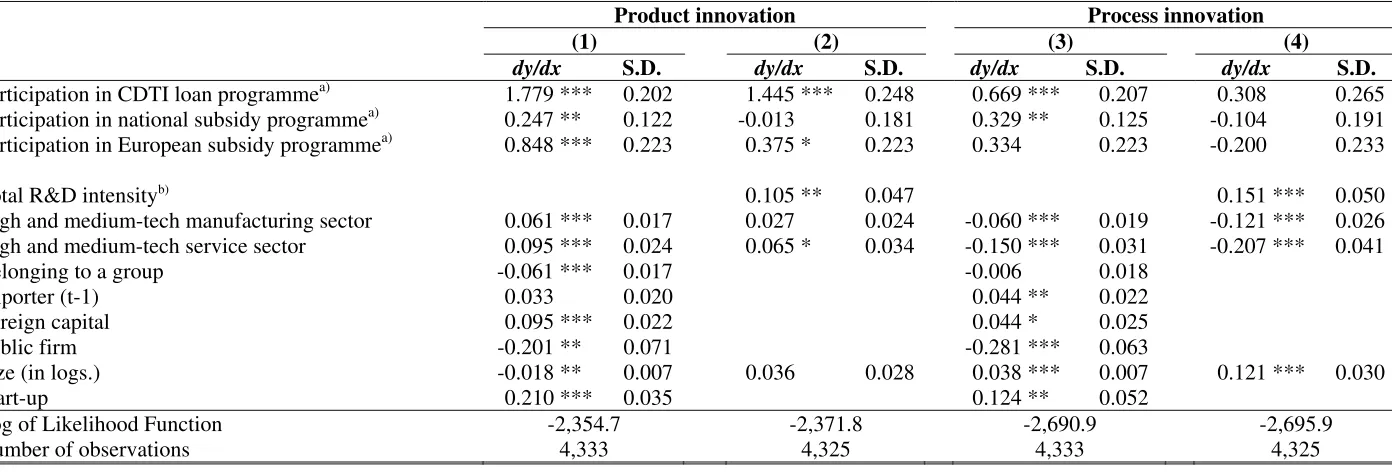
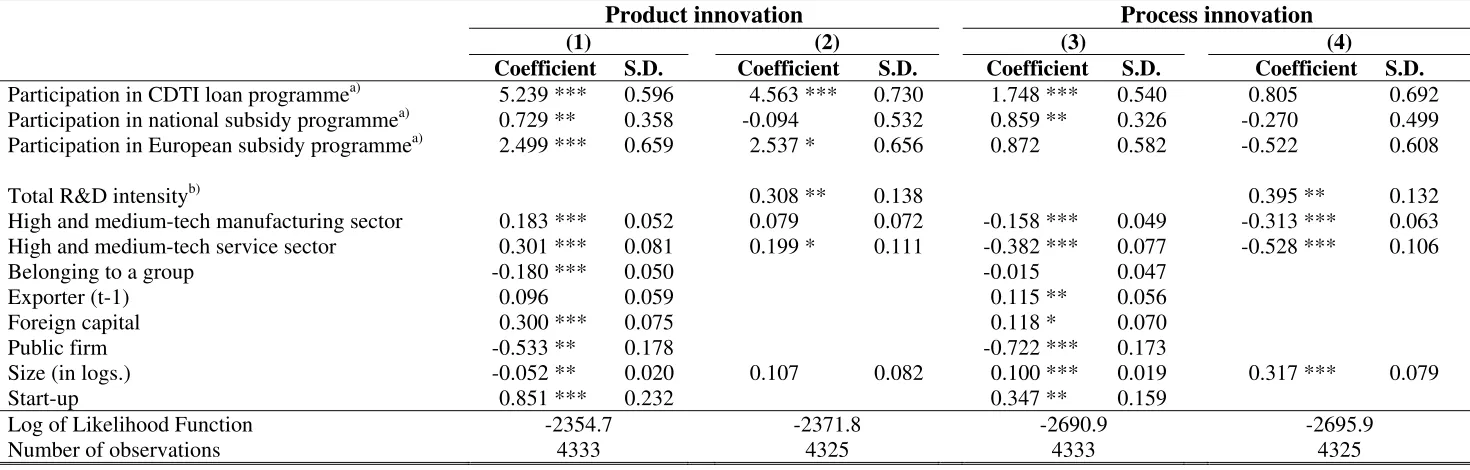
Table 5: Product and process innovation. Probit model
Product innovation Process innovation
(1) (2) (3) (4)
dy/dx S.D. dy/dx S.D. dy/dx S.D. dy/dx S.D.
Participation in CDTI loan programmea) 1.779 *** 0.202 1.445 *** 0.248 0.669 *** 0.207 0.308 0.265
Participation in national subsidy programmea) 0.247 ** 0.122 -0.013 0.181 0.329 ** 0.125 -0.104 0.191
Participation in European subsidy programmea) 0.848 *** 0.223 0.375 * 0.223 0.334 0.223 -0.200 0.233
Total R&D intensityb) 0.105 ** 0.047 0.151 *** 0.050
High and medium-tech manufacturing sector 0.061 *** 0.017 0.027 0.024 -0.060 *** 0.019 -0.121 *** 0.026
High and medium-tech service sector 0.095 *** 0.024 0.065 * 0.034 -0.150 *** 0.031 -0.207 *** 0.041
Belonging to a group -0.061 *** 0.017 -0.006 0.018
Exporter (t-1) 0.033 0.020 0.044 ** 0.022
Foreign capital 0.095 *** 0.022 0.044 * 0.025
Public firm -0.201 ** 0.071 -0.281 *** 0.063
Size (in logs.) -0.018 ** 0.007 0.036 0.028 0.038 *** 0.007 0.121 *** 0.030
Start-up 0.210 *** 0.035 0.124 ** 0.052
Log of Likelihood Function -2,354.7 -2,371.8 -2,690.9 -2,695.9
Number of observations 4,333 4,325 4,333 4,325
Table 6: Patents Application. Probit model
(1) (2)
dy/dx S.D. dy/dx S.D.
Participation in CDTI loan programmea) 4.498 *** 0.197 2.752 *** 0.236 Participation in national subsidy programmea) -1.046 *** 0.112 -0.974 *** 0.174 Participation in European subsidy programmea) 3.246 *** 0.198 1.952 *** 0.202
Total R&D intensityb) 0.127 *** 0.046
High and medium-tech manufacturing sector -0.015 0.016 -0.030 0.023 High and medium-tech service sector 0.128 *** 0.033 0.054 0.040
Belonging to a group -0.077 *** 0.016
Exporter (t-1) -0.240 *** 0.023
Foreign capital 0.196 *** 0.029
Public firm -0.188 *** 0.023
Size (in logs.) -0.083 *** 0.007 0.006 0.027
Start-up 0.084 0.057
Log of Likelihood Function -1,994.1 -2,073.2
Number of observations 4,333 4,325
Notes: a) The prediction of the probability of participating in each programme is obtained from Table 3. b) The prediction of the total R&D intensity is obtained from estimations (3) and (4) in Table 4. S.D.: Standard devia-tion. Coefficients significant at 1%***, 5%**, 10%*. Marginal effects (dy/dx) are computed at sample means. For dummy variables, the marginal effect corresponds to change from 0 to 1. All regressions include a constant and time dummies for the years 2003 and 2004.
When the prediction of the R&D intensity is not included in the estimates, being supported by
public programmes clearly increases the probability of obtaining product innovations. Again,
the highest impact is associated with participation in the CDTI loan system. Participation in
this programme and in the national subsidy system also raise the probability of obtaining
pro-cess innovations, while European funding does not seem to have any effect. Note, however,
that more than 25% of firms in our sample receive both national and European support during
the period.
In addition, the probability of applying for patents is higher for firms awarded a CDTI credit
or a European grant, but national subsidies negatively affect this probability. In this line,
Czarnitzki and Lopes-Bento (2011) find that German firms that receive combined support
from national and European administrations increase their patent applications, while this
ef-fect disappears when companies are only financed by EU programmes. However, Spanish
firms rarely use patents to protect their technological results (Barajas, Huergo and Moreno,
As we expected, when R&D intensity is added to the specification, the impacts of
participat-ing in public programmes are lower, and eventually become non-significant. R&D intensity
has a significant positive impact on the generation of the three technological outputs. While
the quantitative effect of this variable on them is quite similar, the effect on process
innova-tion is the biggest. In this sense, public support has an indirect effect by stimulating R&D
intensity. The results also suggest that participating in the CDTI loan programme and in the
European subsidy programme has a direct positive effect on the probability of obtaining
prod-uct innovations.
With respect to the control variables, being partly owned by foreign capital increases the
probability of obtaining technological outputs. The opposite happens with public firms: they
are less likely to be successful. The rest of the explanatory variables present a different impact
depending on the measure of technological output. For example, as in previous empirical
evi-dence, the youngest firms have a higher probability of innovating, but they do not present any
difference with respect to the other firms in terms of patent applications. Belonging to a group
reduces product innovations and patent applications but has not effect on process innovations.
With respect to size, larger firms show a higher probability of obtaining process innovations
and a lower probability of applying for patents and obtaining product innovations. However,
when we include the R&D intensity in the specification, size turns to be non-significant for
patents and product innovations. Also, it seems that the activity sector also affects firms’
technological results. Specifically, companies operating in high and medium-tech sectors are
more innovative in terms of product innovations. The opposite happens in the case of process
innovations.
5. CONCLUSIONS
The objective of this paper is to compare the effect of participating within different public
R&D funding programmes on firms’ technological performance. This will allow us to analyse
the relative relevance of two features of public programmes: the national or supranational
character of the financing agency and the magnitude of reimbursement implied in the design
of public support.
Specifically, for the empirical analysis, we consider three types of instruments used by public
the CDTI, the main national agency which finances firms’ R&D projects; the national scheme
of R&D subsidies; and the European system of R&D grants.
To face the typical selectivity and endogeneity problems that are present in this kind of
analy-sis, we use Heckman’s treatment effect model, following a two-stage procedure. Firstly, we
estimate a multivariate probit model to study the determinants of participation in each of the
three public programmes. Afterwards, in a second stage, we analyse how this participation
affects the technological capability of the firms. Specifically, we consider R&D intensity to be
technological input, and product and process innovations and patent applications
technologi-cal outputs.
The results obtained for a sample of 2,319 Spanish firms during the period 2002-2005 can be
summarised as follows:
Firstly, participation in national subsidy programmes and participation in European subsidy
programmes are positively linked to each other. The same happens with CDTI soft loans and
national subsidies schemes, indicating the presence of common unobserved factors that affect
the probability of participating in both programmes.
Secondly, being awarded a CDTI soft loan or a national subsidy clearly increases the
proba-bility of conducting R&D activities. However, participation in European subsidy programmes
does not seem to affect the decision to undertake these activities.
Thirdly, once the firm has decided to invest in R&D, the three kinds of public aid stimulate
the intensity of R&D investment, with soft loans having the highest impact. National
subsi-dies have a higher impact on internal R&D intensity than EU grants, but the opposite relation
is found as regards total R&D intensity. This suggests that international funding is more
ef-fective for fostering external R&D activities.
As for innovation outputs, public support has an indirect effect by stimulating R&D intensity,
which has a positive impact on innovations and patent applications. In addition, we also find
that participation in the CDTI loan system and in the European subsidy programme has direct
positive effects on the probability of obtaining product innovations and applying for patents.
REFERENCES
Aerts, K., D. Czarnitzki and F. Andreas (2006), “Evaluación econométrica de la política pú-blica de I+D: estado del arte,” in Heijs and Buesa (eds.): La cooperación en innova-ción en España, el papel del estado. Instituto de Estudios Fiscales, España.
Arvanitis, S. and H. Hollenstein (1994), “Demand and supply factors in explaining the inno-vative activity of Swiss manufacturing firms,” Economics of Innovation and New Technology, 3, 15-30.
Audretsch, D. (1995), Innovation and Industry Evolution, MIT Press: Cambridge, MA.
Barajas, A. and E. Huergo (2010), “International R&D cooperation within the EU Framework Programme: empirical evidence for Spanish firms,” Economics of Innovation and New Technology, 19(1–2), 87–111.
Barajas, A., E, Huergo and L. Moreno (2011), “Las empresas españolas que patentan en la oficina europea,” Economía industrial, 382, 53-62.
Barajas, A., E. Huergo and L. Moreno (forthcoming), “SME performance and public support for international RJVs,” Journal of Small Business Management.
Bayona-Sáez, C. and T. García-Marco (2010), “Assessing the effectiveness of the Eureka program,” Research Policy, 39, 1375–1386.
Beneito, P. (2003),“Choosing among alternative technological strategies: An empirical analy-sis of formal sources of innovation,” Research Policy, 32, 693-713.
Benfratello, L. and A. Sembenelli (2002), “Research joint ventures and firm-level perfor-mance,” Research Policy, 31, 493-507.
Blanes, J. V. and I. Busom (2004), “Who participates in R&D subsidy programs? The case of Spanish manufacturing firms,” Research policy, 33(10), 1459-1476.
Busom, I. (2000), “An empirical evaluation of the effects of R&D subsidies,” Economics of Innovation and New Technology, 9(2), 111-148.
Busom, I. and A. Fernández-Ribas (2007), “Do R&D Programs of different government lev-els overlap in the European Union?” Science, Technology and Innovation Policy, At-lanta Conference, 1-5.
Busom, I. M. B. Corchuelo and E. Martínez-Ros (forthcoming), “Tax incentives... or subsi-dies for business R&D?” Small Business Economics.
Cappellari, L. and S.P. Jenkins (2003), “Multivariate probit regression using simulated maxi-mum likelihood,” The Stata Journal, 3(3), 278-294.
Cerulli, G. and B. Potì (2012), “Evaluating the robustness of the effect of public subsidies on a firm’s R&D: An application to Italy”, Journal of Applied Economics, 15(2), 287-320.
Clausen, T. H. (2008), “Do subsidies have positive impacts on R&D and innovations activi-ties at the firm level?” TIK Working papers on Innovation Studies No. 20070615. Oslo.
Czarnitzki, D. and G. Licht (2006), “Additionality of Public R&D grants in a transition econ-omy: the case of Eastern Germany,” The Economics of Transition, 14(1), 101-131.
Czarnitzki D., B. Ebersberger and A. Fier (2007), “The relationship between R&D Collabora-tion, subsidies and R&D performance: Empirical evidence from Finland and Germa-ny,” Journal of Applied Econometrics, 22(7), 1347-1366.
Czarnitzki, D. and C. Lopes-Bento (2011), “Innovation subsidies: Does the funding source matter for innovation intensity and performance? Empirical evidence from Germany,” CEPS/INSTEAD Working Paper Series 2011-42, CEPS/INSTEAD.
Duguet, E. (2004), “Are R&D subsidies a substitute or a complement to privately funded R&D? Evidence from France using propensity score methods for non-experimental da-ta,” Revue d’Economie Politique, 114(2), 263-292.
European Commission (2009), Analysing and Evaluating the Impact on Innovation of Public-ly Funded Research Programmes: Lot 2 – Benchmarking Strategies and Methodolo-gies of National, European and International R&D Programmes to Assess and In-crease their Impact on Innovation, Final Report, European Commission, DG Enter-prise.
García, A. and P. Mohnen (2010), “Impact of government support on R&D and innovation,” UNU-MERIT Working Paper Series 2010-034, United Nations University, Maastricht Economic and Social Research and Training Centre on Innovation and Technology.
González, X., Jaumandreu, J. and C. Pazó (2005), “Barriers to innovation and subsidy effec-tiveness,” The Rand Journal of Economics, 36(4), 930-949.
González, X. and C. Pazó (2008), “Do public subsidies stimulate private R&D spending?”
Research Policy, 37(3), 371-389.
Griffith, R., E. Huergo, J. Mairesse and B. Peters (2006), “Innovation and productivity across four European countries,” Oxford Review of Economic Policy, 22(4), 483-498.
Guo, S. and M. W. Fraser (2010), Propensity Score Analysis: Statistical Methods and Appli-cations, SAGE publications, Inc.
Hall, B. H., (2002), “The financing of research and development,” NBER Working Papers 8773, National Bureau of Economic Research, Inc.
Hall, B., F. Lotti and J. Mairesse (2009), “Innovation and productivity in SMEs. Empirical evidence for Italy,” Small Business Economics, 33, 13-33.