Modeling the Helpful Opinion Mining of Online Consumer Reviews as
a Classification Problem
Yi-Ching Zeng
Department of Computer Science and
Information Engineering
Chaoyang University of Technology,
Taichung, Taiwan, R.O.C
[email protected]
Shih-Hung Wu
*Department of Computer Science and
Information Engineering
Chaoyang University of Technology,
Taichung, Taiwan, R.O.C
[email protected]
*
contact author
Abstract
The paper aims to address an opinion mining problem: to find the helpful reviews from online consumer reviews before mining the detail. This task can benefit both the consumers and the companies. Consumers can read only the helpful opinions from helpful reviews before they purchase a product, while the companies can acquire the true reason why one product is liked or hated.A system is built to assess the difficulty of the problem. The experiment results show that helpful reviews can be identified with high precision from unhelpful ones.
1
Introduction
Online consumer (or customer) review is a very important information source for many potential consumers to decide whether to buy or not. Li et al. (2011) shows that comparing to an expert product review “the consumer product review in the online shopping environment will be perceived by consumers to be more credible”. This fact makes opinion mining on consumer reviews more interesting since it shows that opinions from other consumers are more helpful than those from experts. However, some reviews are not that helpful, as we can see from the vote of all readers on each consumer review on Ama-zon.com.
The paper aims to address an opinion mining problem: to find the helpful reviews from online consumers’ reviews before mining the infor-mation from it. This task can benefit both the consumers and the companies. Consumers can read only the useful opinions from useful
re-views before they purchase a product, while the companies can acquire the true reason why one product is liked or hated. Both save time from reading meaningless opinions that do not show good reasons. Figure 1 shows a clip image of an Amazon.com customer review. Each review has labeled the stars by the author and the number of people found the review helpful and the number of total number. A three-class classification problem is defined to model this application. A system is design to find the helpful positive re-views, for finding good reasons to buy a product; the helpful negative reviews, for finding reasons not to buy a product; and filtering out the unhelp-ful reviews no matter they are positive or nega-tive.
Figure 1: A clip image of an Amazon.com cus-tomer review.
The paper is organized as follows: Section 2 describes the features that can be used to classify the reviews into the helpful or the unhelpful ones. Section 3 describes the data collection of this study. Section 4 reports and discusses the exper-iment. The final section gives conclusions and future works.
1.1 Related Works
Early works on opinion mining focused on the polarity of opinion, positive or negative, this kind of opinion mining was also called sentiment analysis. Another kind of opinion mining focused on finding the detail information of a product from reviews; such approach was a kind of information extraction (Hu & Liu, 2004). Re-cent researches focus on assessing the review quality before mining the opinion.
Kim et al. (2006) explored the use of some semantic features for review helpfulness ranking. They found that some important features of review, including Length, Unigrams, and Stars might provide the basis for assessing helpfulness of reviews.
Siersdorfer et al. (2010) presented a system that could automatically structure and filter comments for YouTube videos by analyzing dependencies between comments, views, comment ratings and topic categories. The method used the SentiWordNet thesaurus, a lexical WordNet-based resource containing sentiment annotations. Moghaddam et al. (2011) proposed Matrix Factorization Model and Tensor Factorization Model for the prediction of the quality of online reviews, and evaluated the models by using a real life database from Epinions.com.
Lu (2010) exploited contextual information about authors’ identities and social networks for improving review quality prediction. The method provided a generic framework for incorporating social context information by adding regulariza-tion constraints to the text-based predictor.
Xiong and Litman (2011) investigated the utility of incorporating additionally specialized features tailored to peer-review helpfulness. They found that structural features, review unigrams and meta-data combination were useful in modeling the helpfulness of both peer reviews and product reviews.
2
Classification Features
2.1 Manual Observation
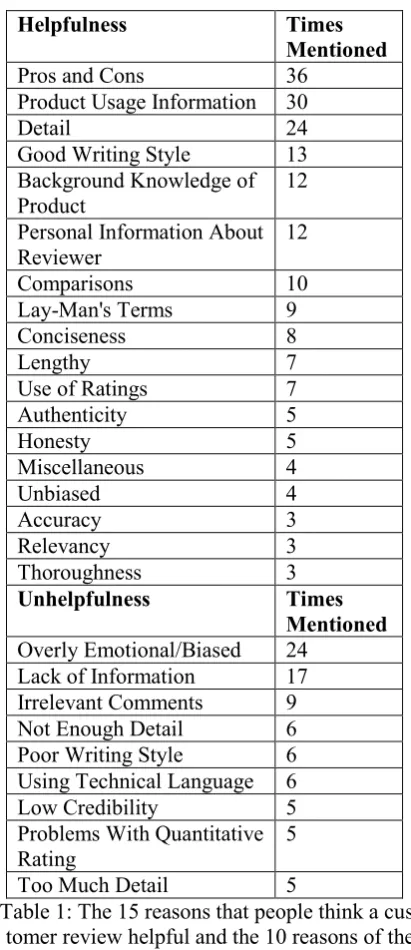
Manual observation is necessary to find features for the helpful/unhelpful classification. Connors et al. (2011) gave a list on common ideas related to helpfulness and unhelpfulness, as shown in Table 1, which was collected from 40 students, each student reading 20 online reviews about a single product and giving comments on the re-views. The study provided 15 reasons that people think a consumer review helpful and 10 reasons
of the unhelpful. These ideas can be viewed as features for a NLP classifier. However, some of them are hard to implement and require clear definition.
Helpfulness Times
Mentioned Pros and Cons 36
Product Usage Information 30
Detail 24
Good Writing Style 13 Background Knowledge of Product
12
Personal Information About Reviewer
12
Comparisons 10 Lay-Man's Terms 9 Conciseness 8
Lengthy 7
Use of Ratings 7 Authenticity 5
Honesty 5
Miscellaneous 4 Unbiased 4
Accuracy 3
Relevancy 3 Thoroughness 3 Unhelpfulness Times
Mentioned Overly Emotional/Biased 24
Lack of Information 17 Irrelevant Comments 9 Not Enough Detail 6 Poor Writing Style 6 Using Technical Language 6 Low Credibility 5 Problems With Quantitative Rating
5
[image:2.595.310.516.129.605.2]Too Much Detail 5
Table 1: The 15 reasons that people think a cus-tomer review helpful and the 10 reasons of the
unhelpful (Connors et al., 2011)
2.2 Features
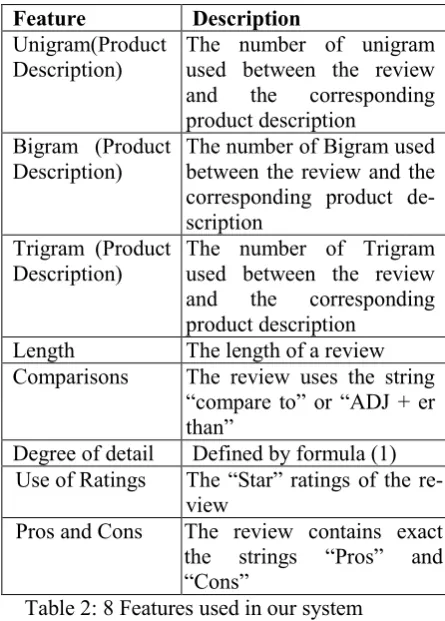
Table 2 lists the features that we implement in this study. Comparing to the features used in previous works of Kim et al. (2006), we add more features based on the observation of Con-nors et al. (2011), especially the degree of detail.
The fourth feature is the length of a review. A very short review cannot give much information and a long review might give more useful infor-mation. The fifth feature is whether the review compared something or not. A good review should compare the product to other similar product. Our program detects the string “com-pare to” or the pattern “ADJ+er than” exist in the review or not with the help of a list of compara-tive adjeccompara-tives. The sixth feature is the degree of detail, which is a combination form of both length and n-gram. The degree of detail is not well-defined in previous work. Our definition is only a tentative one. We define the degree of de-tail of a review as:
(1)
where product information is the number of common words between a review and the corresponding product description. The seventh feature is the num-ber of stars given by the review author. The eighth feature is whether the review contains “Pros” and “Cons” or not. Our system detects the string “Pros” and “Cons” existing in the review or not.
Feature Description Unigram(Product
Description)
The number of unigram used between the review and the corresponding product description
Bigram (Product Description)
The number of Bigram used between the review and the corresponding product de-scription
Trigram (Product Description)
The number of Trigram used between the review and the corresponding product description
Length The length of a review Comparisons The review uses the string
“compare to” or “ADJ + er than”
Degree of detail Defined by formula (1) Use of Ratings The “Star” ratings of the
re-view
[image:3.595.70.293.383.694.2]Pros and Cons The review contains exact the strings “Pros” and “Cons”
Table 2: 8 Features used in our system
3
Data Collection
In order to test the idea, we collect online cus-tomer reviews manually from Amazon.com in March and April 2013. The reviews are in eight
different product domains: Book, Digital Camera, Computer, Foods & Drink, Movie, Shoes, Toys, and Cell-phone. We collect the first available 1000+ reviews with equal number of one to five stars without any special selection criterion in each domain. The average length is 80.63 words. The summery of our data collection is listed in Table 3.
[image:3.595.70.294.387.683.2]The helpfulness score is given by the readers. As shown in Figure 1, the reviewer labeled the number of stars and other users voted the review as helpful or unhelpful. We take the confidence of being helpful as an index to sort the reviews. Figure 2 shows the distribution of polarity (form 1 to 5 star) and helpful/unhelpful confidence, where the y-axis is the confidence score. Note that the confidence score in previous work is de-fined as:
(2) However, since there are some high confidence reviews with only very little support, the reviews might not be very helpful. We discount the con-fidence of them by redefining the concon-fidence score as the log-support confidence (LSC):
(3)
Figure 2 shows the data distribution. We can see that most reviews are positive and regard the helpfulness with high confidence. This fact shows that readers think other consumers are credible. The confidence of helpfulness is lower for the negative reviews. The confidence scores of each product domain are in Table 4.
3.1 Three-class classification problem Instead of finding the correlation between the ranking of helpfulness and the prediction, we define the problem as a three class classification problem. The three-classes are: helpful positive reviews, for finding good reasons to buy a product; the helpful negative reviews, for finding reasons not to buy a product; and the unhelpful reviews.
Since there is no strong boundary between the helpful and the unhelpful, one purpose of the system is to filter out the most unhelpful reviews. The sizes of the three classes are adjusted by set-ting different thresholds. A higher threshold
people Total people helpful Think % 100 Confidence ] people Total of # people helpful Think of # people) helpful Think of [(# LSC 10 log
Product information Lengthy
10
means to filter out more data. We can control the filtering level by setting different thresholds.
In our experiments, class 1 includes positive reviews with 4 or 5 stars and the helpfulness confidence is higher than threshold. Class 2 includes negative reviews with 1 to 3 stars and the helpfulness confidence is higher than the threshold. Class 3 is all the other reviews which are regarded as the unhelpful. The reviews that show no tendency to positive or negative are considered as the unhelpful.
Product Reviews
Total Reviews
Words
Average Length s.d.
Book 1,065 93,497 87.79 1.8 Digital
Camera 1,028 93,404 90.85 2.7 Computer 1,067 83,708 78.45 2.1
Foods &
Drink 1,025 71,027 69.29 1.7 Movies 1,097 94,037 88.13 2.5 Shoes 1,000 75,237 75.23 1.6 Toys 1,100 85,196 77.45 1.7
Cell-Phone 1,308 101,957 77.88 2.0 Total /
[image:4.595.76.285.210.387.2]Average 8,690 884,964 80.63 2.02 Table 3: The summary of our data collection
have 8 Classification and 8,690 reviews.
Product LSC Confidence score Average Book 1.134147 Digital Camera 1.37307
Computer 1.140333 Foods & Drink 0.931979 Movies 1.115796 Shoes 0.80848
[image:4.595.316.518.265.579.2]Toys 0.806543 Cell-Phone 1.004922 Total average 1.03940875 Table 4: Eight Products for defined the LSC
threshold in first experiment.
4
Experiment
The goal of the experiment is to test the difficul-ty of the three-class classification problem with different thresholds. We use the libSVM1 toolkit
to build the classifier based on the features de-scribed in section 2.2.
1 http://www.csie.ntu.edu.tw/~cjlin/lib
4.1 Experiment design
We separate the data into training set and test set, each has 7,690 reviews and 1,000 reviews, re-spectively. The different thresholds tested in our experiment are: 1.039, 1.5, and 2.0. The first threshold is the average confidence score in Table 5, which filters out 56.1% of the reviews as the unhelpful; the second threshold 1.5, filters out 79.6%; and the third threshold 2.0, filters out 91.0%. The number of useful (both positive and negative) reviews of each product domain to the three threshold are listed in Table 5, 7, and 9. The sizes of classes corresponding to the three thresholds are show in Table 6, 8, and 10.
Product Reviews
[image:4.595.317.513.266.423.2]Book 522 Digital Camera 698 Computer 532 Foods & Drink 404 Movies 521 Shoes 246 Toys 318 Cell-Phone 571 Total Reviews 3,812
Table 5: Number of reviews over the threshold “1.039”
Classes Reviews % Class 1 :
Useful Positive 2,712 31.2% Class 2 :
Useful Negative 1,100 12.7% Class 3 :
Un-Useful 4,878 56.1% Total Reviews 8,690
Table 6: The size of the three classes with the threshold “1.039”
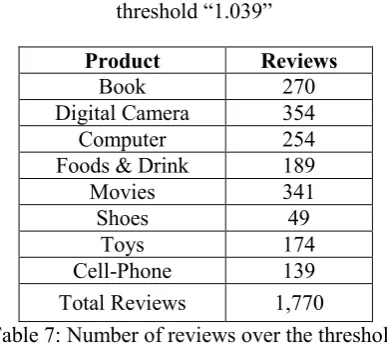
Product Reviews Book 270 Digital Camera 354 Computer 254 Foods & Drink 189 Movies 341 Shoes 49
[image:4.595.76.287.430.605.2]Toys 174 Cell-Phone 139 Total Reviews 1,770
[image:4.595.318.512.559.731.2]Classes Reviews % Class 1 :
Useful Positive
1,265 14.5%
Class 2 : Useful Negative
505 5.8%
Class 3 : Un-Useful
6,920 79.6%
[image:5.595.86.276.69.192.2]Total Reviews 8,690
Table 8: The size of the three classes with the threshold “1.5”
Product Reviews Book 129 Digital Camera 202 Computer 104 Foods & Drink 72
Movies 160 Shoes 9
Toys 73 Cell-Phone 32 Total Reviews 781
Table 9: Number of reviews over the threshold “2.0”
Classes Reviews %
Class 1 : Useful Positive
604 6.9%
Class 2 :
Useful Negative
177 2.0%
Class 3 : Un-Useful
7,910 91.0%
[image:5.595.311.521.70.134.2]Total Reviews 8,690
Table 10: The size of the three classes with the threshold “2.0”
We conduct two experiments; the first one is a 10-fold validation on the training set, and the second one is a test on a separated test set.
4.2 Experiment Results
The average accuracy of the 10-fold cross valida-tion result of each configuravalida-tion is shown in Ta-ble 11. The 7,690 training data is separated into ten folds, and the system uses 90% of the data as the training set and the other 10% as the test set. A SVM classifier is trained in each fold and re-peat 10 times. The result shows that with a high-er threshold, 1.5 or 2.0, the accuracy of our sys-tem is about 72%.
Data set Average Accuracy LSC threshold 1.039 60.83%
LSC threshold 1.5 72.72% LSC threshold 2.0 72.82% Table 11: The average accuracy result of each
data set in the ten-fold cross validation
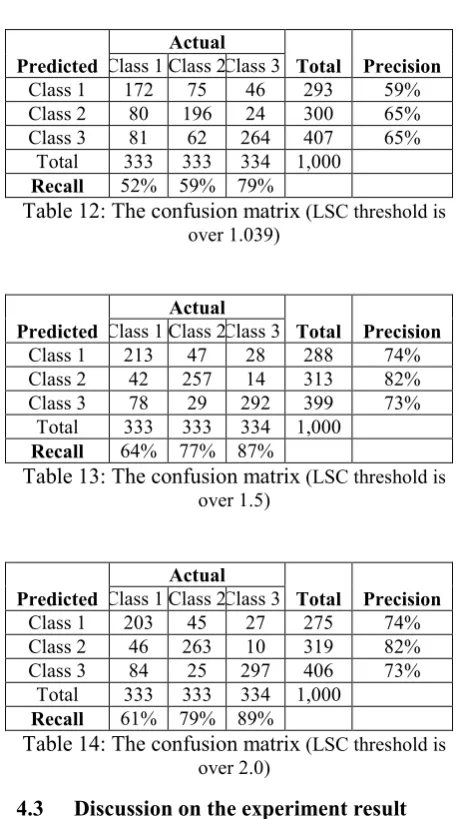
In the second experiment, we use the 7,690 reviews as training set and test the classification on the 1,000 test set, where the number of test of each class is balanced to 1/3. Note that, the actual class of the test is fixed during the test, which is corresponding to a threshold 1.039. The classifier is trained with three different class distributions. The confusion matrix of our system is shown in Table 12 to 14. The precision and the recall of each class are also shown.
Predicted
Actual
Total Precision Class 1 Class 2 Class 3
Class 1 172 75 46 293 59% Class 2 80 196 24 300 65% Class 3 81 62 264 407 65%
[image:5.595.78.282.119.518.2]Total 333 333 334 1,000 Recall 52% 59% 79%
Table 12: The confusion matrix (LSC threshold is over 1.039)
Predicted
Actual
Total Precision Class 1 Class 2 Class 3
Class 1 213 47 28 288 74% Class 2 42 257 14 313 82% Class 3 78 29 292 399 73%
Total 333 333 334 1,000 Recall 64% 77% 87%
Table 13: The confusion matrix (LSC threshold is over 1.5)
Predicted
Actual
Total Precision Class 1 Class 2 Class 3
Class 1 203 45 27 275 74% Class 2 46 263 10 319 82% Class 3 84 25 297 406 73%
[image:5.595.298.530.298.708.2]Total 333 333 334 1,000 Recall 61% 79% 89%
Table 14: The confusion matrix (LSC threshold is over 2.0)
[image:5.595.301.528.545.681.2]of data; our system can get 72.72% accuracy on the helpful/unhelpful classification. This is a great reduce on human labor to find better min-ing candidates. We believe that, with proper number of training data, the accuracy should be around 75%. The accuracy can be higher with more features.
From the confusion matrix in Table 13, we find that, by choosing the threshold 1.5, our system can classify the three classes with precision 74%, 82%, and 73%; while the system recall for the three classes are 64%, 77%, and 87%. We can also find a similar result in Table 14, where the threshold is 2.0. The precision is almost the same, and the recall is different slightly.
5
Conclusion and Future Works
The paper reports how a system can find helpful online reviews and is tested on the three-class classification problem. The threshold of the help-ful/unhelpful can be decided according to the amount of data that the users want to prune. The overall accuracy of three-class problem is about 73%. Helpful negative reviews can be found with 82% precision and 77% recall. Helpful positive reviews can be found with 74% precision and 64% recall. Unhelpful reviews can be filtered out automatically from all the consumer reviews with a high recall rate about 87% and 73% precision. Considering the original distribution (20% as useful), the system performance is quite high. Currently, our system is based on features observed by human in previous works and we only implement some of them. In the future, we will try to implement more features and to extract features from the training corpus automatically.
Acknowledgement
This study was financially supported by the Research Grant NSC 102-2221-E-324 -034 from Taiwan’s Na-tional Science Council.
References
Laura Connors, Susan M. Mudambi, and David Schuff. 2011. Is it the Review or the Reviewer? A Multi-Method Approach to Determine the Anteced-ents of Online Review Helpfulness, Proceedings of the 2011 Hawaii International Conference on Sys-tems Sciences (HICSS), January.
Minqing Hu and Bing Liu. 2004. Mining opinion fea-tures in customer reviews. In Proceedings of the 19th national conference on Artifical intelligence (AAAI'04), Anthony G. Cohn (Ed.). AAAI Press 755-760.
Soo-Min Kim, Patrick Pantel, Tim Chklovski, Marco Pennacchiotti. 2006. Automatically Assessing Re-view Helpfulness, Proceedings of the 2006 Confer-ence on Empirical Methods in Natural Language Processing, pp.423—430.
M. Li, L. Huang, C. Tan, and K. Wei. 2011. Assessing The Helpfulness Of Online Product Review: A Progressive Experimental Approach, In Proceedings of PACIS.
Yue Lu, Panayiotis Tsaparas, Alexandros Ntoulas, Livia Polanyi. 2010. Exploiting Social Context for Review Quality Prediction, Proceedings of the 19th international conference on World wide web pp. 691-700.
Samaneh Moghaddam, Mohsen Jamali, Martin Ester. 2010. Review Recommendation: Personalized Prediction of the Quality of Online Reviews, Proceedings of the 20th ACM international conference on Information and knowledge management pp.2249-2252.
Susan M. Mudambi, and David Schuff. 2010. What Makes a Helpful Online Review? A Study of Cus-tomer Reviews on Amazon.com, MIS Quarterly, (34: 1) pp.185-200.
Stefan Siersdorfer, Sergiu Chelaru, Jose San Pedro. 2010. How useful are your comments?: analyzing and predicting youtube comments and comment ratings, Proceedings of the 19th international con-ference on World wide web pp.891-900.